| Param | Original file | Final file |
|---|---|---|
| Filename | modeM0/AS1A10_071T37_9000005180_36254cztM0_level2.evt | modeM0/AS1A10_071T37_9000005180_36254cztM0_level2_quad_clean.evt |
| Size (bytes) | 571,080,960 | 88,594,560 |
| Size | 544.6 MB | 84.5 MB |
| Events in quadrant A | 3,161,837 | 574,543 |
| Events in quadrant B | 4,547,691 | 572,100 |
| Events in quadrant C | 3,720,675 | 566,639 |
| Events in quadrant D | 5,419,573 | 511,109 |
| Mode SS | |||
|---|---|---|---|
| Quadrant | BADHDUFLAG | Total packets | Discarded packets |
| A | 0 | 138 | 0 |
| B | 0 | 138 | 0 |
| C | 0 | 138 | 0 |
| D | 0 | 138 | 0 |
| Mode M9 | |||
|---|---|---|---|
| Quadrant | BADHDUFLAG | Total packets | Discarded packets |
| A | 0 | 26 | 0 |
| B | 0 | 26 | 0 |
| C | 0 | 26 | 0 |
| D | 0 | 26 | 0 |
| Mode M0 | |||
|---|---|---|---|
| Quadrant | BADHDUFLAG | Total packets | Discarded packets |
| A | 0 | 13456 | 3 |
| B | 0 | 17708 | 2 |
| C | 0 | 14879 | 2 |
| D | 0 | 20426 | 2 |
| Quadrant | Total seconds | Saturated seconds | Saturation percentage |
|---|---|---|---|
| A | 6564 | 16 | 0.243754% |
| B | 6564 | 406 | 6.185253% |
| C | 6564 | 124 | 1.889092% |
| D | 6564 | 568 | 8.653260% |
Noise dominated data is calculated using 1-second bins in cleaned event files. If a bin has >2000 counts, and if more than 50% of those come from <1% of pixels, then it is considered to be noise-dominated and hence unusable.
| Quadrant | # 1 sec bins | Bins with >0 counts | Bins with >2000 counts | High rate bins dominated by noise | Noise dominated (total time) | Noise dominated (detector-on time) | Marked lightcurve |
|---|---|---|---|---|---|---|---|
| A | 9221 | 6566 | 0 | 0 | 0.00% | 0.00% | 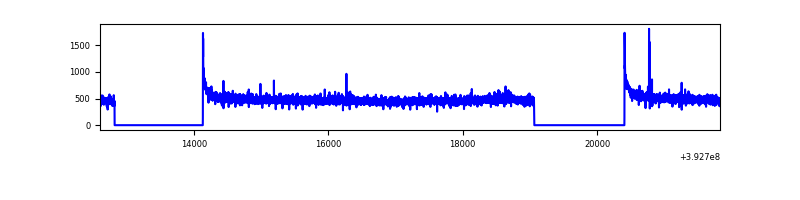 |
| B | 9221 | 6566 | 314 | 314 | 3.41% | 4.78% | 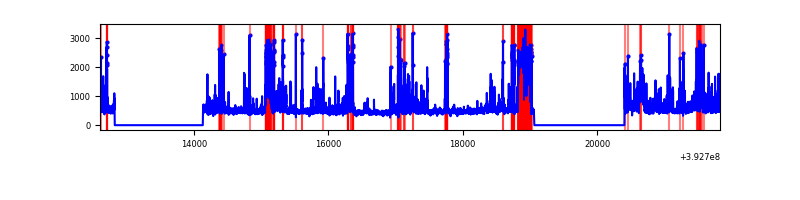 |
| C | 9221 | 6566 | 93 | 93 | 1.01% | 1.42% |  |
| D | 9221 | 6566 | 528 | 528 | 5.73% | 8.04% | 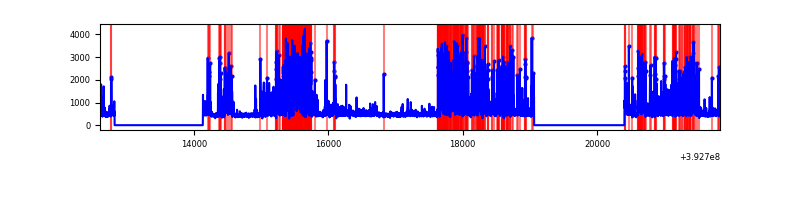 |
Top three noisy pixels from each quadrant. If the there are fewer than three noisy pixels in the level2.evt file, extra rows are filled as -1
| Pixel properties | Quadrant properties | ||||||
|---|---|---|---|---|---|---|---|
| Quadrant | DetID | PixID | Counts | Sigma | Mean | Median | Sigma |
| A | 10 | 83 | 194031 | 1241.56 | 765 | 747 | 155.7 |
| A | 13 | 254 | 12166 | 73.35 | 765 | 747 | 155.7 |
| A | 3 | 137 | 8384 | 49.05 | 765 | 747 | 155.7 |
| B | 5 | 172 | 1121291 | 7804.3 | 738 | 718 | 143.6 |
| B | 5 | 236 | 262873 | 1825.8 | 738 | 718 | 143.6 |
| B | 4 | 232 | 105536 | 730.01 | 738 | 718 | 143.6 |
| C | 0 | 10 | 340595 | 1951.8 | 739 | 742 | 174.1 |
| C | 15 | 214 | 273403 | 1565.91 | 739 | 742 | 174.1 |
| C | 0 | 207 | 228144 | 1305.99 | 739 | 742 | 174.1 |
| D | 12 | 6 | 1975510 | 11191.45 | 717 | 698 | 176.5 |
| D | 13 | 171 | 207465 | 1171.77 | 717 | 698 | 176.5 |
| D | 12 | 227 | 98768 | 555.77 | 717 | 698 | 176.5 |
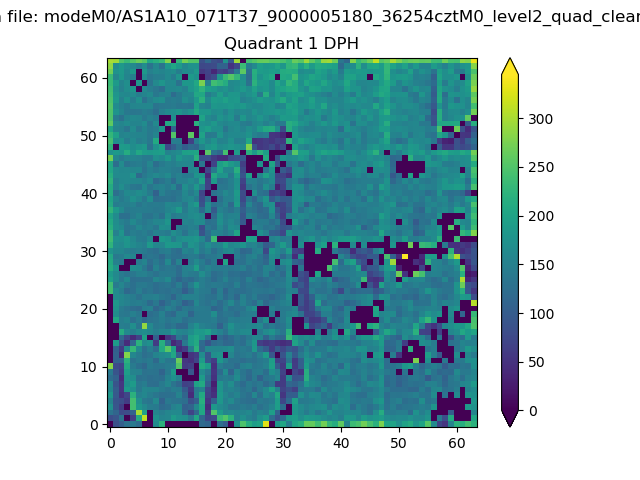
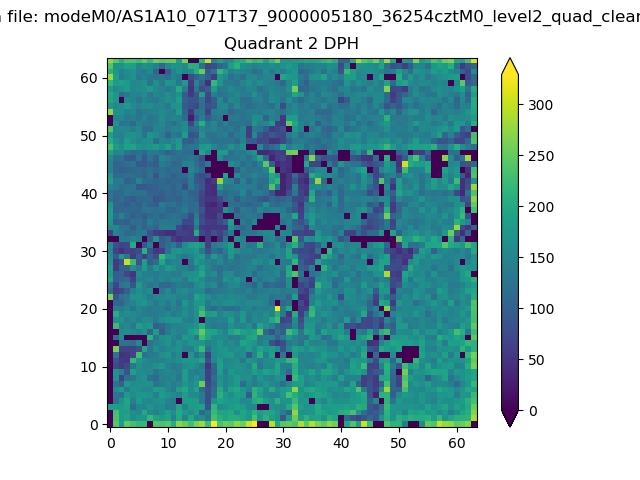
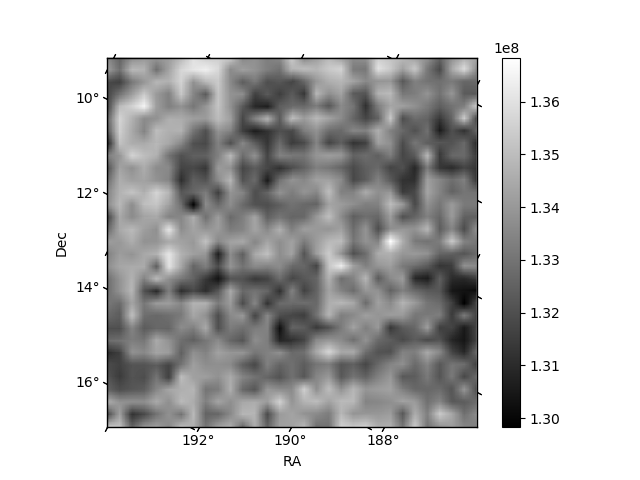
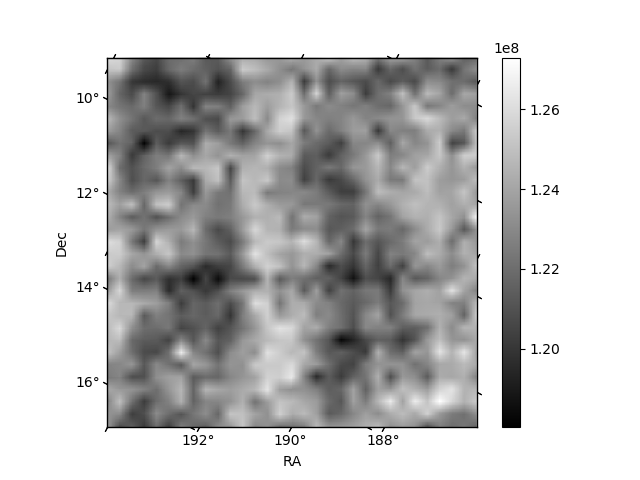
Histogram calculated using DETX and DETY for each event in the final _common_clean file
| Quadrant A | 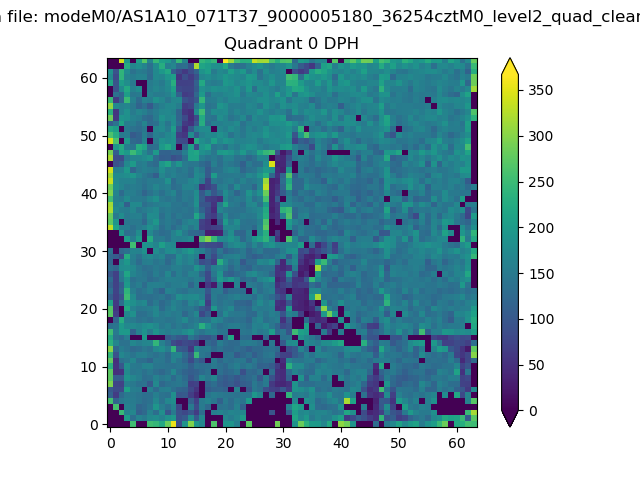 |
 |
Quadrant B |
|---|---|---|---|
| Quadrant D |  |
 |
Quadrant C |
| Plot type | Count rate plots | Images |
|---|---|---|
| Comparison with Poisson distribution Blue bars denote a histogram of data divided into 1 sec bins. Red curve is a Poisson curve with rate = median count rate of data. |
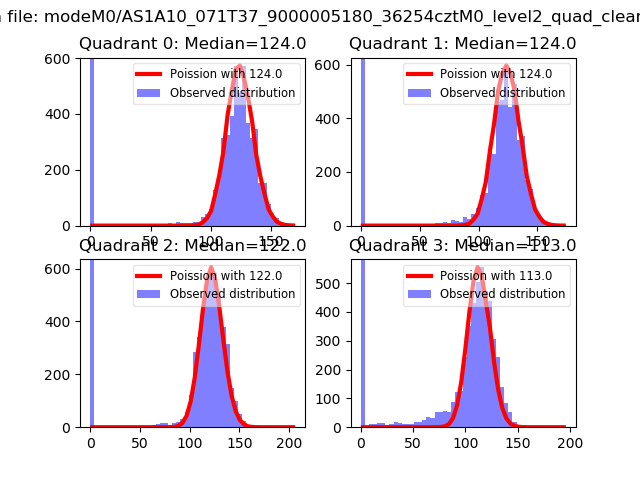 |
 |
| Quadrant-wise count rates Data is divided into 100 sec bins |
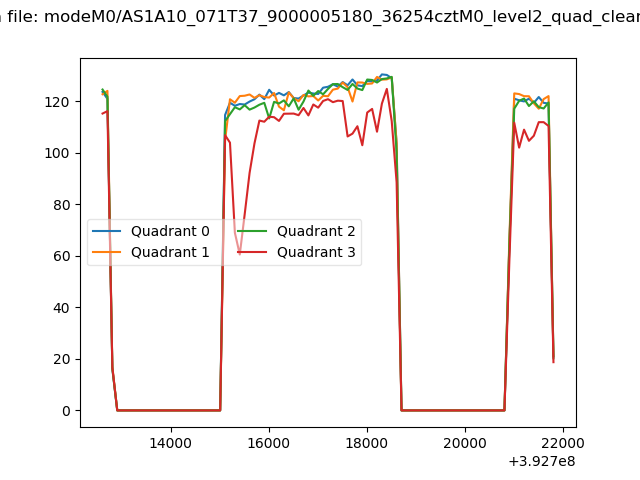 |
|
| Module-wise count rates for Quadrant A Data is divided into 100 sec bins |
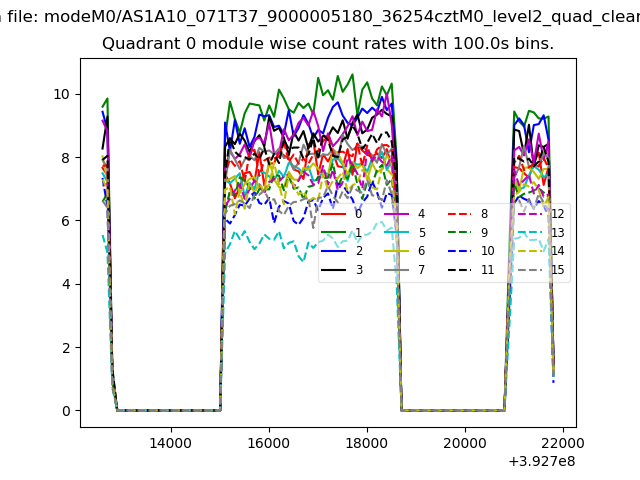 |
 |
| Module-wise count rates for Quadrant B Data is divided into 100 sec bins |
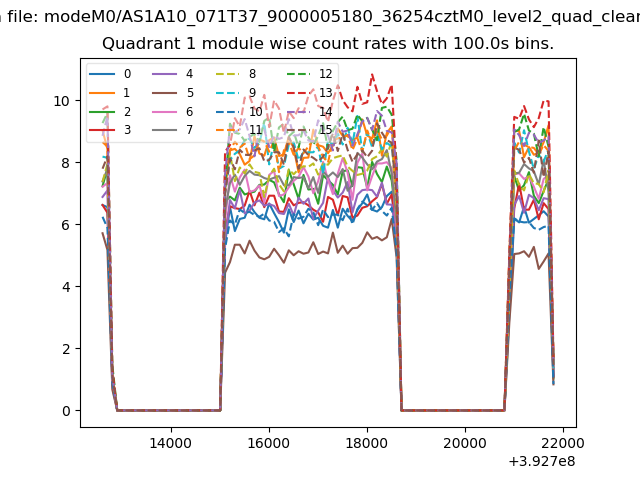 |
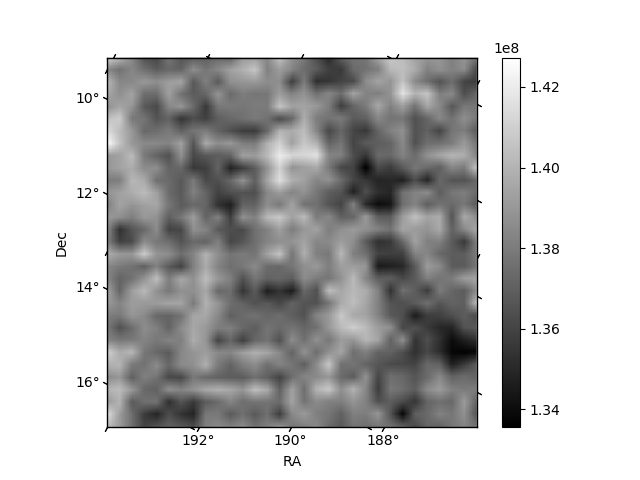 |
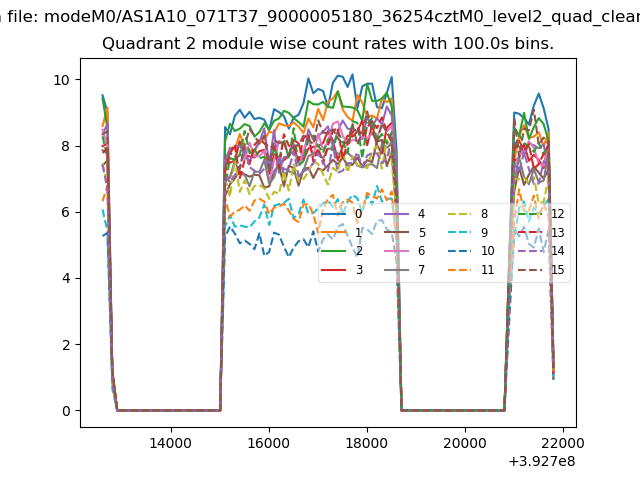
| Module-wise count rates for Quadrant C Data is divided into 100 sec bins |
 |
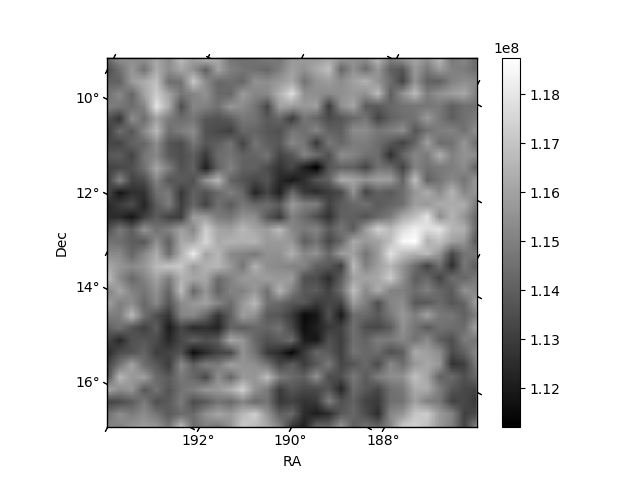 |
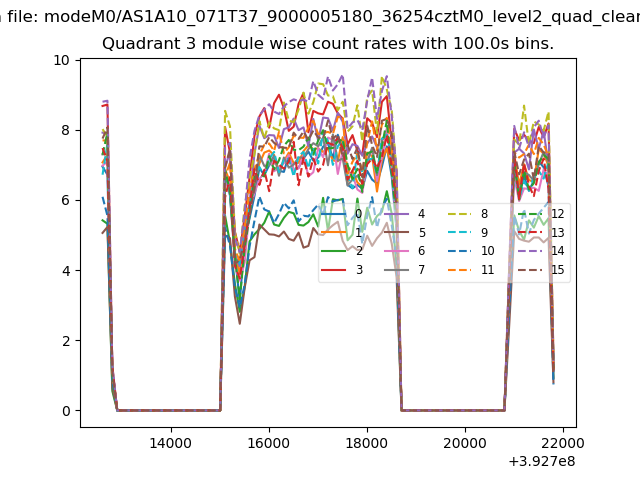
| Module-wise count rates for Quadrant D Data is divided into 100 sec bins |
 |
 |
| Parameter | Plot |
|---|---|
| CZT HV Monitor | 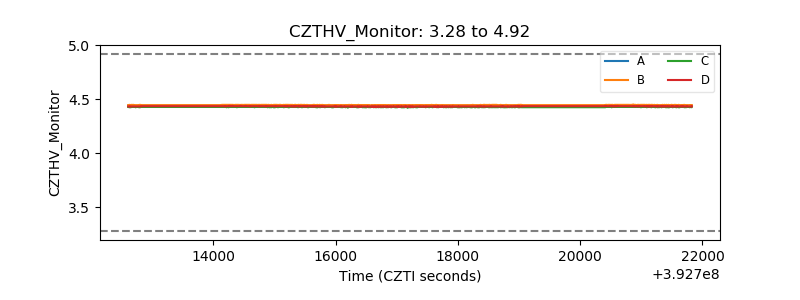 |
| D_VDD |  |
| Temperature 1 | 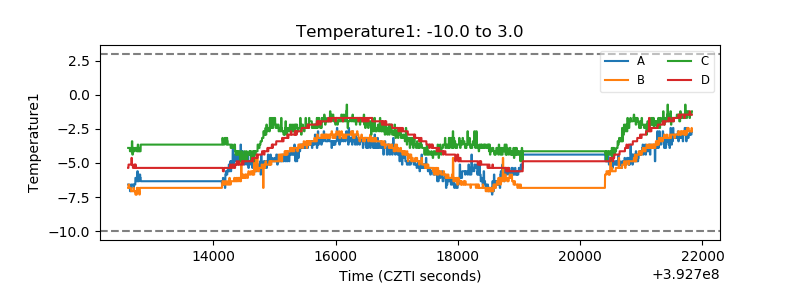 |
| Veto HV Monitor | 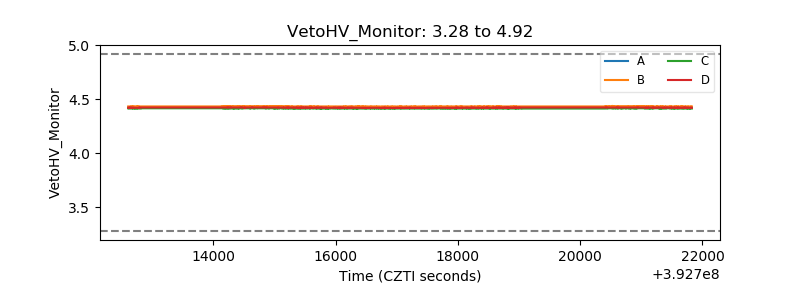 |
| Veto LLD | 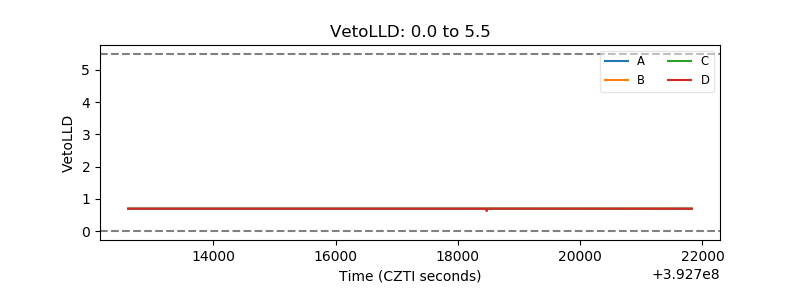 |
| Alpha Counter | 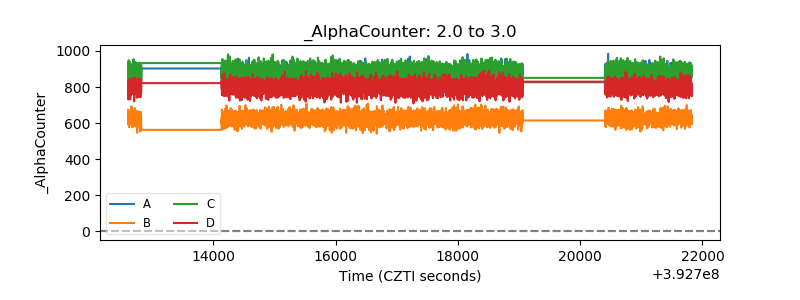 |
| _CPM_Rate | 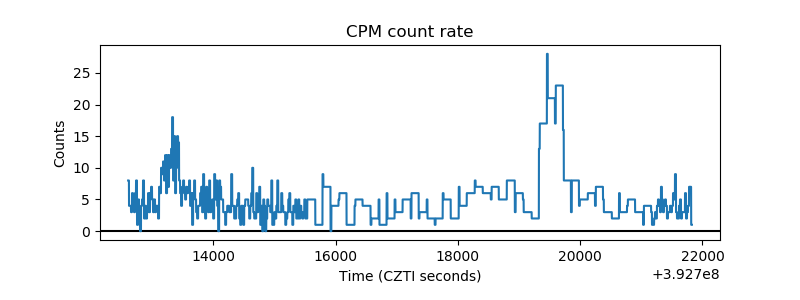 |
| CZT Counter | 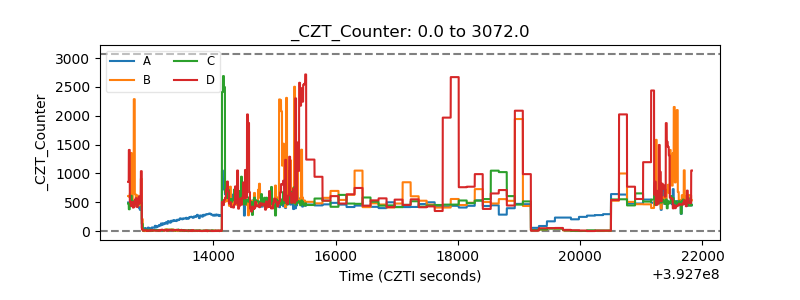 |
| +2.5 Volts monitor | 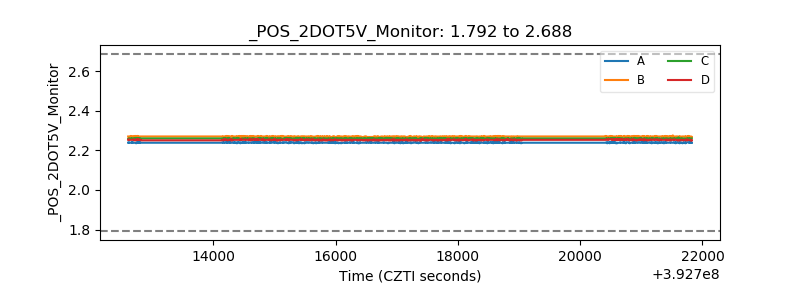 |
| +5 Volts monitor | 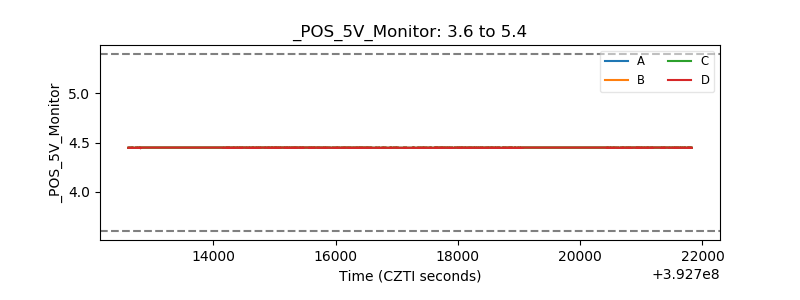 |
| _ROLL_ROT | 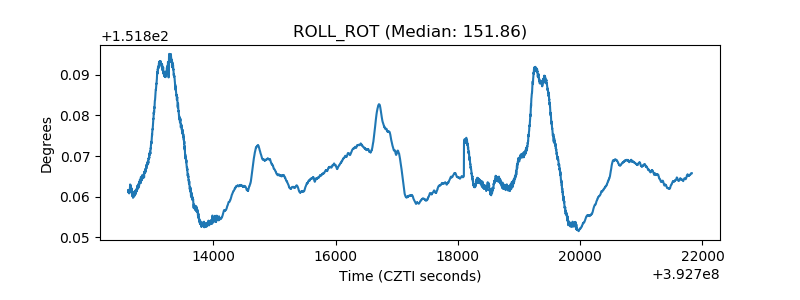 |
| _Roll_DEC | 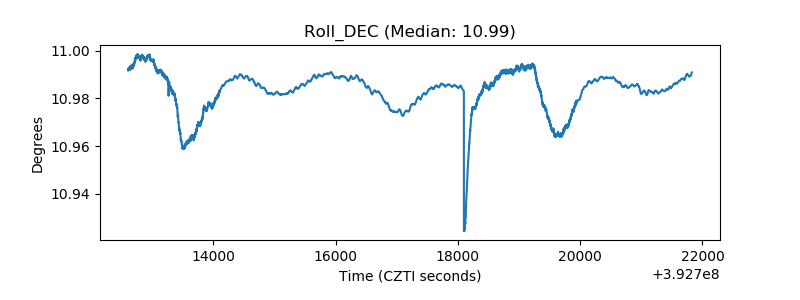 |
| _Roll_RA | 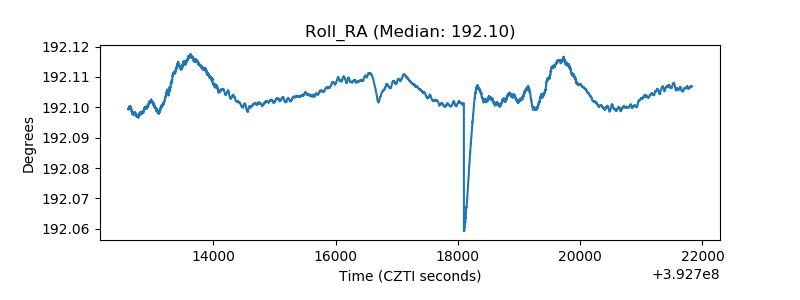 |
| Veto Counter |  |