| Param | Original file | Final file |
|---|---|---|
| Filename | modeM0/AS1A10_071T37_9000005180_36249cztM0_level2.evt | modeM0/AS1A10_071T37_9000005180_36249cztM0_level2_quad_clean.evt |
| Size (bytes) | 471,942,720 | 45,213,120 |
| Size | 450.1 MB | 43.1 MB |
| Events in quadrant A | 2,522,030 | 270,758 |
| Events in quadrant B | 4,798,369 | 231,564 |
| Events in quadrant C | 3,267,832 | 263,512 |
| Events in quadrant D | 3,360,291 | 246,904 |
| Mode SS | |||
|---|---|---|---|
| Quadrant | BADHDUFLAG | Total packets | Discarded packets |
| A | 0 | 104 | 0 |
| B | 0 | 104 | 0 |
| C | 0 | 104 | 0 |
| D | 0 | 104 | 0 |
| Mode M9 | |||
|---|---|---|---|
| Quadrant | BADHDUFLAG | Total packets | Discarded packets |
| A | 0 | 41 | 0 |
| B | 0 | 41 | 0 |
| C | 0 | 41 | 0 |
| D | 0 | 41 | 0 |
| Mode M0 | |||
|---|---|---|---|
| Quadrant | BADHDUFLAG | Total packets | Discarded packets |
| A | 0 | 10591 | 3 |
| B | 0 | 17638 | 2 |
| C | 0 | 12677 | 2 |
| D | 0 | 13308 | 2 |
| Quadrant | Total seconds | Saturated seconds | Saturation percentage |
|---|---|---|---|
| A | 5075 | 12 | 0.236453% |
| B | 5075 | 899 | 17.714286% |
| C | 5075 | 172 | 3.389163% |
| D | 5075 | 188 | 3.704433% |
Noise dominated data is calculated using 1-second bins in cleaned event files. If a bin has >2000 counts, and if more than 50% of those come from <1% of pixels, then it is considered to be noise-dominated and hence unusable.
| Quadrant | # 1 sec bins | Bins with >0 counts | Bins with >2000 counts | High rate bins dominated by noise | Noise dominated (total time) | Noise dominated (detector-on time) | Marked lightcurve |
|---|---|---|---|---|---|---|---|
| A | 9171 | 5077 | 11 | 11 | 0.12% | 0.22% | 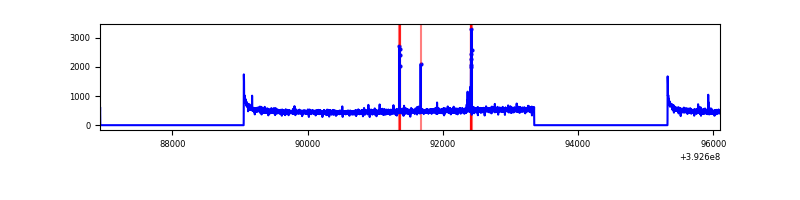 |
| B | 9170 | 5076 | 663 | 663 | 7.23% | 13.06% | 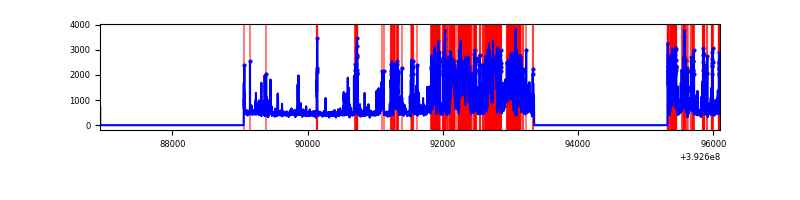 |
| C | 9171 | 5077 | 159 | 159 | 1.73% | 3.13% | 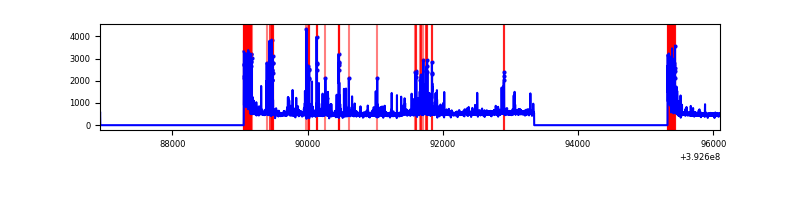 |
| D | 9171 | 5077 | 191 | 191 | 2.08% | 3.76% | 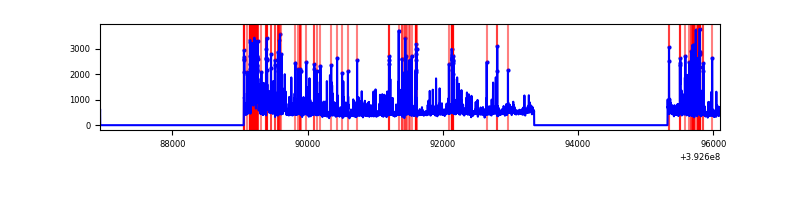 |
Top three noisy pixels from each quadrant. If the there are fewer than three noisy pixels in the level2.evt file, extra rows are filled as -1
| Pixel properties | Quadrant properties | ||||||
|---|---|---|---|---|---|---|---|
| Quadrant | DetID | PixID | Counts | Sigma | Mean | Median | Sigma |
| A | 10 | 83 | 169185 | 1402.77 | 595 | 585 | 120.2 |
| A | 9 | 143 | 42807 | 351.29 | 595 | 585 | 120.2 |
| A | 13 | 254 | 8135 | 62.82 | 595 | 585 | 120.2 |
| B | 5 | 172 | 1838907 | 17103.51 | 554 | 539 | 107.5 |
| B | 4 | 171 | 591709 | 5500.03 | 554 | 539 | 107.5 |
| B | 5 | 236 | 90595 | 837.85 | 554 | 539 | 107.5 |
| C | 0 | 10 | 430445 | 3182.34 | 574 | 578 | 135.1 |
| C | 0 | 207 | 381100 | 2817.04 | 574 | 578 | 135.1 |
| C | 15 | 214 | 211412 | 1560.82 | 574 | 578 | 135.1 |
| D | 12 | 6 | 498749 | 3537.48 | 568 | 551 | 140.8 |
| D | 2 | 250 | 218917 | 1550.52 | 568 | 551 | 140.8 |
| D | 13 | 249 | 133136 | 941.43 | 568 | 551 | 140.8 |
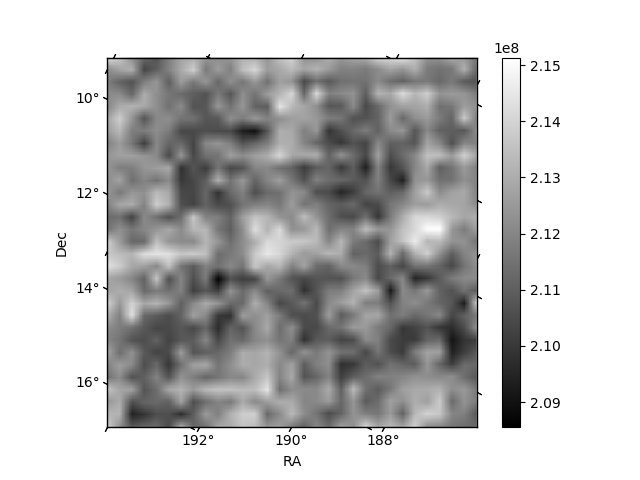
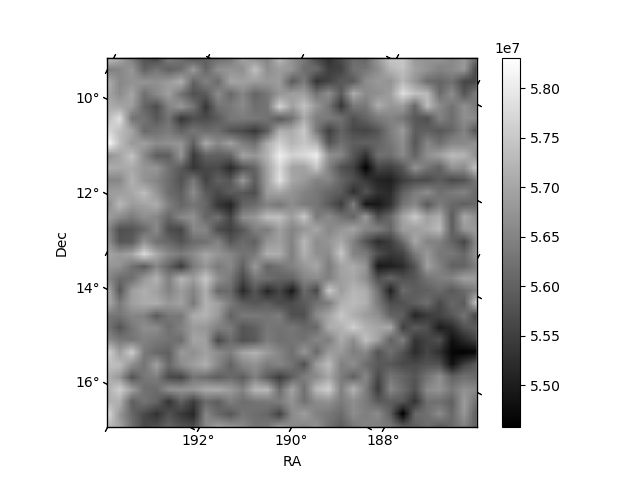
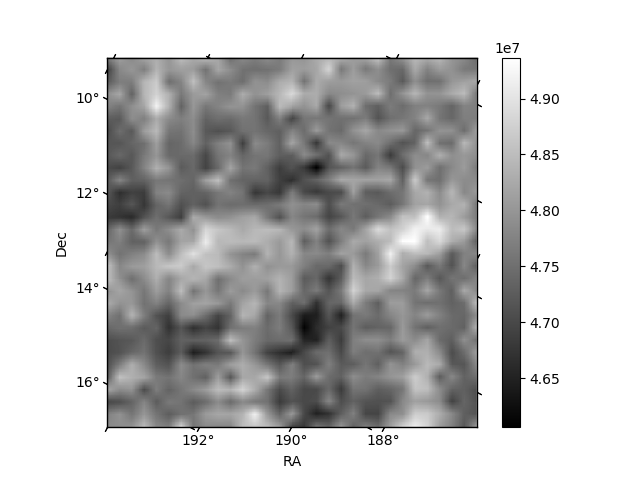
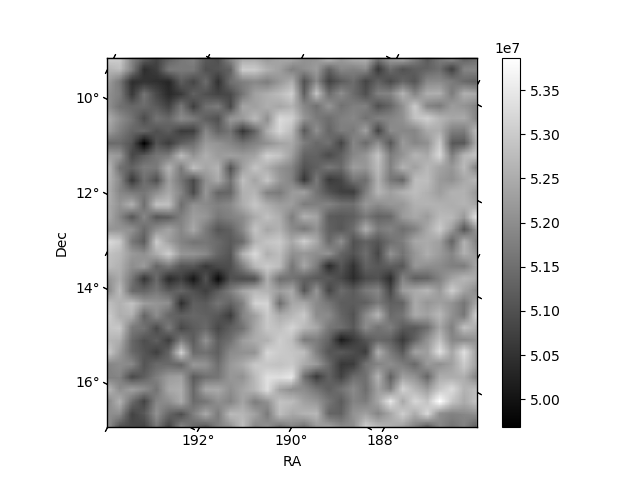
Histogram calculated using DETX and DETY for each event in the final _common_clean file
| Quadrant A | 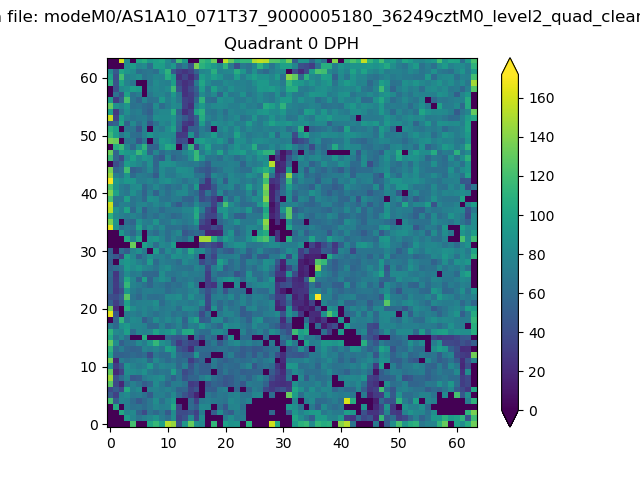 |
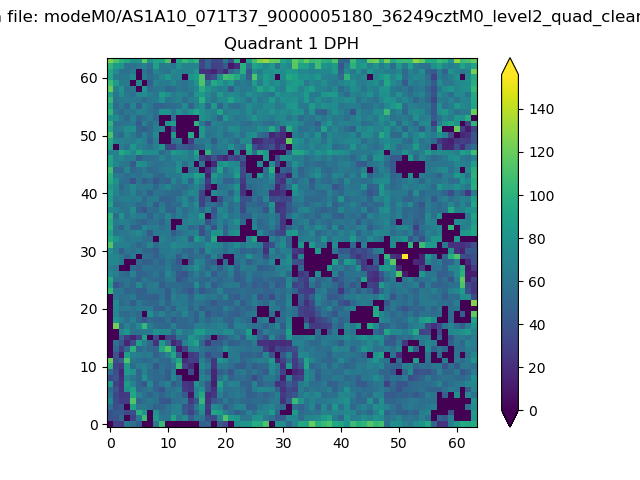 |
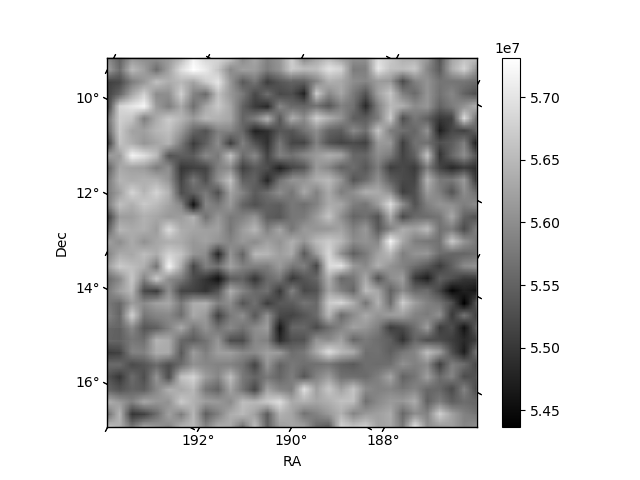
Quadrant B |
|---|---|---|---|
| Quadrant D | 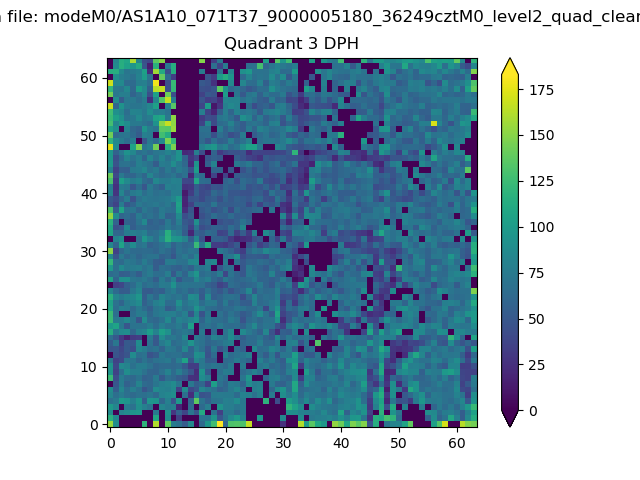 |
 |
Quadrant C |
| Plot type | Count rate plots | Images |
|---|---|---|
| Comparison with Poisson distribution Blue bars denote a histogram of data divided into 1 sec bins. Red curve is a Poisson curve with rate = median count rate of data. |
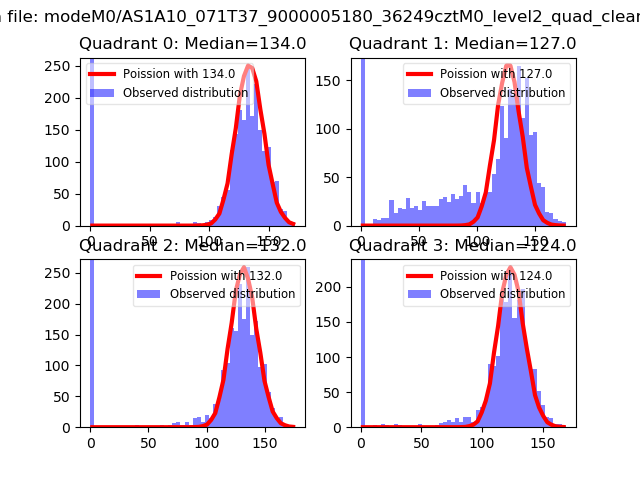 |
 |
| Quadrant-wise count rates Data is divided into 100 sec bins |
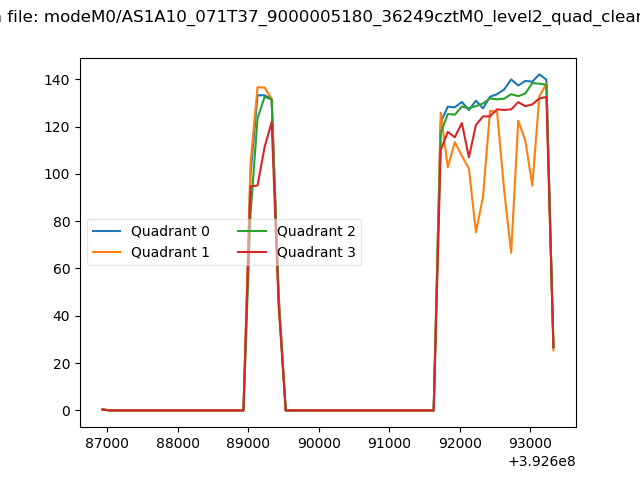 |
|
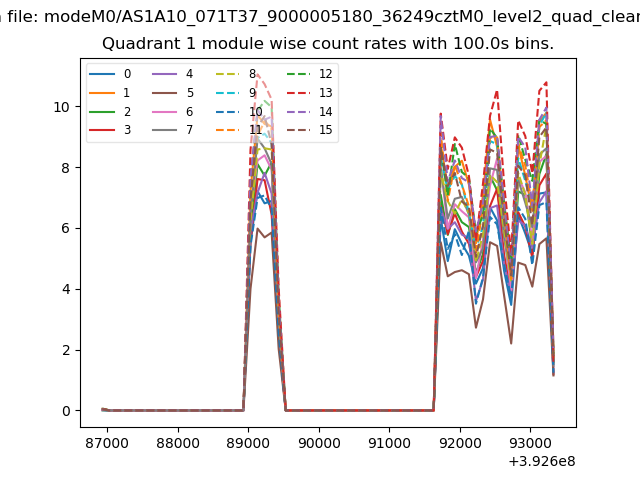
| Module-wise count rates for Quadrant A Data is divided into 100 sec bins |
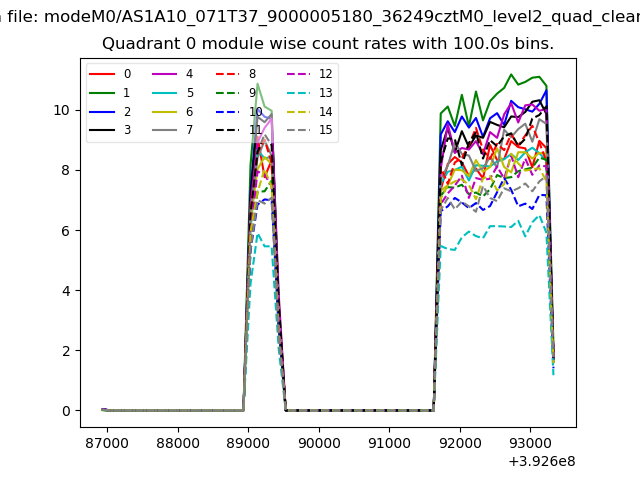 |
 |
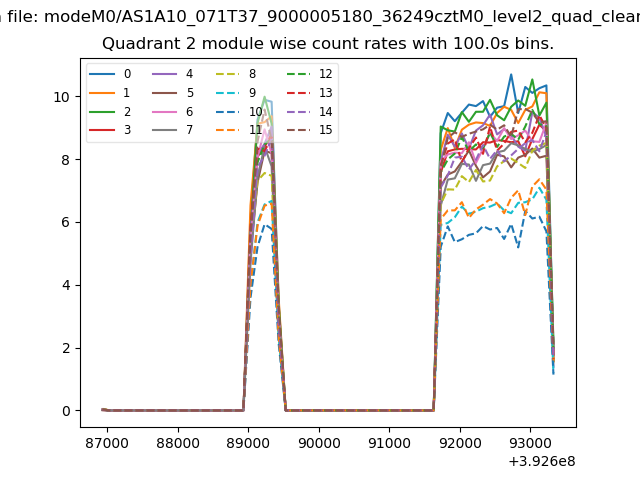
| Module-wise count rates for Quadrant B Data is divided into 100 sec bins |
 |
 |
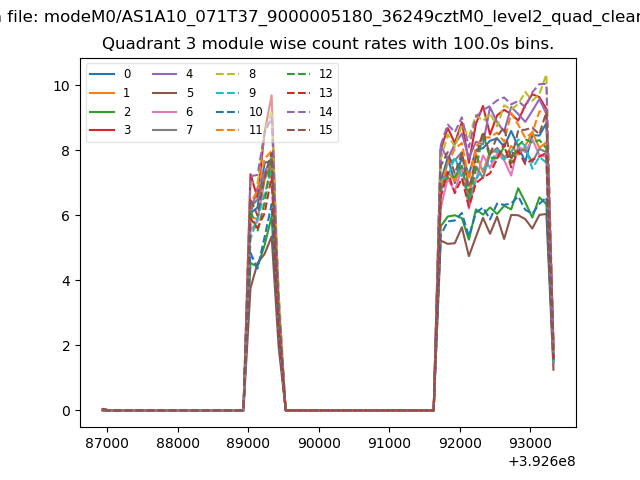
| Module-wise count rates for Quadrant C Data is divided into 100 sec bins |
 |
 |
| Module-wise count rates for Quadrant D Data is divided into 100 sec bins |
 |
 |
| Parameter | Plot |
|---|---|
| CZT HV Monitor | 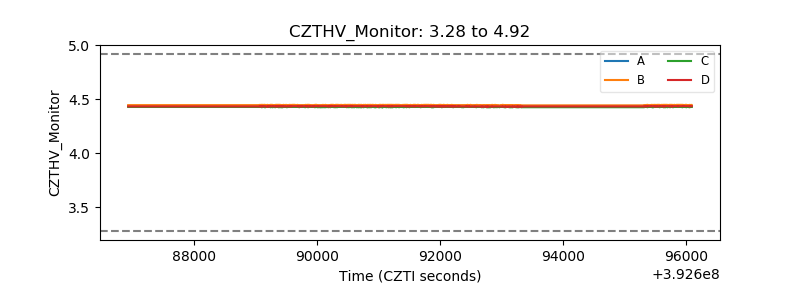 |
| D_VDD | 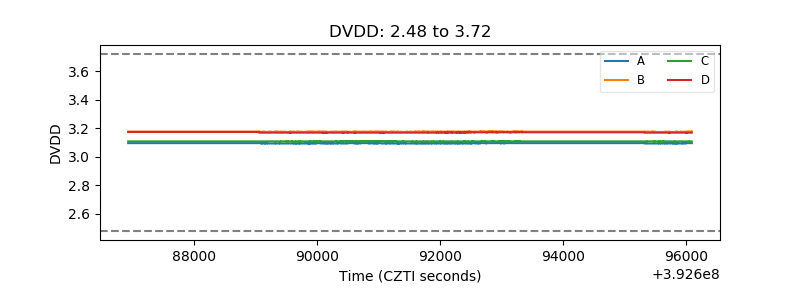 |
| Temperature 1 | 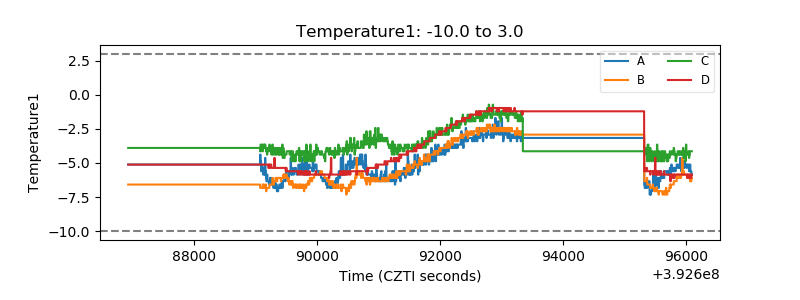 |
| Veto HV Monitor | 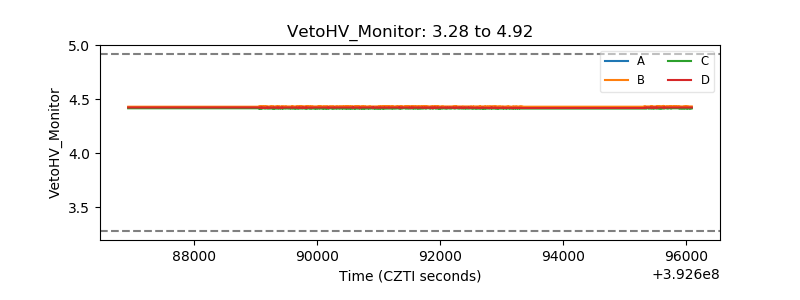 |
| Veto LLD | 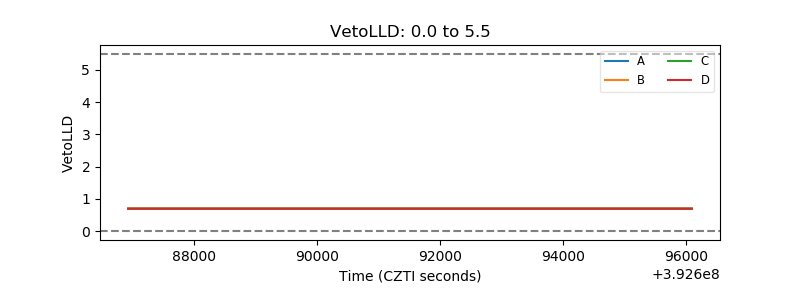 |
| Alpha Counter | 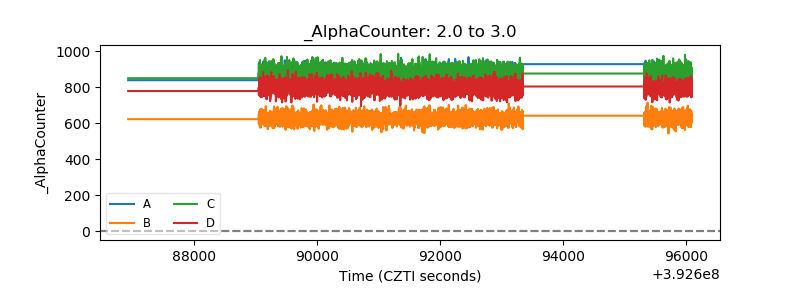 |
| _CPM_Rate | 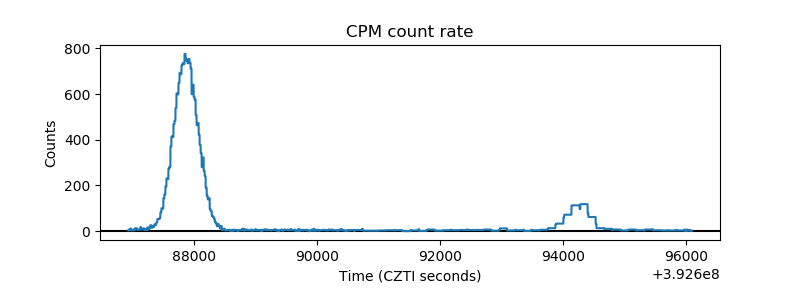 |
| CZT Counter | 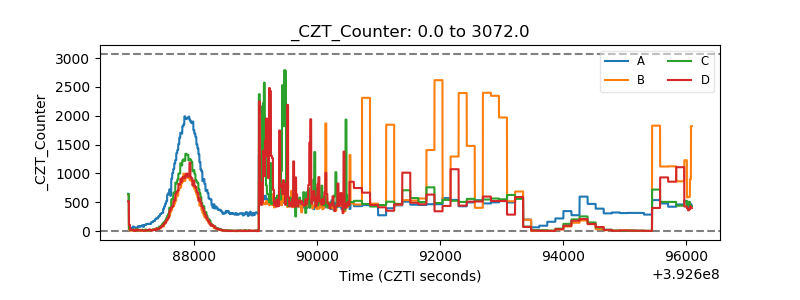 |
| +2.5 Volts monitor | 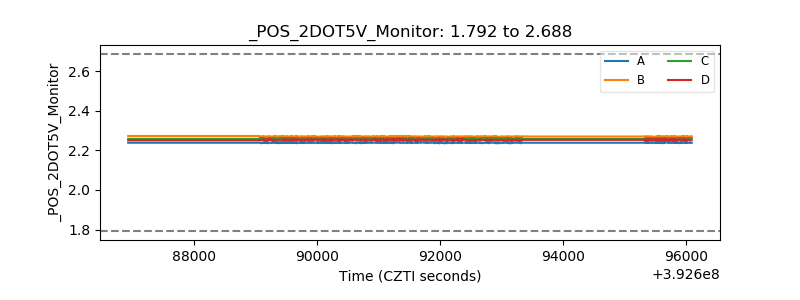 |
| +5 Volts monitor | 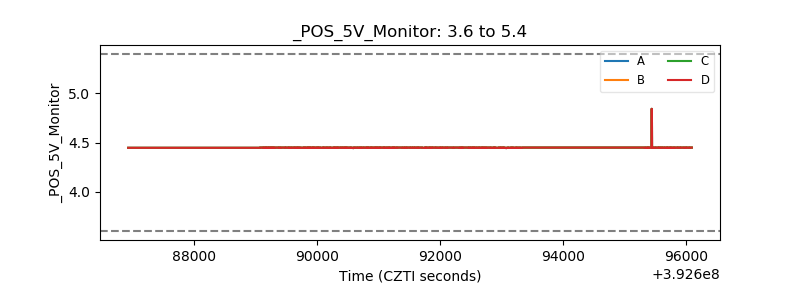 |
| _ROLL_ROT | 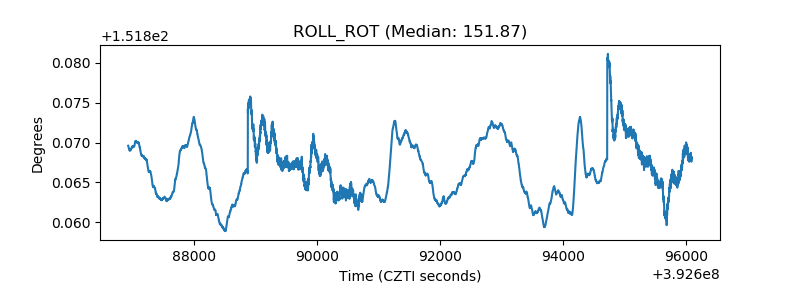 |
| _Roll_DEC | 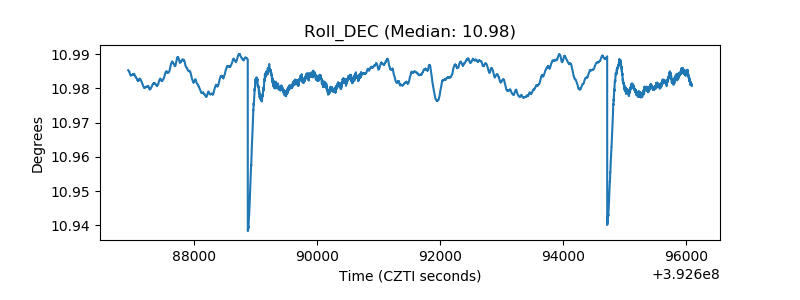 |
| _Roll_RA | 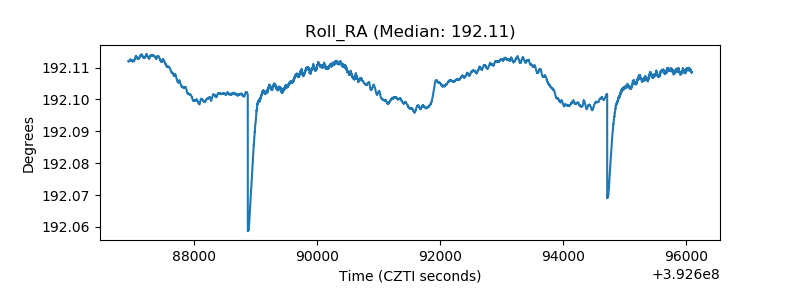 |
| Veto Counter | 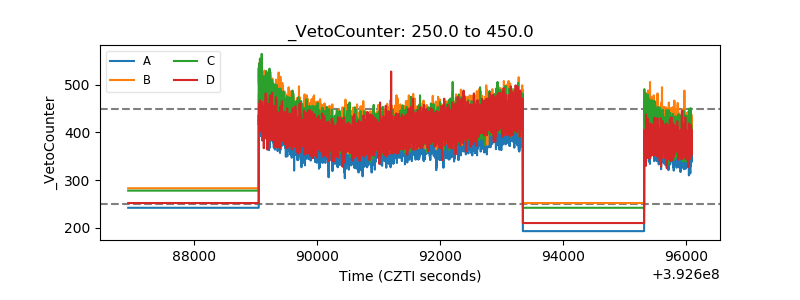 |