| Param | Original file | Final file |
|---|---|---|
| Filename | modeM0/AS1A10_071T37_9000005180_36248cztM0_level2.evt | modeM0/AS1A10_071T37_9000005180_36248cztM0_level2_quad_clean.evt |
| Size (bytes) | 438,678,720 | 51,989,760 |
| Size | 418.4 MB | 49.6 MB |
| Events in quadrant A | 2,448,826 | 320,913 |
| Events in quadrant B | 3,229,822 | 317,470 |
| Events in quadrant C | 3,531,211 | 304,595 |
| Events in quadrant D | 3,745,080 | 289,017 |
| Mode SS | |||
|---|---|---|---|
| Quadrant | BADHDUFLAG | Total packets | Discarded packets |
| A | 0 | 100 | 0 |
| B | 0 | 100 | 0 |
| C | 0 | 100 | 0 |
| D | 0 | 100 | 0 |
| Mode M9 | |||
|---|---|---|---|
| Quadrant | BADHDUFLAG | Total packets | Discarded packets |
| A | 0 | 37 | 0 |
| B | 0 | 37 | 0 |
| C | 0 | 37 | 0 |
| D | 0 | 38 | 0 |
| Mode M0 | |||
|---|---|---|---|
| Quadrant | BADHDUFLAG | Total packets | Discarded packets |
| A | 0 | 10150 | 3 |
| B | 0 | 12667 | 2 |
| C | 0 | 13545 | 2 |
| D | 0 | 14420 | 2 |
| Quadrant | Total seconds | Saturated seconds | Saturation percentage |
|---|---|---|---|
| A | 4865 | 4 | 0.082220% |
| B | 4865 | 231 | 4.748201% |
| C | 4865 | 222 | 4.563207% |
| D | 4865 | 260 | 5.344296% |
Noise dominated data is calculated using 1-second bins in cleaned event files. If a bin has >2000 counts, and if more than 50% of those come from <1% of pixels, then it is considered to be noise-dominated and hence unusable.
| Quadrant | # 1 sec bins | Bins with >0 counts | Bins with >2000 counts | High rate bins dominated by noise | Noise dominated (total time) | Noise dominated (detector-on time) | Marked lightcurve |
|---|---|---|---|---|---|---|---|
| A | 6988 | 4866 | 0 | 0 | 0.00% | 0.00% | 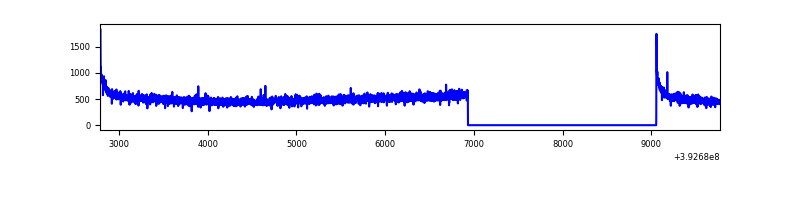 |
| B | 6988 | 4866 | 166 | 166 | 2.38% | 3.41% | 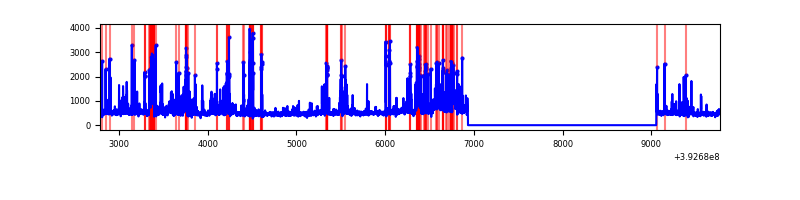 |
| C | 6988 | 4866 | 200 | 200 | 2.86% | 4.11% | 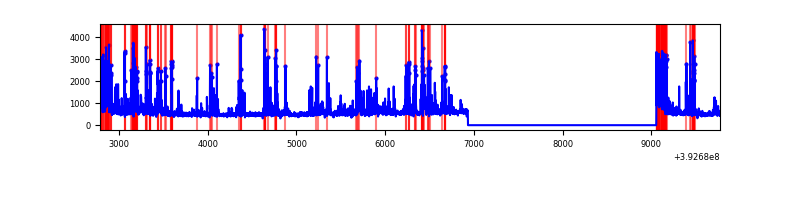 |
| D | 6988 | 4866 | 265 | 265 | 3.79% | 5.45% | 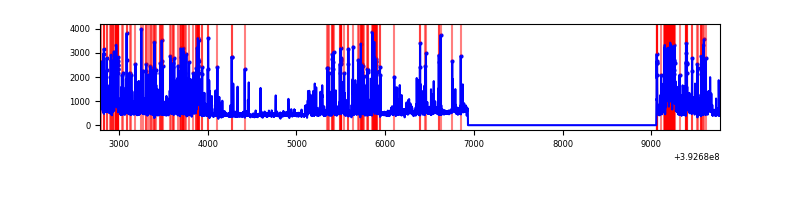 |
Top three noisy pixels from each quadrant. If the there are fewer than three noisy pixels in the level2.evt file, extra rows are filled as -1
| Pixel properties | Quadrant properties | ||||||
|---|---|---|---|---|---|---|---|
| Quadrant | DetID | PixID | Counts | Sigma | Mean | Median | Sigma |
| A | 10 | 83 | 165126 | 1389.76 | 588 | 578 | 118.4 |
| A | 13 | 254 | 8088 | 63.43 | 588 | 578 | 118.4 |
| A | 13 | 6 | 7227 | 56.16 | 588 | 578 | 118.4 |
| B | 5 | 236 | 466113 | 4203.59 | 579 | 566 | 110.7 |
| B | 5 | 172 | 348629 | 3142.79 | 579 | 566 | 110.7 |
| B | 8 | 128 | 59748 | 534.38 | 579 | 566 | 110.7 |
| C | 0 | 207 | 878624 | 6667.14 | 563 | 568 | 131.7 |
| C | 0 | 10 | 250383 | 1896.86 | 563 | 568 | 131.7 |
| C | 15 | 214 | 202372 | 1532.31 | 563 | 568 | 131.7 |
| D | 12 | 6 | 1059604 | 7783.28 | 552 | 537 | 136.1 |
| D | 13 | 171 | 141113 | 1033.12 | 552 | 537 | 136.1 |
| D | 10 | 118 | 117127 | 856.84 | 552 | 537 | 136.1 |
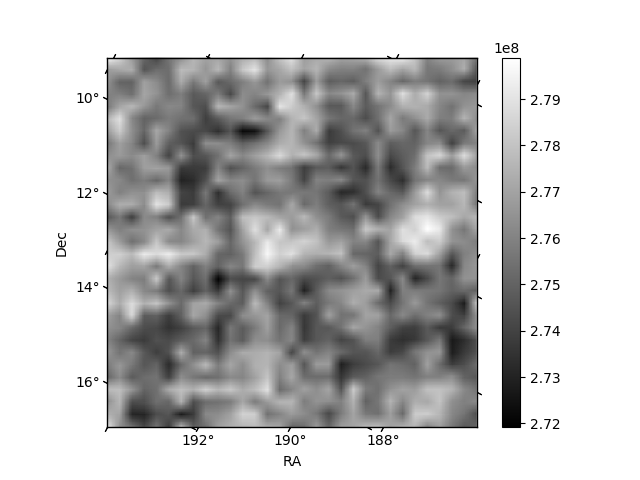
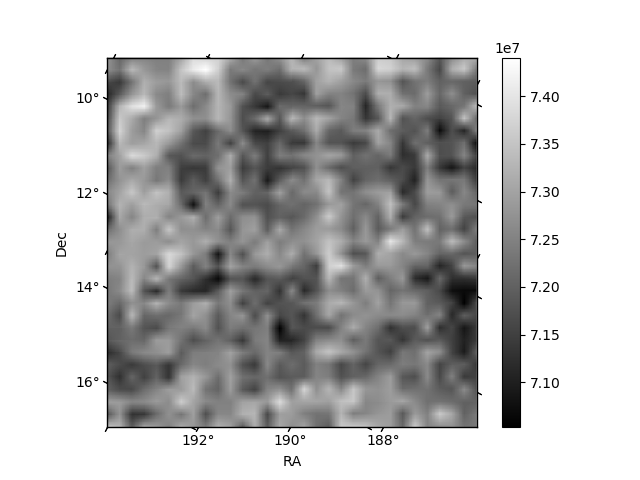
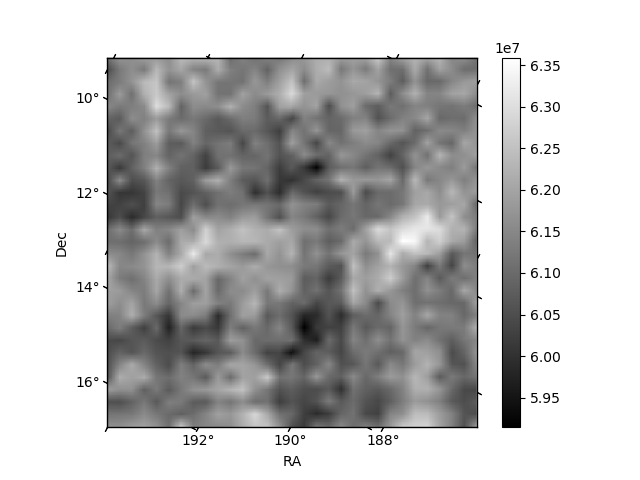
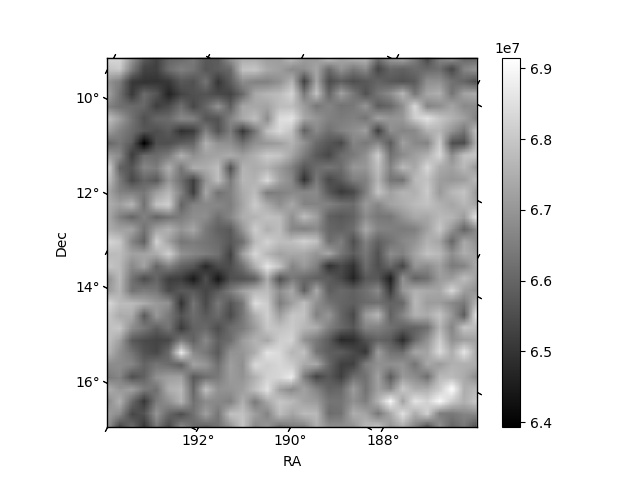
Histogram calculated using DETX and DETY for each event in the final _common_clean file
| Quadrant A | 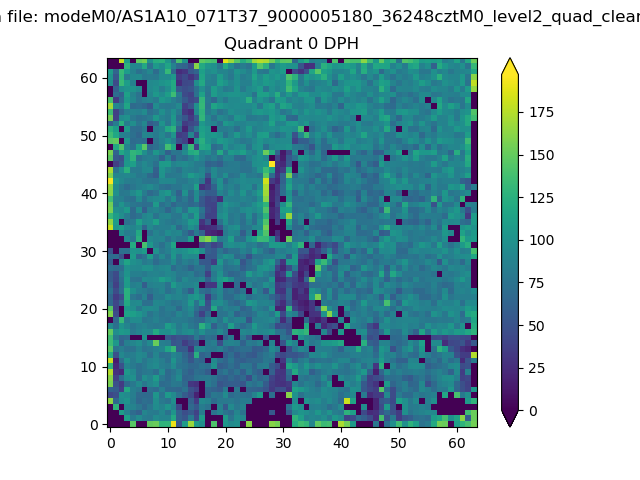 |
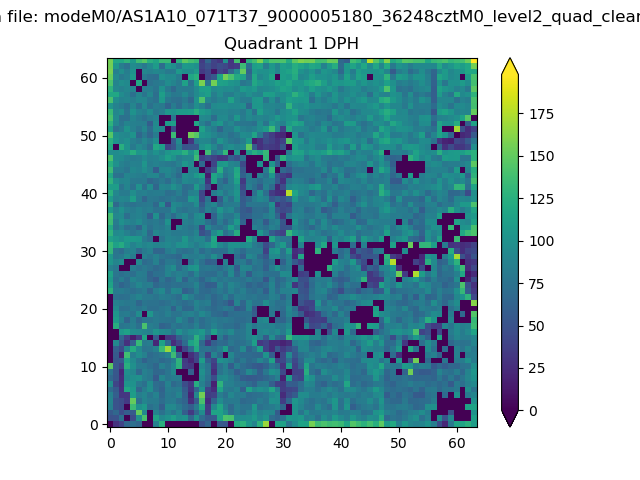 |
Quadrant B |
|---|---|---|---|
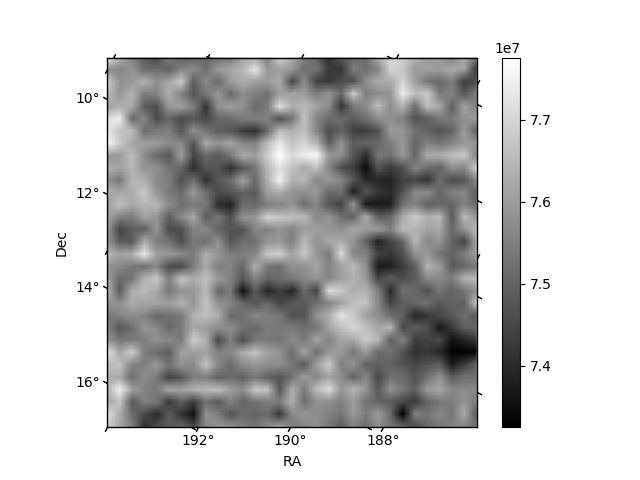
| Quadrant D | 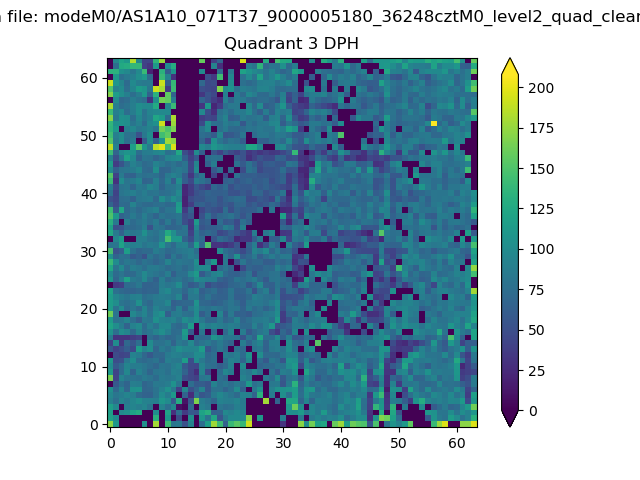 |
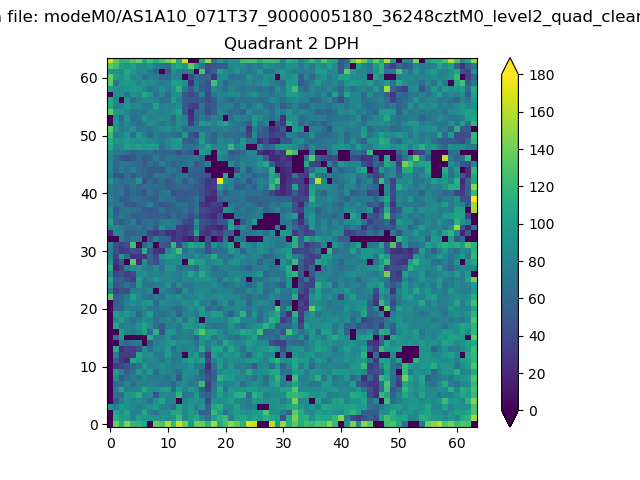 |
Quadrant C |
| Plot type | Count rate plots | Images |
|---|---|---|
| Comparison with Poisson distribution Blue bars denote a histogram of data divided into 1 sec bins. Red curve is a Poisson curve with rate = median count rate of data. |
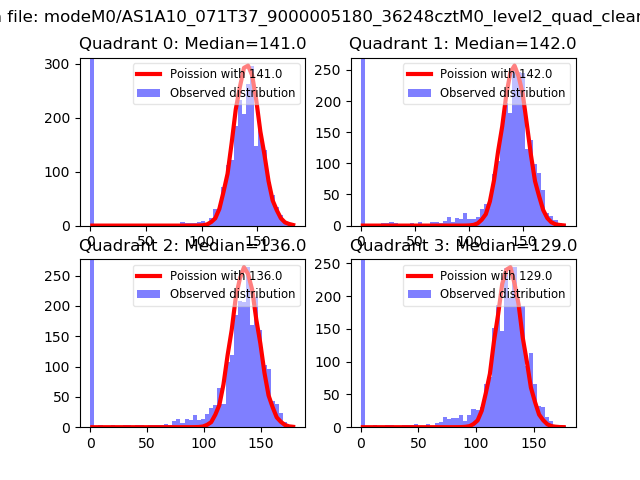 |
 |
| Quadrant-wise count rates Data is divided into 100 sec bins |
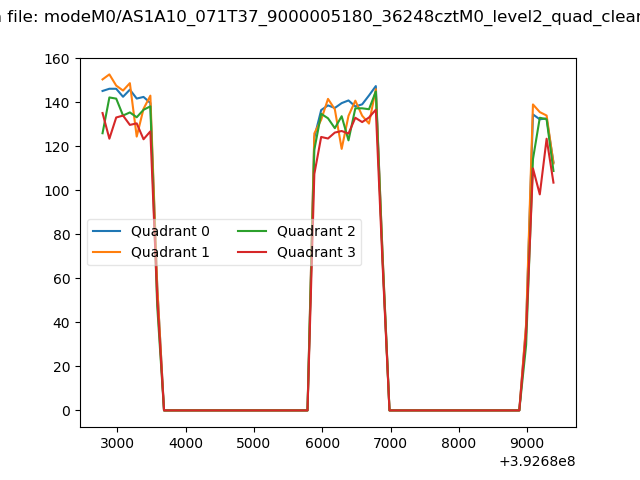 |
|
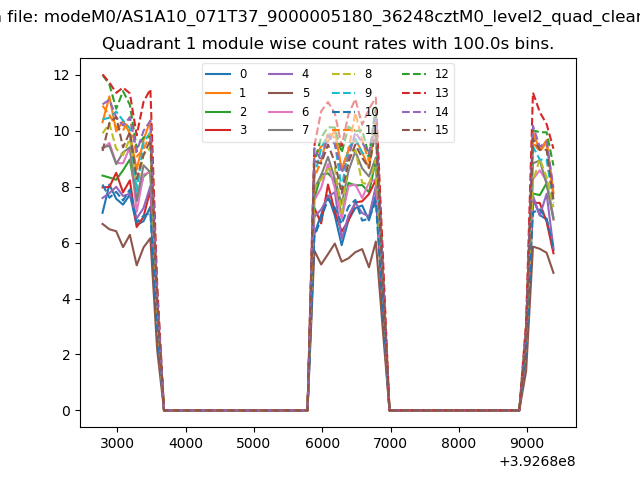
| Module-wise count rates for Quadrant A Data is divided into 100 sec bins |
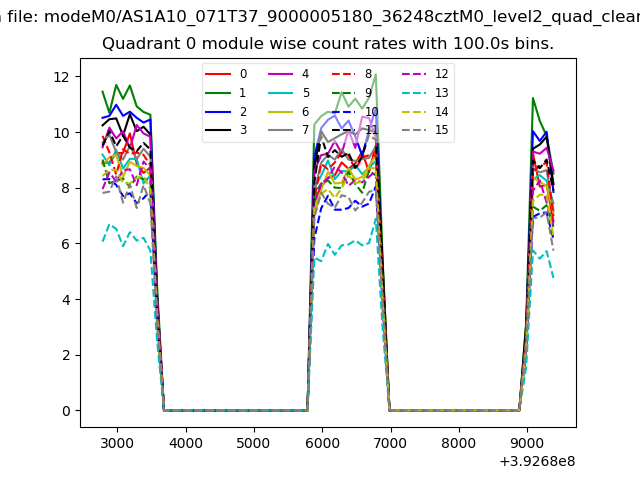 |
 |
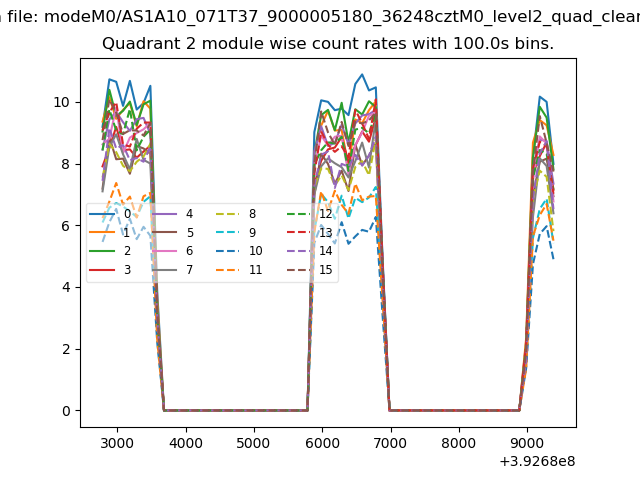
| Module-wise count rates for Quadrant B Data is divided into 100 sec bins |
 |
 |
| Module-wise count rates for Quadrant C Data is divided into 100 sec bins |
 |
 |
| Module-wise count rates for Quadrant D Data is divided into 100 sec bins |
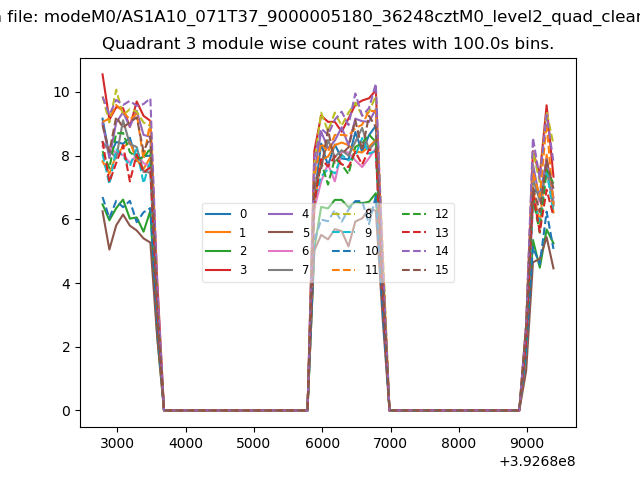 |
 |
| Parameter | Plot |
|---|---|
| CZT HV Monitor | 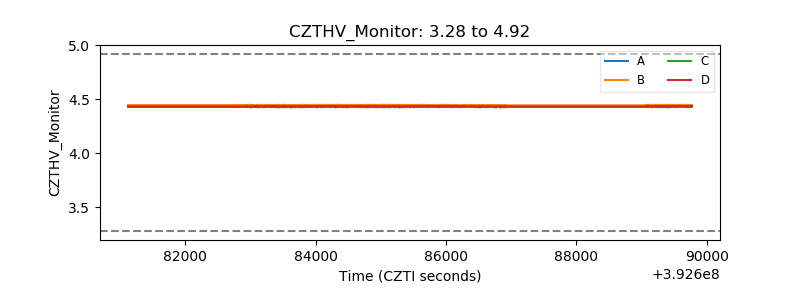 |
| D_VDD | 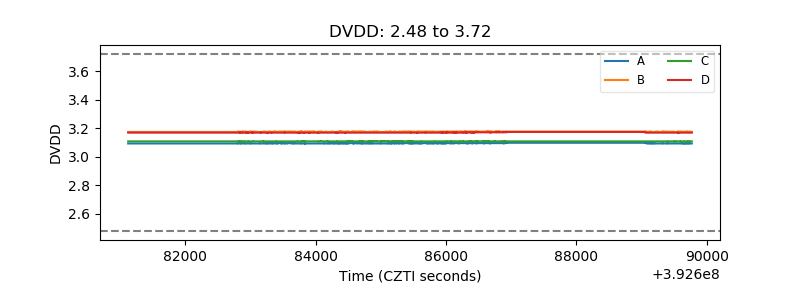 |
| Temperature 1 | 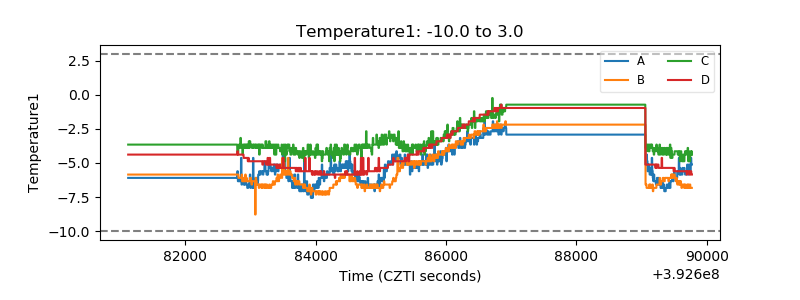 |
| Veto HV Monitor | 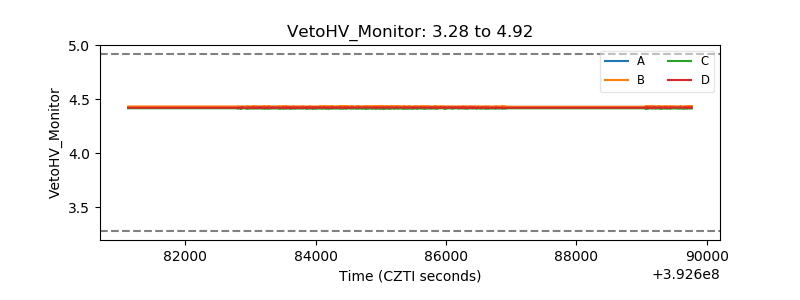 |
| Veto LLD | 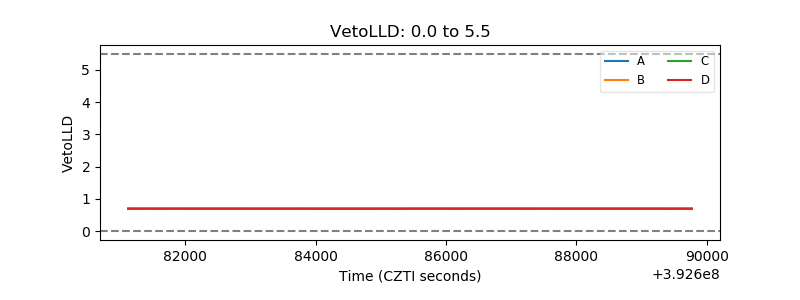 |
| Alpha Counter | 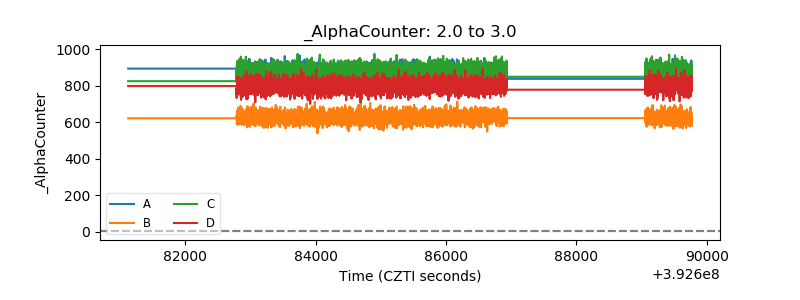 |
| _CPM_Rate | 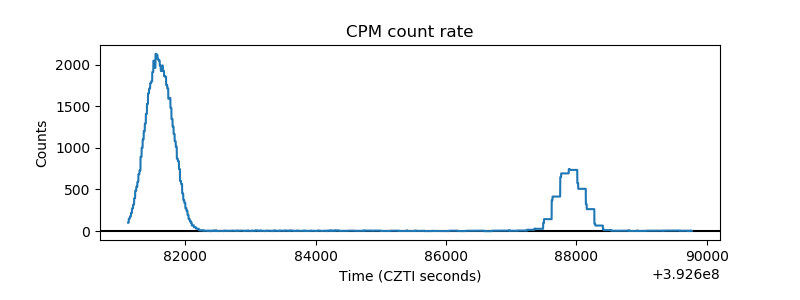 |
| CZT Counter | 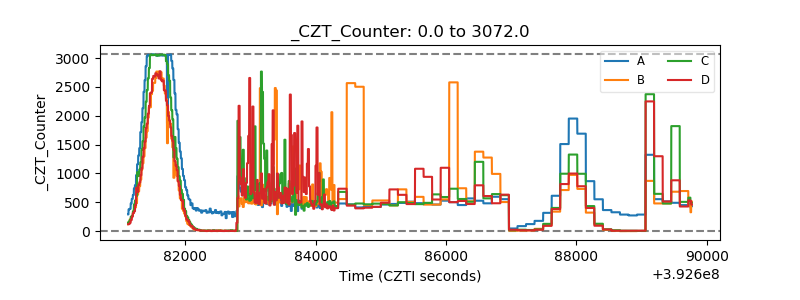 |
| +2.5 Volts monitor | 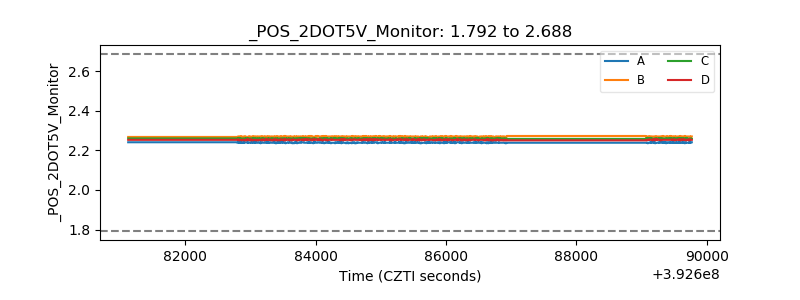 |
| +5 Volts monitor | 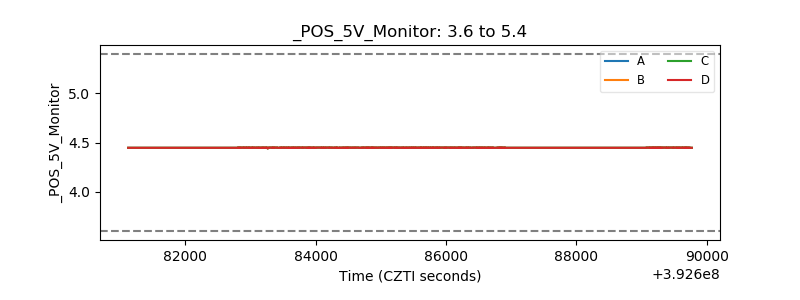 |
| _ROLL_ROT | 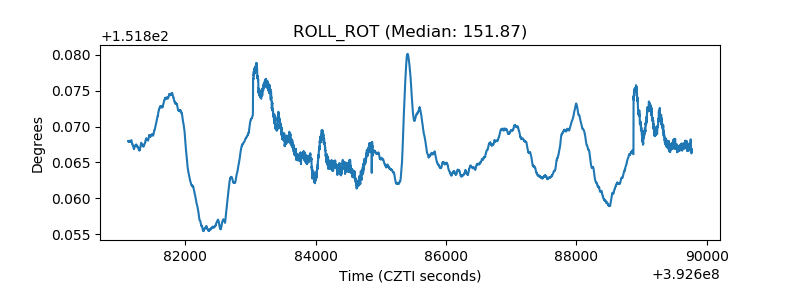 |
| _Roll_DEC | 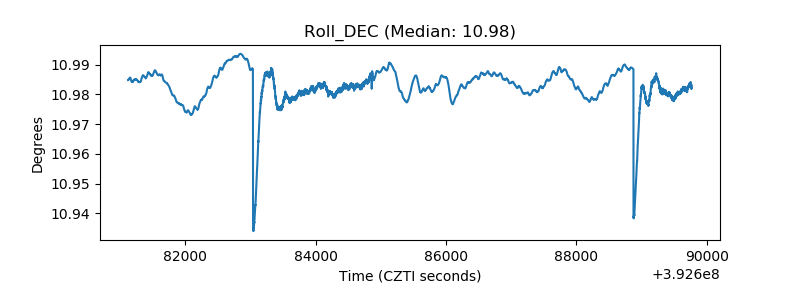 |
| _Roll_RA | 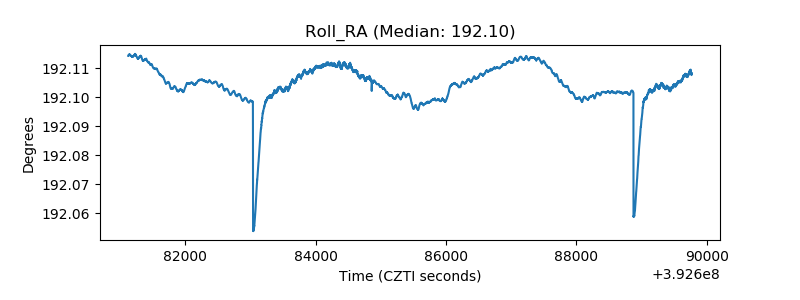 |
| Veto Counter | 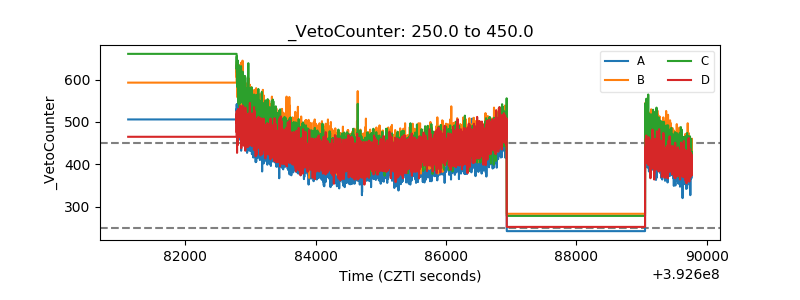 |