| Param | Original file | Final file |
|---|---|---|
| Filename | modeM0/AS1A10_071T37_9000005180_36247cztM0_level2.evt | modeM0/AS1A10_071T37_9000005180_36247cztM0_level2_quad_clean.evt |
| Size (bytes) | 432,722,880 | 62,000,640 |
| Size | 412.7 MB | 59.1 MB |
| Events in quadrant A | 2,559,670 | 393,591 |
| Events in quadrant B | 2,967,972 | 398,624 |
| Events in quadrant C | 3,441,631 | 380,812 |
| Events in quadrant D | 3,799,026 | 356,365 |
| Mode SS | |||
|---|---|---|---|
| Quadrant | BADHDUFLAG | Total packets | Discarded packets |
| A | 0 | 102 | 0 |
| B | 0 | 102 | 0 |
| C | 0 | 102 | 0 |
| D | 0 | 102 | 0 |
| Mode M9 | |||
|---|---|---|---|
| Quadrant | BADHDUFLAG | Total packets | Discarded packets |
| A | 0 | 36 | 0 |
| B | 0 | 36 | 0 |
| C | 0 | 36 | 0 |
| D | 0 | 37 | 0 |
| Mode M0 | |||
|---|---|---|---|
| Quadrant | BADHDUFLAG | Total packets | Discarded packets |
| A | 0 | 10516 | 3 |
| B | 0 | 11796 | 2 |
| C | 0 | 13202 | 2 |
| D | 0 | 14567 | 2 |
| Quadrant | Total seconds | Saturated seconds | Saturation percentage |
|---|---|---|---|
| A | 4956 | 5 | 0.100888% |
| B | 4956 | 114 | 2.300242% |
| C | 4956 | 187 | 3.773204% |
| D | 4956 | 262 | 5.286521% |
Noise dominated data is calculated using 1-second bins in cleaned event files. If a bin has >2000 counts, and if more than 50% of those come from <1% of pixels, then it is considered to be noise-dominated and hence unusable.
| Quadrant | # 1 sec bins | Bins with >0 counts | Bins with >2000 counts | High rate bins dominated by noise | Noise dominated (total time) | Noise dominated (detector-on time) | Marked lightcurve |
|---|---|---|---|---|---|---|---|
| A | 7079 | 4957 | 0 | 0 | 0.00% | 0.00% | 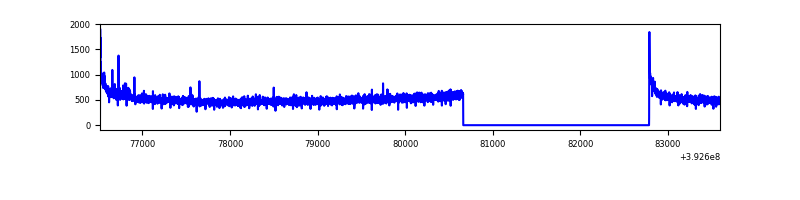 |
| B | 7079 | 4957 | 82 | 82 | 1.16% | 1.65% | 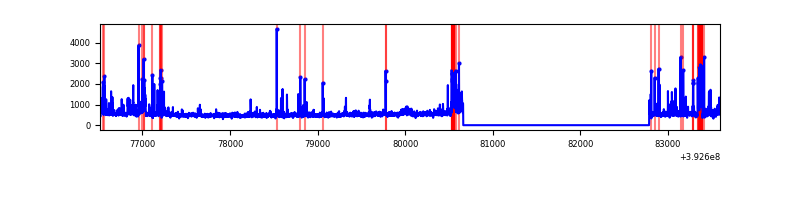 |
| C | 7078 | 4956 | 168 | 168 | 2.37% | 3.39% | 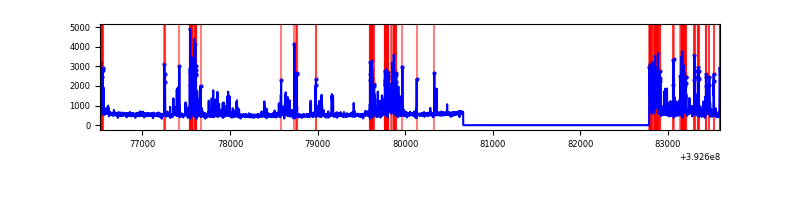 |
| D | 7079 | 4957 | 262 | 262 | 3.70% | 5.29% | 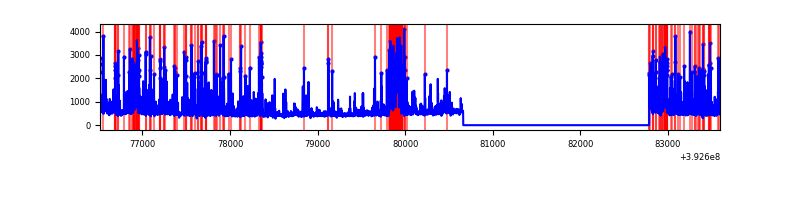 |
Top three noisy pixels from each quadrant. If the there are fewer than three noisy pixels in the level2.evt file, extra rows are filled as -1
| Pixel properties | Quadrant properties | ||||||
|---|---|---|---|---|---|---|---|
| Quadrant | DetID | PixID | Counts | Sigma | Mean | Median | Sigma |
| A | 10 | 83 | 168695 | 1365.39 | 612 | 602 | 123.1 |
| A | 13 | 6 | 11998 | 92.57 | 612 | 602 | 123.1 |
| A | 9 | 143 | 8653 | 65.4 | 612 | 602 | 123.1 |
| B | 5 | 172 | 305129 | 2642.48 | 609 | 595 | 115.2 |
| B | 5 | 236 | 183363 | 1585.9 | 609 | 595 | 115.2 |
| B | 0 | 189 | 26720 | 226.69 | 609 | 595 | 115.2 |
| C | 0 | 207 | 765004 | 5619.85 | 587 | 594 | 136.0 |
| C | 15 | 214 | 206975 | 1517.29 | 587 | 594 | 136.0 |
| C | 0 | 10 | 139358 | 1020.18 | 587 | 594 | 136.0 |
| D | 12 | 6 | 1171144 | 8244.22 | 575 | 556 | 142.0 |
| D | 13 | 171 | 165397 | 1160.94 | 575 | 556 | 142.0 |
| D | 13 | 249 | 62005 | 432.77 | 575 | 556 | 142.0 |
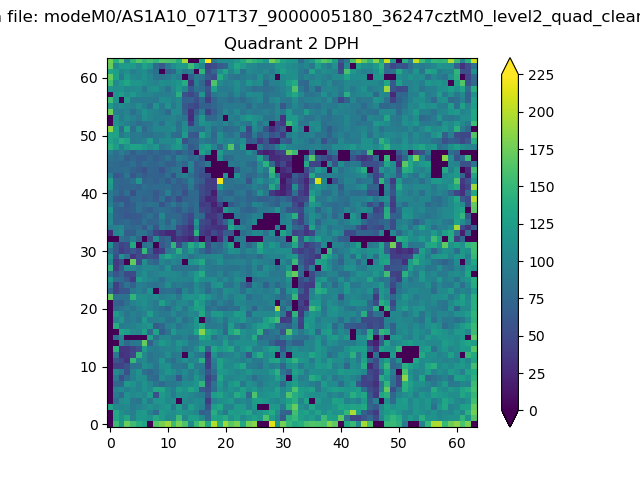
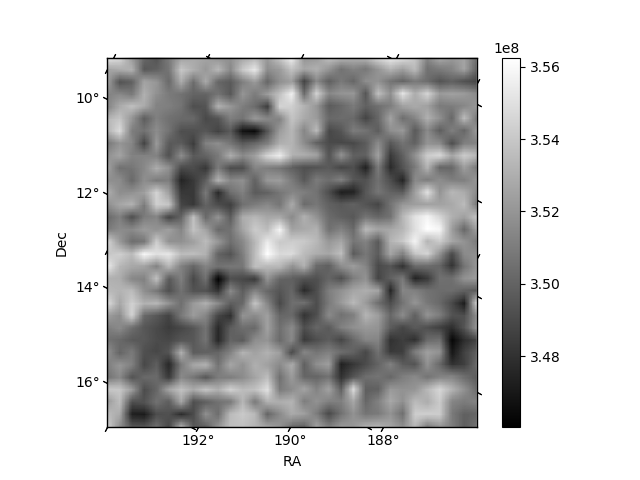
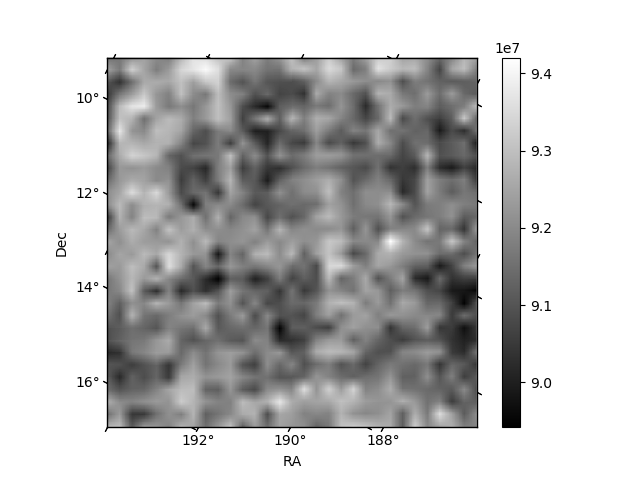
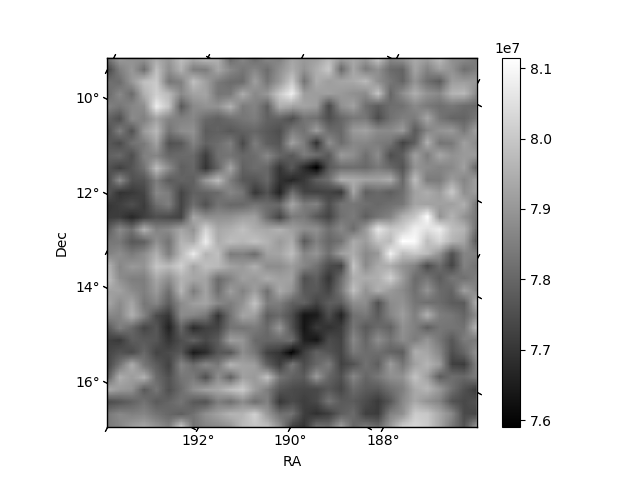
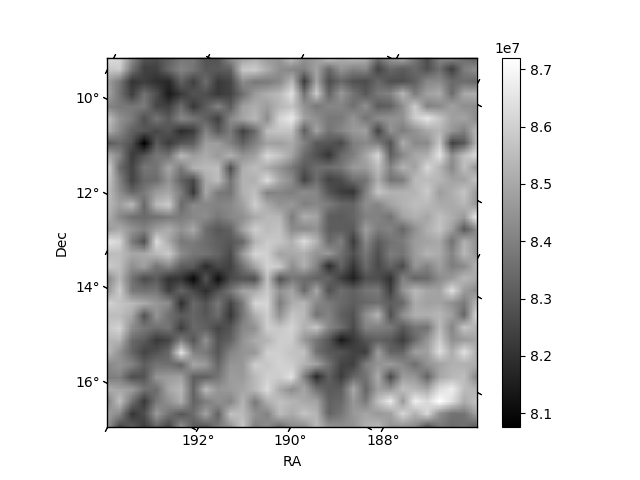
Histogram calculated using DETX and DETY for each event in the final _common_clean file
| Quadrant A | 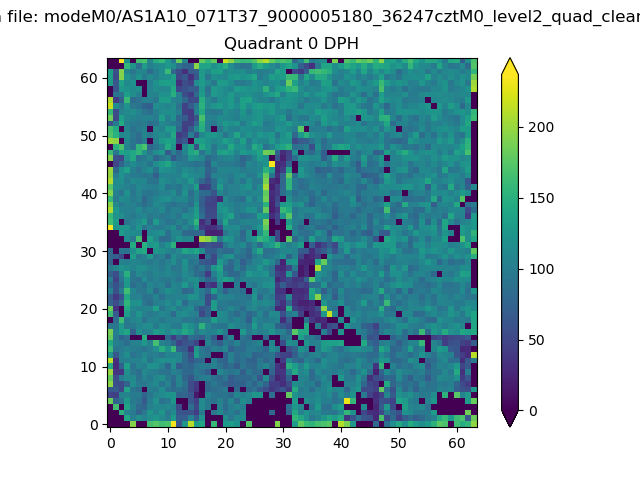 |
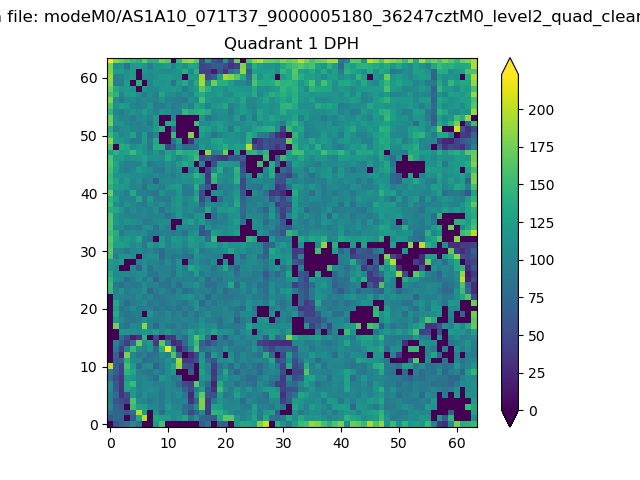 |
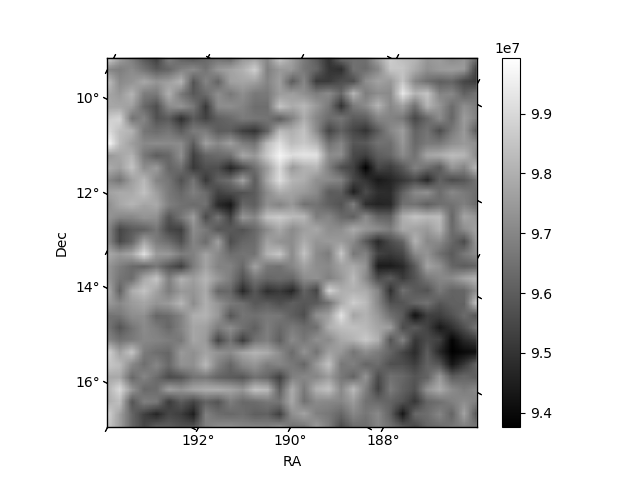
Quadrant B |
|---|---|---|---|
| Quadrant D | 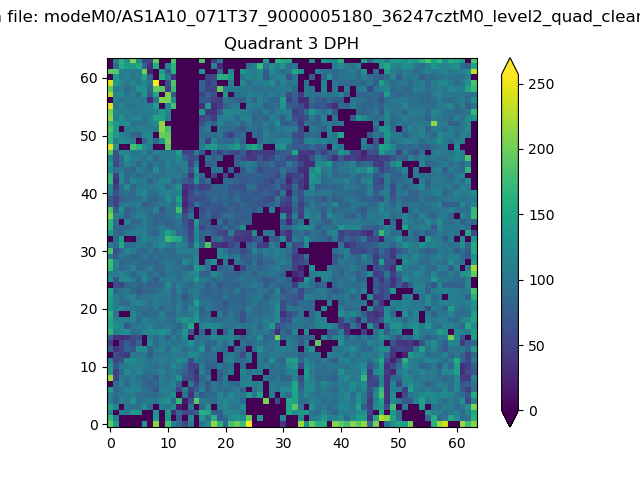 |
 |
Quadrant C |
| Plot type | Count rate plots | Images |
|---|---|---|
| Comparison with Poisson distribution Blue bars denote a histogram of data divided into 1 sec bins. Red curve is a Poisson curve with rate = median count rate of data. |
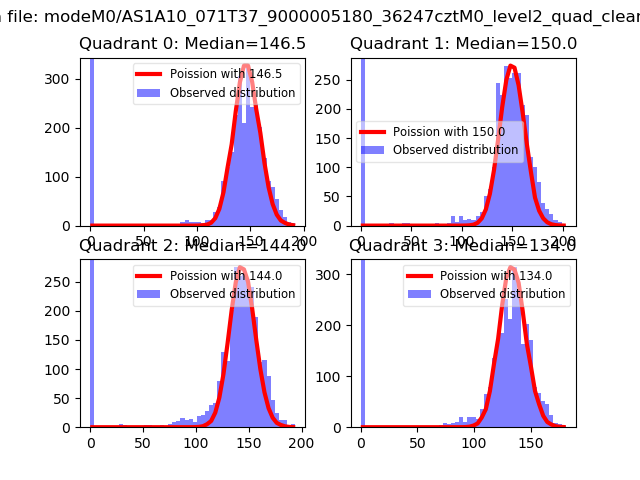 |
 |
| Quadrant-wise count rates Data is divided into 100 sec bins |
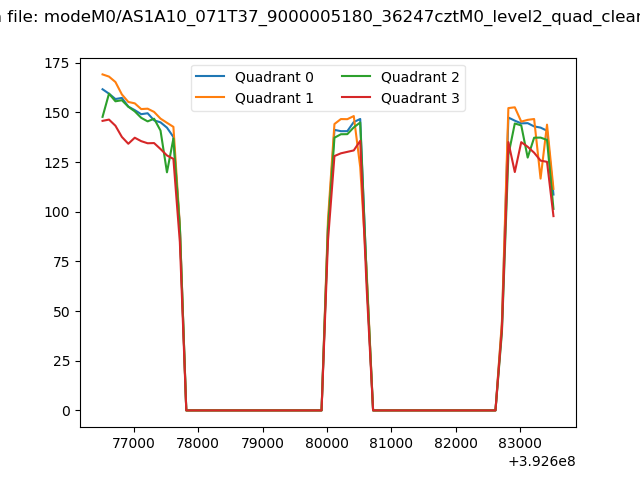 |
|
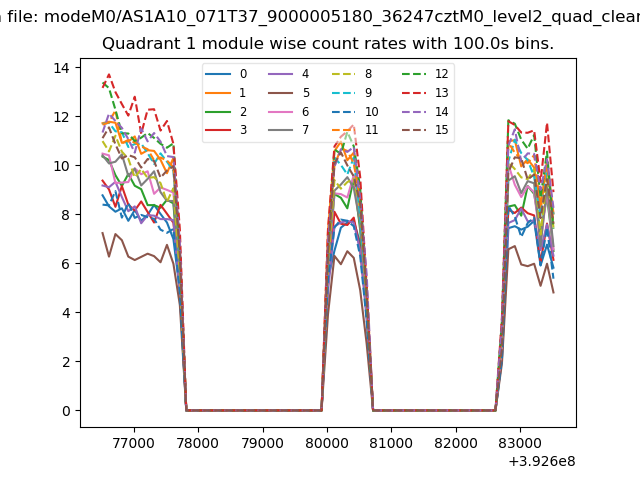
| Module-wise count rates for Quadrant A Data is divided into 100 sec bins |
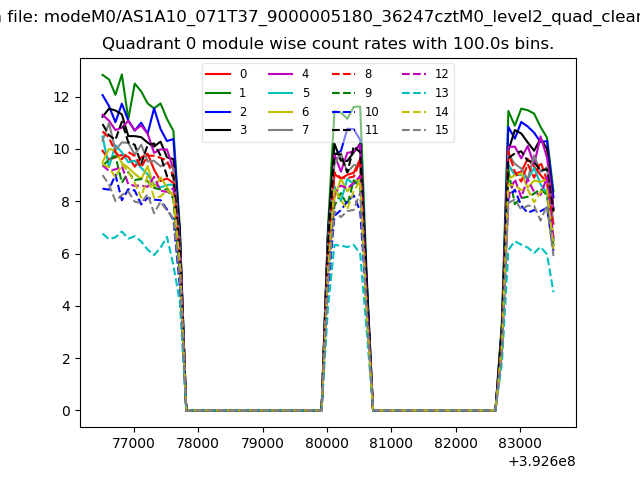 |
 |
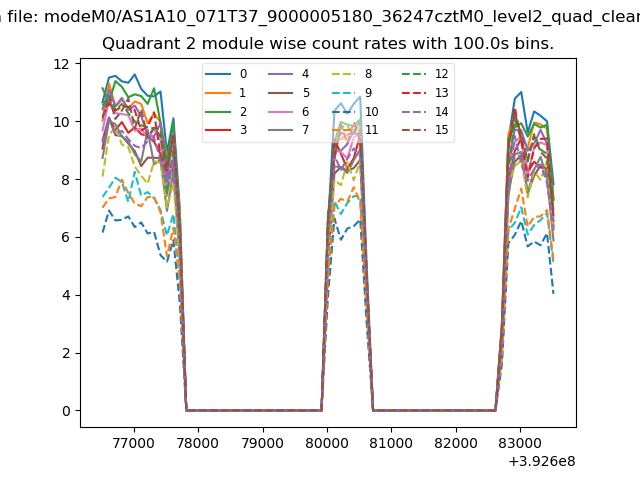
| Module-wise count rates for Quadrant B Data is divided into 100 sec bins |
 |
 |
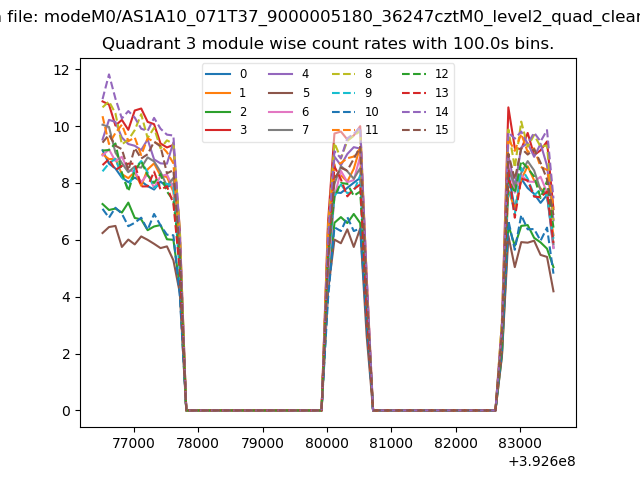
| Module-wise count rates for Quadrant C Data is divided into 100 sec bins |
 |
 |
| Module-wise count rates for Quadrant D Data is divided into 100 sec bins |
 |
 |
| Parameter | Plot |
|---|---|
| CZT HV Monitor | 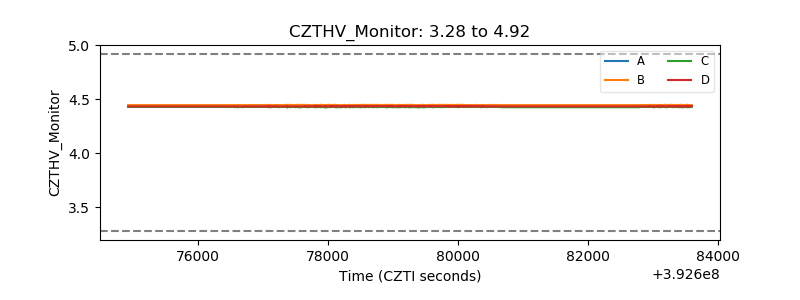 |
| D_VDD | 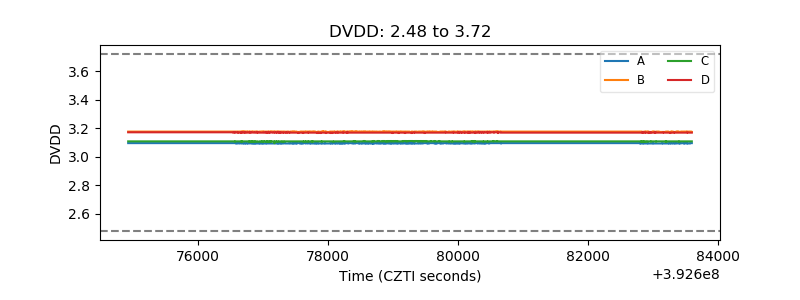 |
| Temperature 1 | 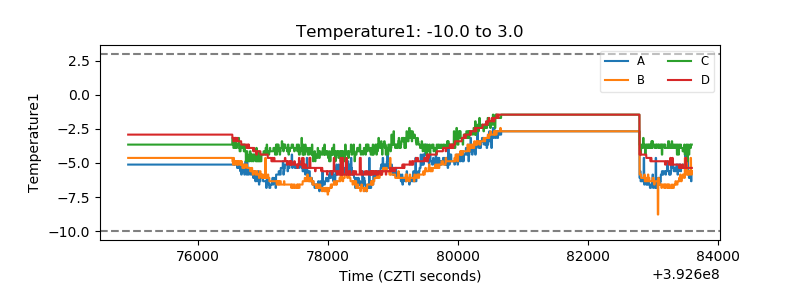 |
| Veto HV Monitor | 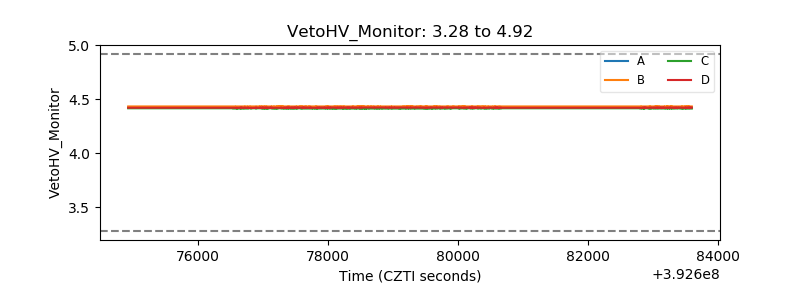 |
| Veto LLD | 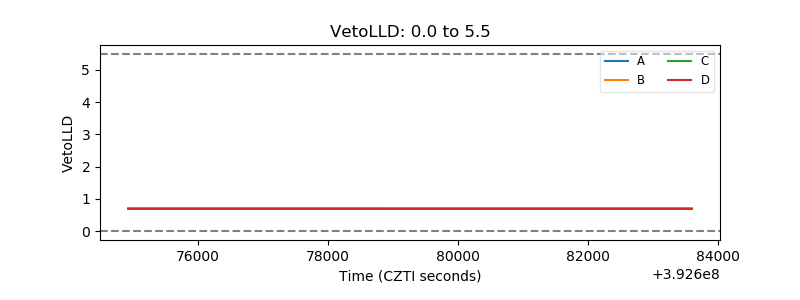 |
| Alpha Counter | 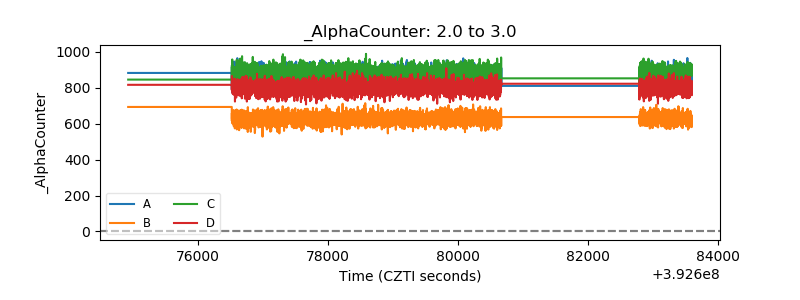 |
| _CPM_Rate | 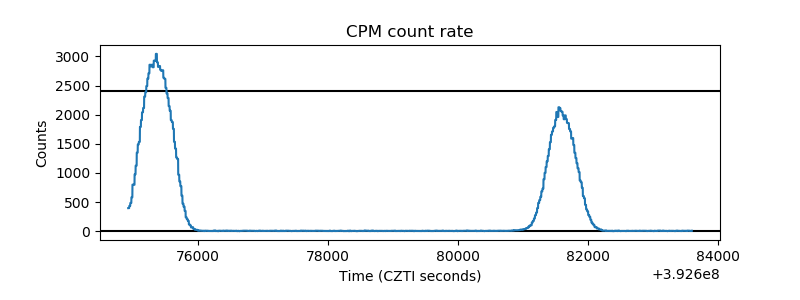 |
| CZT Counter | 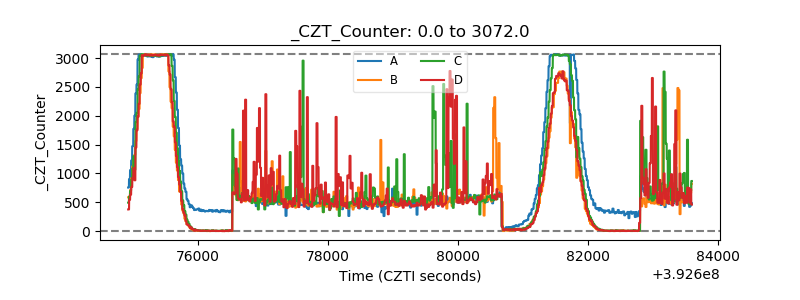 |
| +2.5 Volts monitor | 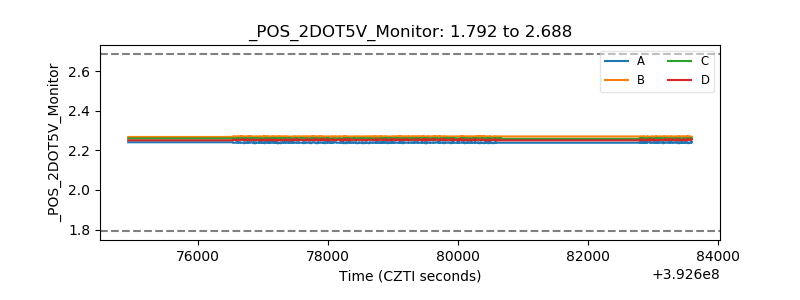 |
| +5 Volts monitor | 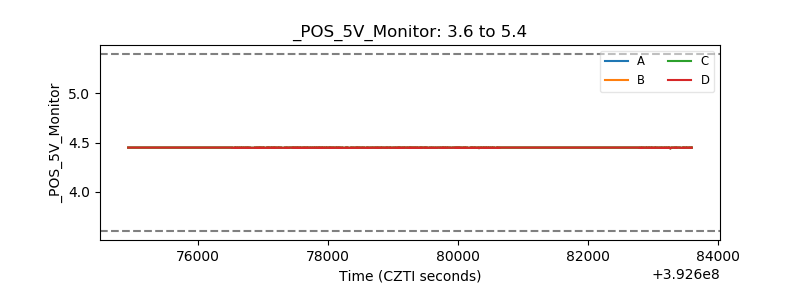 |
| _ROLL_ROT | 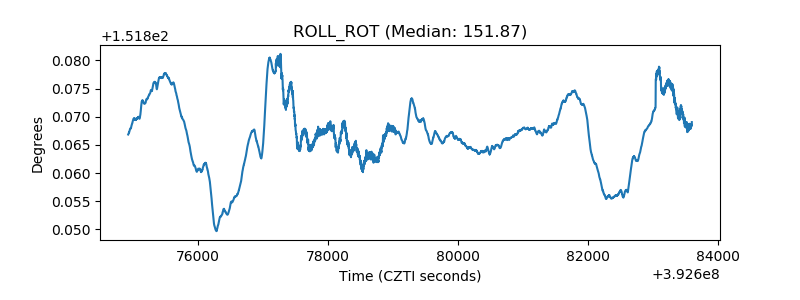 |
| _Roll_DEC | 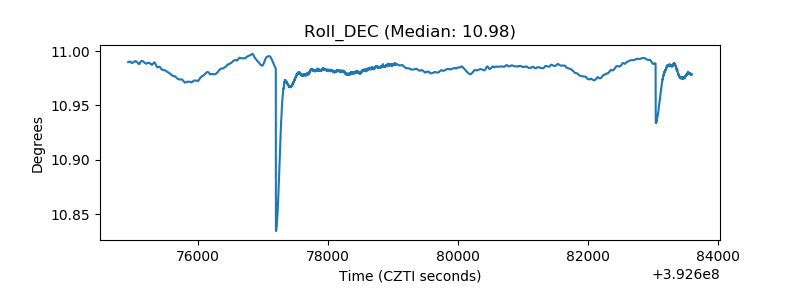 |
| _Roll_RA | 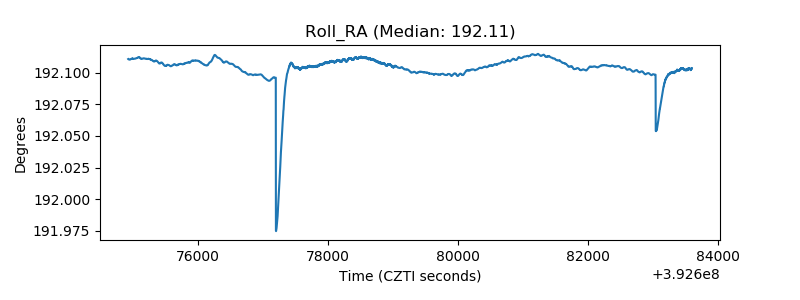 |
| Veto Counter | 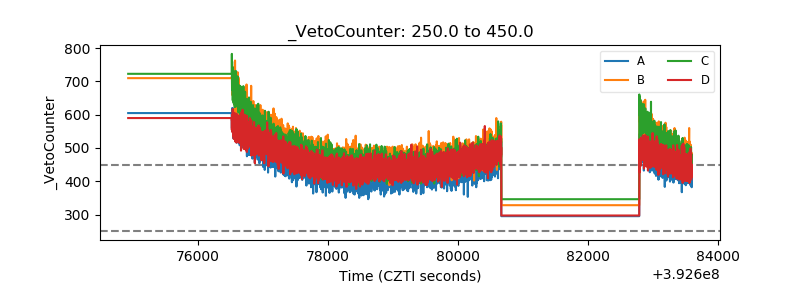 |