| Param | Original file | Final file |
|---|---|---|
| Filename | modeM0/AS1A10_071T34_9000005178_36246cztM0_level2.evt | modeM0/AS1A10_071T34_9000005178_36246cztM0_level2_quad_clean.evt |
| Size (bytes) | 111,456,000 | 25,217,280 |
| Size | 106.3 MB | 24.0 MB |
| Events in quadrant A | 634,410 | 175,480 |
| Events in quadrant B | 992,419 | 169,963 |
| Events in quadrant C | 779,457 | 171,141 |
| Events in quadrant D | 889,512 | 160,754 |
| Mode SS | |||
|---|---|---|---|
| Quadrant | BADHDUFLAG | Total packets | Discarded packets |
| A | 0 | 22 | 0 |
| B | 0 | 22 | 0 |
| C | 0 | 22 | 0 |
| D | 0 | 22 | 0 |
| Mode M9 | |||
|---|---|---|---|
| Quadrant | BADHDUFLAG | Total packets | Discarded packets |
| A | 0 | 15 | 0 |
| B | 0 | 15 | 0 |
| C | 0 | 15 | 0 |
| D | 0 | 16 | 0 |
| Mode M0 | |||
|---|---|---|---|
| Quadrant | BADHDUFLAG | Total packets | Discarded packets |
| A | 0 | 2563 | 1 |
| B | 0 | 3692 | 1 |
| C | 0 | 2960 | 1 |
| D | 0 | 3406 | 1 |
| Quadrant | Total seconds | Saturated seconds | Saturation percentage |
|---|---|---|---|
| A | 1133 | 3 | 0.264784% |
| B | 1133 | 132 | 11.650485% |
| C | 1133 | 46 | 4.060018% |
| D | 1133 | 42 | 3.706973% |
Noise dominated data is calculated using 1-second bins in cleaned event files. If a bin has >2000 counts, and if more than 50% of those come from <1% of pixels, then it is considered to be noise-dominated and hence unusable.
| Quadrant | # 1 sec bins | Bins with >0 counts | Bins with >2000 counts | High rate bins dominated by noise | Noise dominated (total time) | Noise dominated (detector-on time) | Marked lightcurve |
|---|---|---|---|---|---|---|---|
| A | 1133 | 1133 | 1 | 1 | 0.09% | 0.09% | 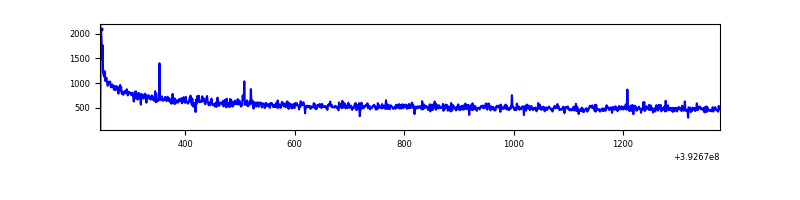 |
| B | 1133 | 1133 | 94 | 94 | 8.30% | 8.30% | 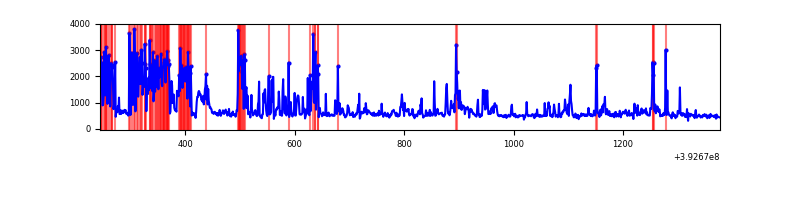 |
| C | 1133 | 1133 | 45 | 45 | 3.97% | 3.97% | 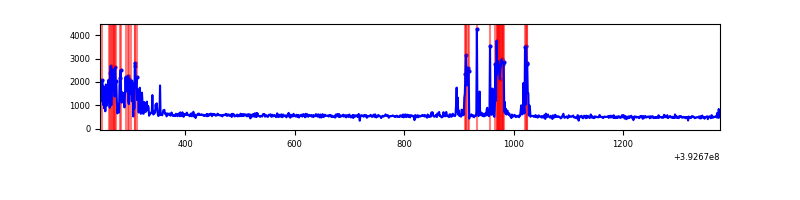 |
| D | 1133 | 1133 | 44 | 44 | 3.88% | 3.88% | 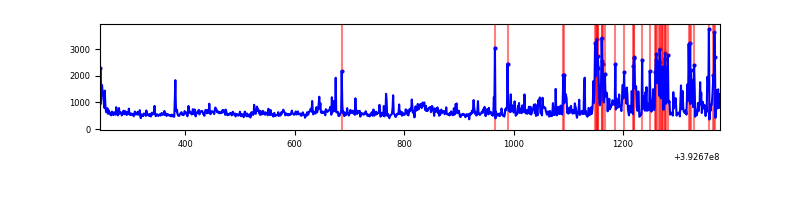 |
Top three noisy pixels from each quadrant. If the there are fewer than three noisy pixels in the level2.evt file, extra rows are filled as -1
| Pixel properties | Quadrant properties | ||||||
|---|---|---|---|---|---|---|---|
| Quadrant | DetID | PixID | Counts | Sigma | Mean | Median | Sigma |
| A | 10 | 83 | 68365 | 2234.1 | 144 | 142 | 30.5 |
| A | 9 | 143 | 5341 | 170.25 | 144 | 142 | 30.5 |
| A | 10 | 67 | 2234 | 68.51 | 144 | 142 | 30.5 |
| B | 5 | 236 | 348821 | 12464.16 | 138 | 135 | 28.0 |
| B | 5 | 172 | 53635 | 1912.42 | 138 | 135 | 28.0 |
| B | 0 | 190 | 16426 | 582.34 | 138 | 135 | 28.0 |
| C | 0 | 207 | 95979 | 2848.04 | 139 | 140 | 33.7 |
| C | 0 | 10 | 88705 | 2631.88 | 139 | 140 | 33.7 |
| C | 15 | 214 | 50170 | 1486.74 | 139 | 140 | 33.7 |
| D | 12 | 6 | 189932 | 5491.91 | 138 | 135 | 34.6 |
| D | 12 | 235 | 94397 | 2727.54 | 138 | 135 | 34.6 |
| D | 2 | 153 | 18229 | 523.56 | 138 | 135 | 34.6 |
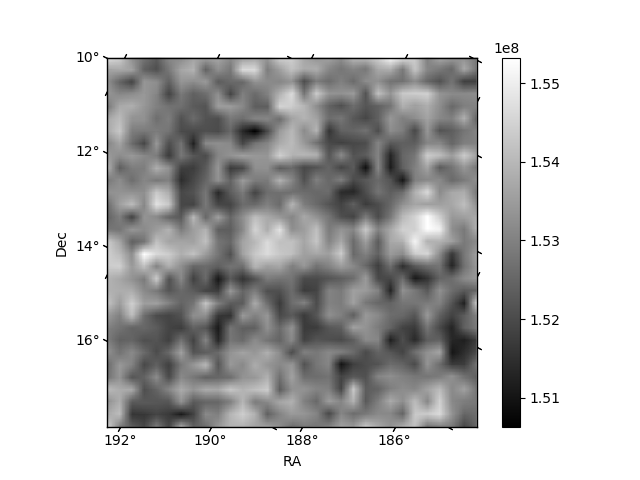
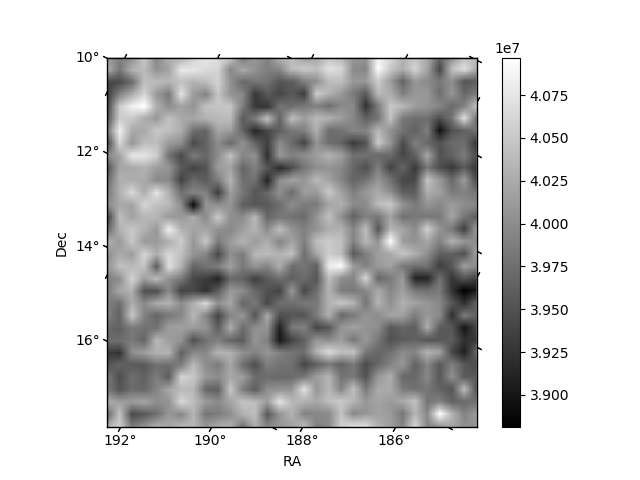
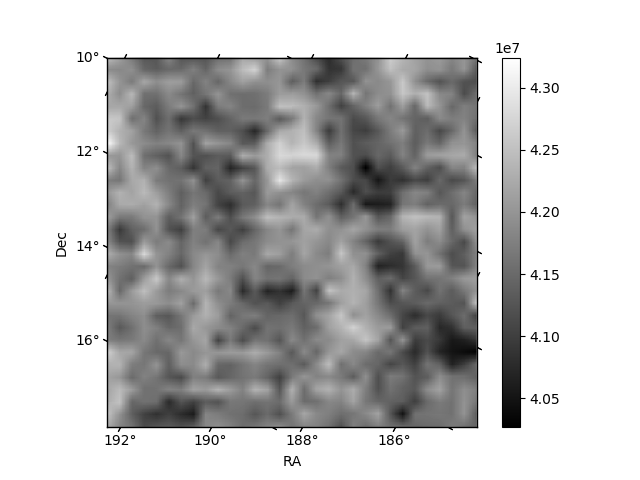
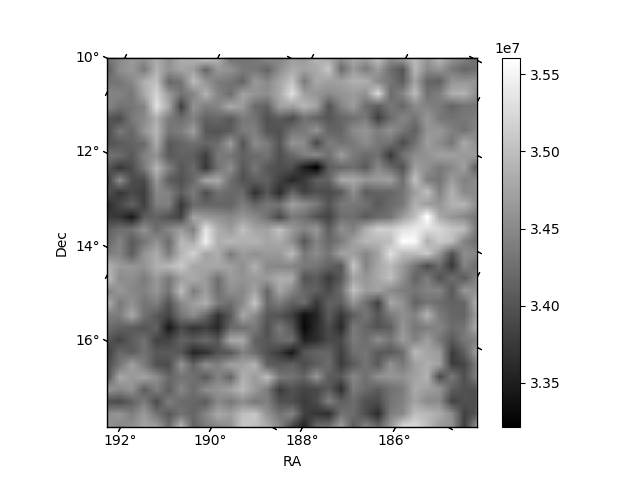
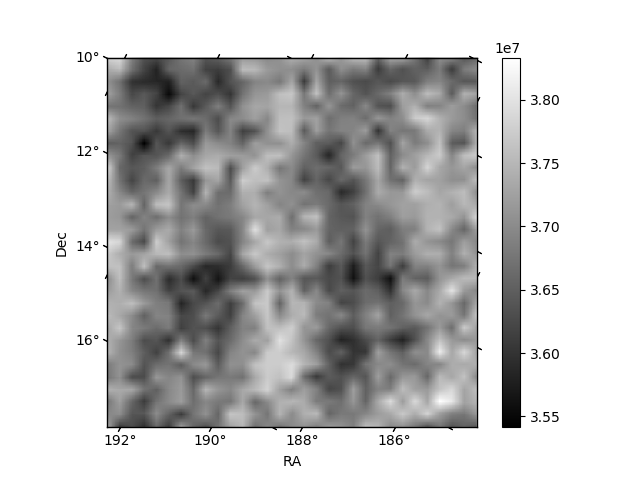
Histogram calculated using DETX and DETY for each event in the final _common_clean file
| Quadrant A | 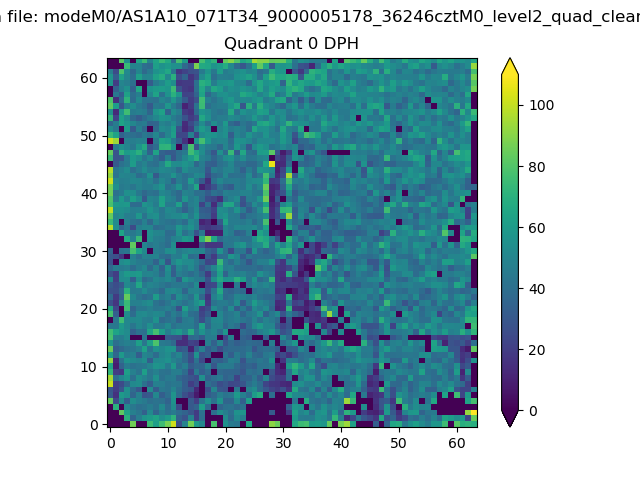 |
 |
Quadrant B |
|---|---|---|---|
| Quadrant D | 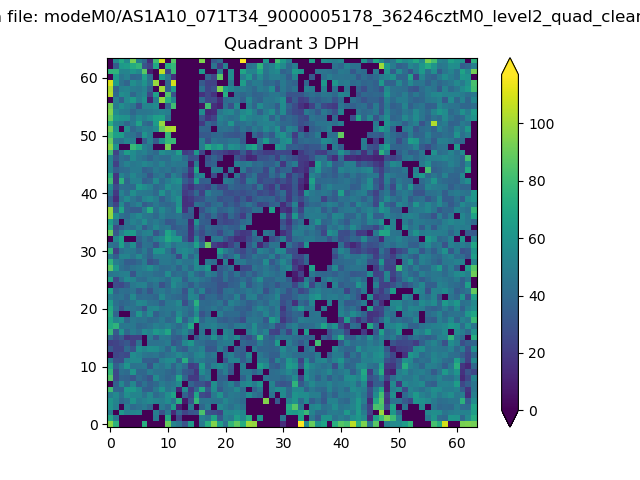 |
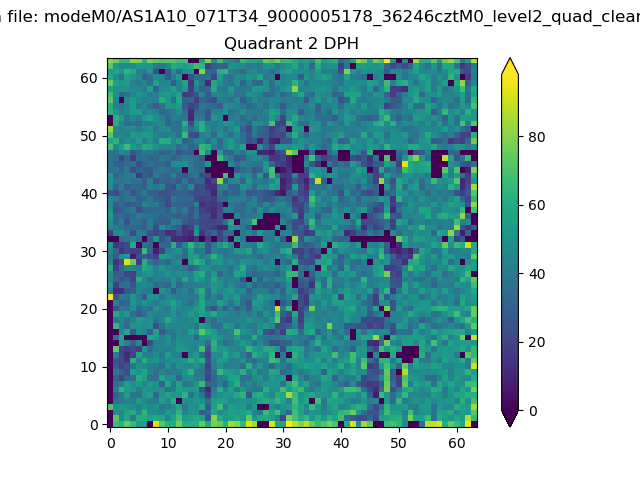 |
Quadrant C |
| Plot type | Count rate plots | Images |
|---|---|---|
| Comparison with Poisson distribution Blue bars denote a histogram of data divided into 1 sec bins. Red curve is a Poisson curve with rate = median count rate of data. |
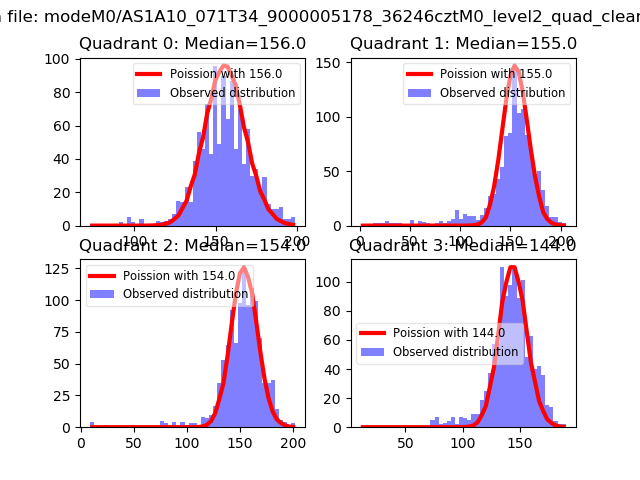 |
 |
| Quadrant-wise count rates Data is divided into 100 sec bins |
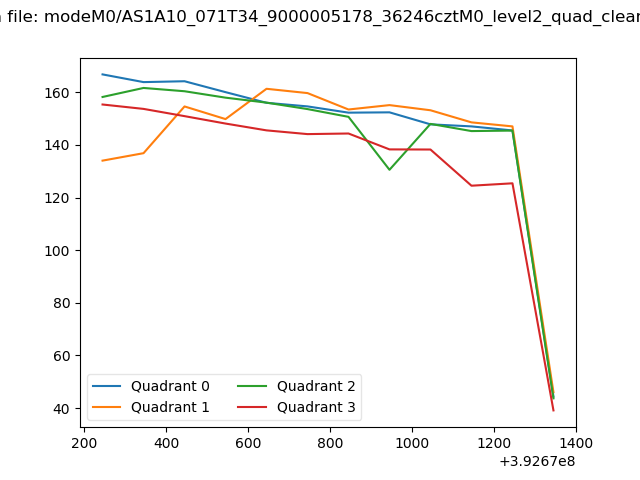 |
|
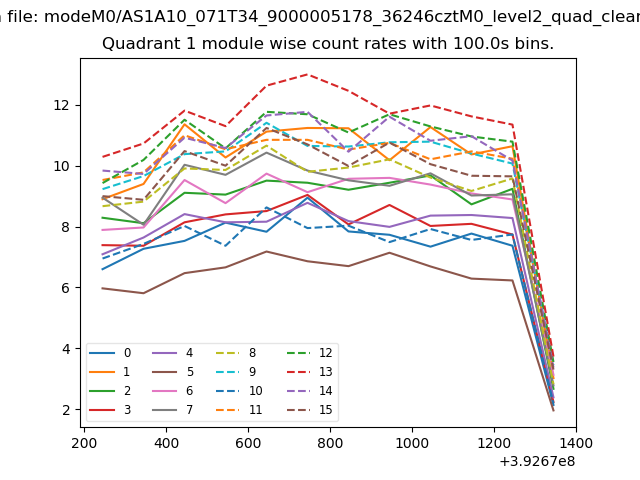
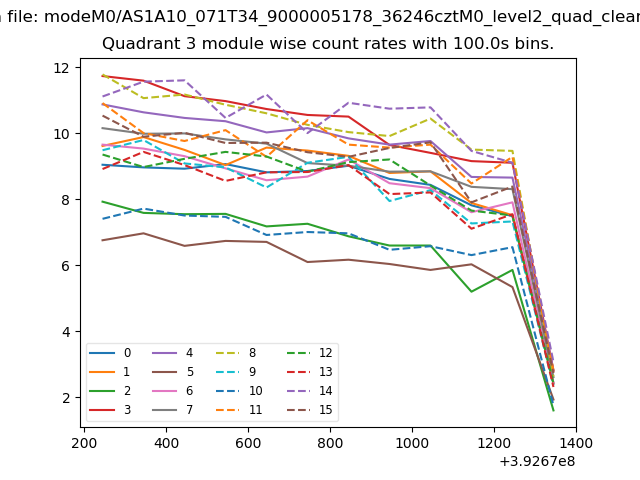
| Module-wise count rates for Quadrant A Data is divided into 100 sec bins |
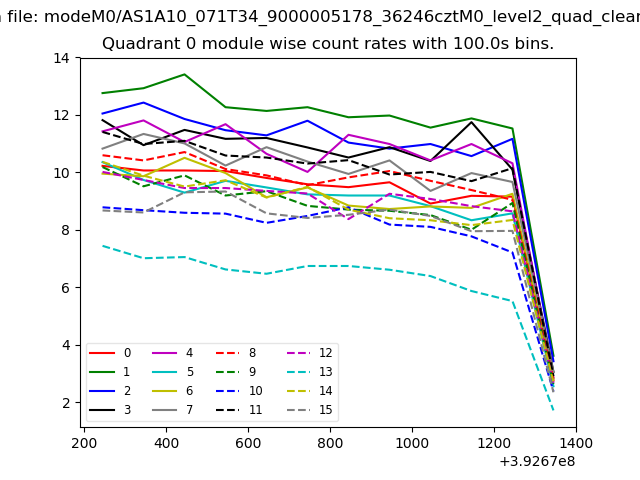 |
 |
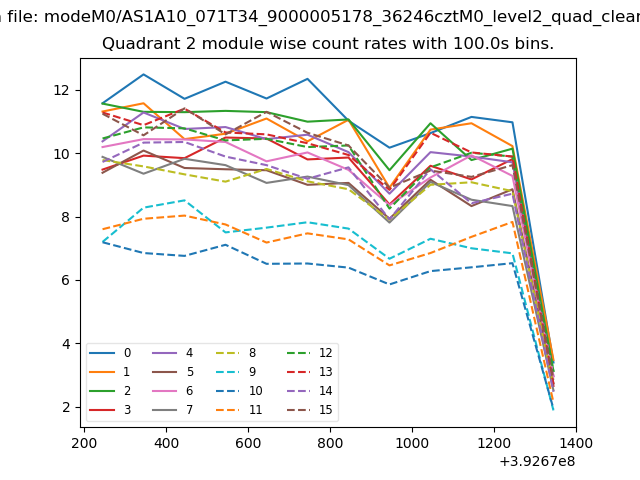
| Module-wise count rates for Quadrant B Data is divided into 100 sec bins |
 |
 |
| Module-wise count rates for Quadrant C Data is divided into 100 sec bins |
 |
 |
| Module-wise count rates for Quadrant D Data is divided into 100 sec bins |
 |
 |
| Parameter | Plot |
|---|---|
| CZT HV Monitor | 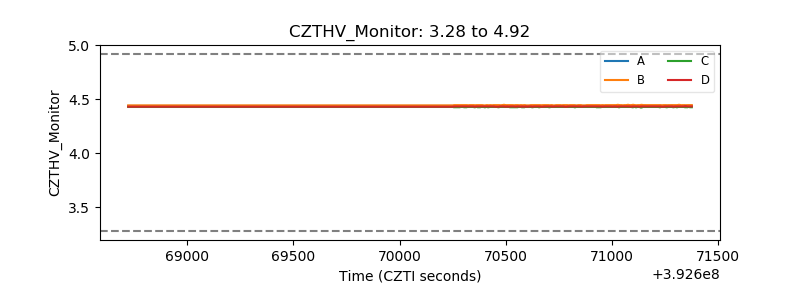 |
| D_VDD | 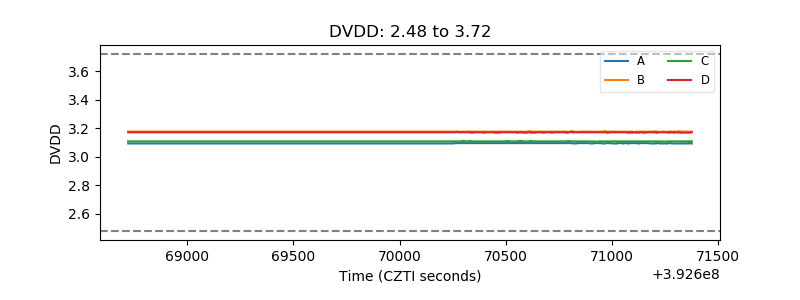 |
| Temperature 1 | 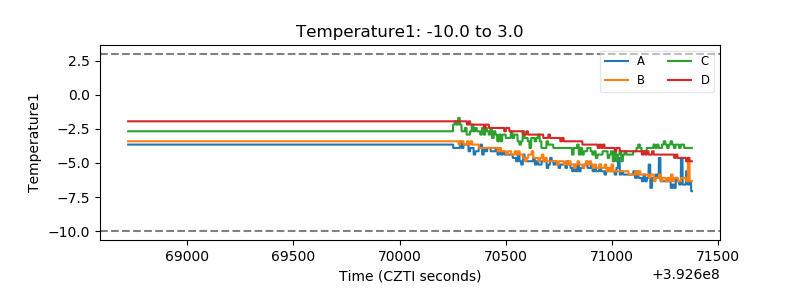 |
| Veto HV Monitor | 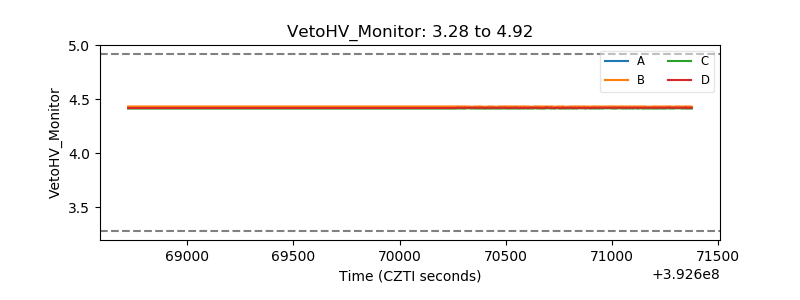 |
| Veto LLD | 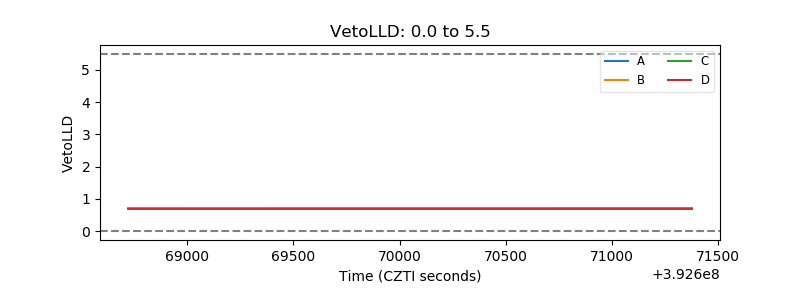 |
| Alpha Counter | 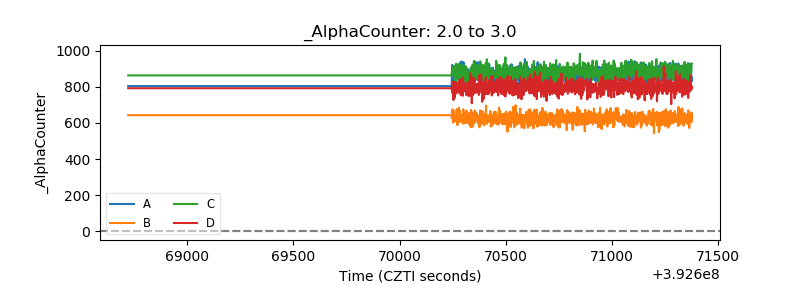 |
| _CPM_Rate | 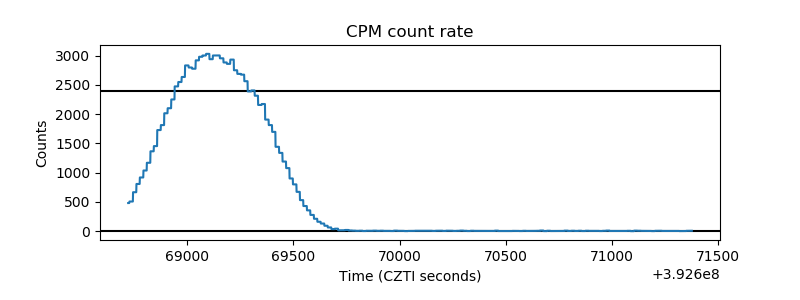 |
| CZT Counter | 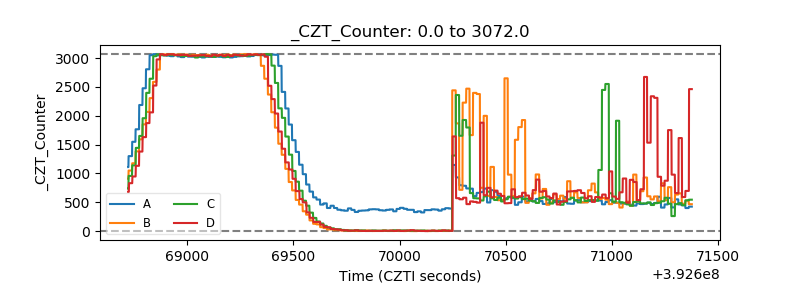 |
| +2.5 Volts monitor | 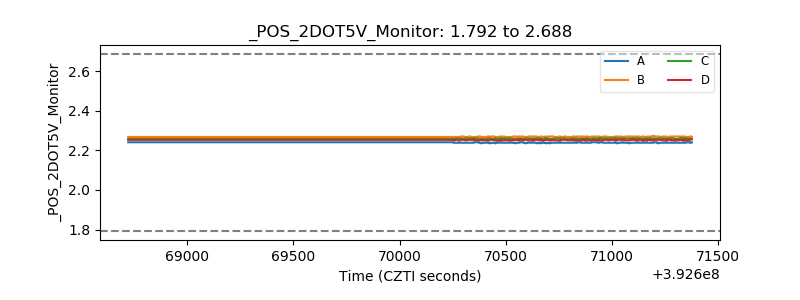 |
| +5 Volts monitor | 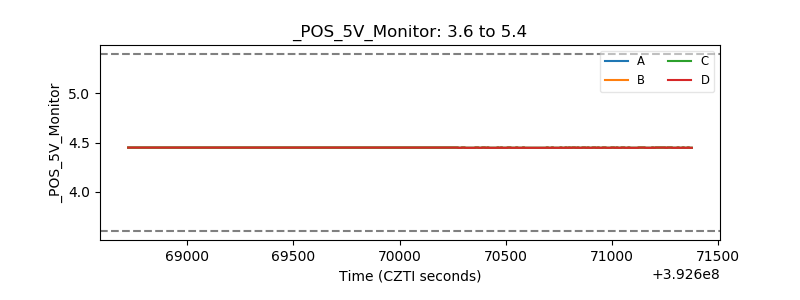 |
| _ROLL_ROT |  |
| _Roll_DEC | 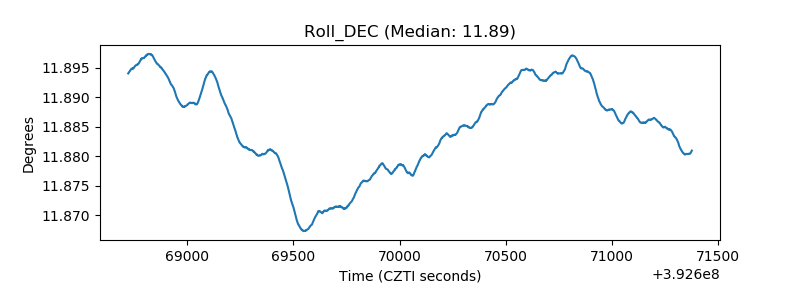 |
| _Roll_RA | 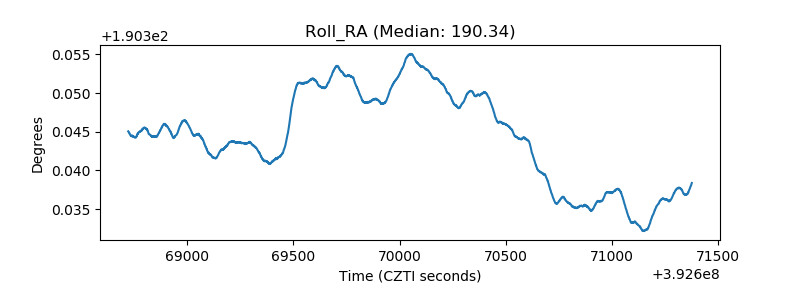 |
| Veto Counter | 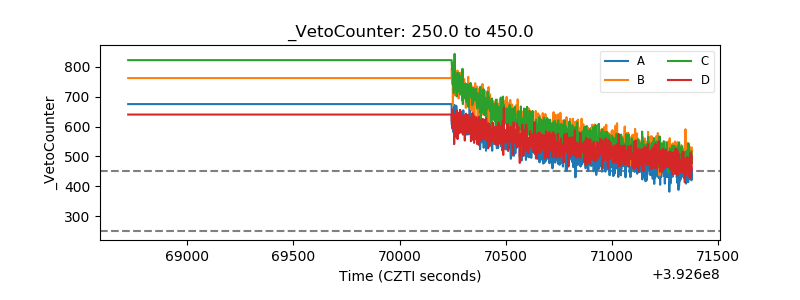 |