| Param | Original file | Final file |
|---|---|---|
| Filename | modeM0/AS1A10_071T34_9000005178_36244cztM0_level2.evt | modeM0/AS1A10_071T34_9000005178_36244cztM0_level2_quad_clean.evt |
| Size (bytes) | 458,925,120 | 73,163,520 |
| Size | 437.7 MB | 69.8 MB |
| Events in quadrant A | 2,665,244 | 475,542 |
| Events in quadrant B | 3,468,577 | 474,150 |
| Events in quadrant C | 2,858,621 | 469,515 |
| Events in quadrant D | 4,543,994 | 422,787 |
| Mode SS | |||
|---|---|---|---|
| Quadrant | BADHDUFLAG | Total packets | Discarded packets |
| A | 0 | 110 | 0 |
| B | 0 | 110 | 0 |
| C | 0 | 110 | 0 |
| D | 0 | 110 | 0 |
| Mode M9 | |||
|---|---|---|---|
| Quadrant | BADHDUFLAG | Total packets | Discarded packets |
| A | 0 | 22 | 0 |
| B | 0 | 22 | 0 |
| C | 0 | 22 | 0 |
| D | 0 | 23 | 0 |
| Mode M0 | |||
|---|---|---|---|
| Quadrant | BADHDUFLAG | Total packets | Discarded packets |
| A | 0 | 11327 | 3 |
| B | 0 | 13759 | 2 |
| C | 0 | 11660 | 2 |
| D | 0 | 17037 | 2 |
| Quadrant | Total seconds | Saturated seconds | Saturation percentage |
|---|---|---|---|
| A | 5326 | 9 | 0.168982% |
| B | 5326 | 207 | 3.886594% |
| C | 5326 | 43 | 0.807360% |
| D | 5326 | 547 | 10.270372% |
Noise dominated data is calculated using 1-second bins in cleaned event files. If a bin has >2000 counts, and if more than 50% of those come from <1% of pixels, then it is considered to be noise-dominated and hence unusable.
| Quadrant | # 1 sec bins | Bins with >0 counts | Bins with >2000 counts | High rate bins dominated by noise | Noise dominated (total time) | Noise dominated (detector-on time) | Marked lightcurve |
|---|---|---|---|---|---|---|---|
| A | 7179 | 5327 | 1 | 1 | 0.01% | 0.02% | 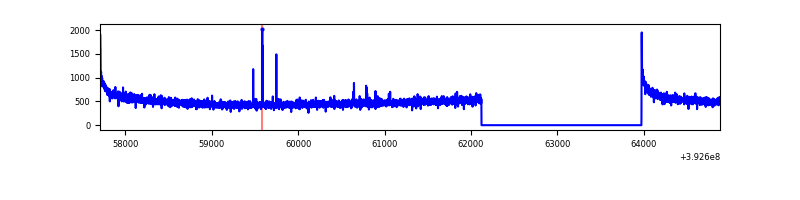 |
| B | 7179 | 5327 | 144 | 144 | 2.01% | 2.70% | 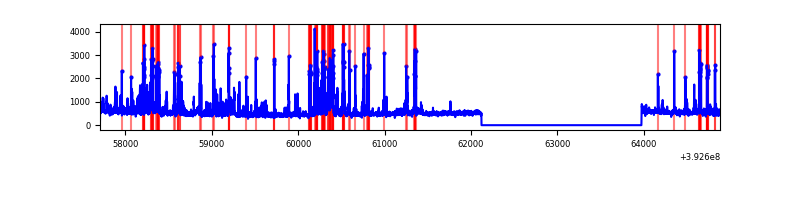 |
| C | 7179 | 5327 | 24 | 24 | 0.33% | 0.45% | 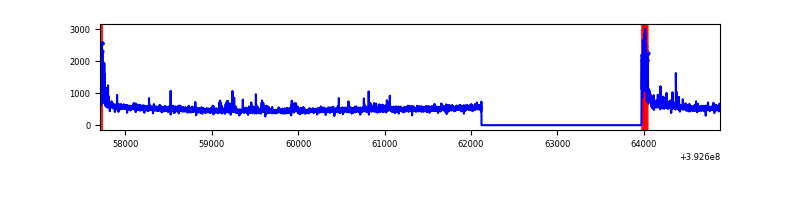 |
| D | 7179 | 5327 | 537 | 537 | 7.48% | 10.08% | 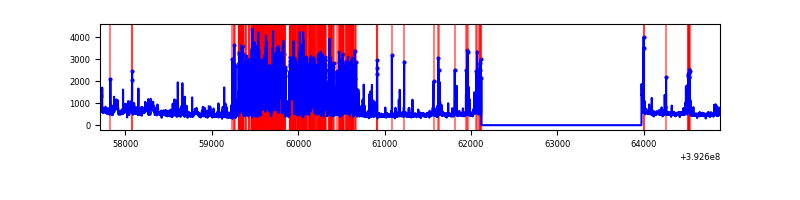 |
Top three noisy pixels from each quadrant. If the there are fewer than three noisy pixels in the level2.evt file, extra rows are filled as -1
| Pixel properties | Quadrant properties | ||||||
|---|---|---|---|---|---|---|---|
| Quadrant | DetID | PixID | Counts | Sigma | Mean | Median | Sigma |
| A | 10 | 83 | 184339 | 1430.96 | 637 | 625 | 128.4 |
| A | 9 | 143 | 10808 | 79.32 | 637 | 625 | 128.4 |
| A | 13 | 254 | 9716 | 70.81 | 637 | 625 | 128.4 |
| B | 5 | 172 | 650641 | 5462.21 | 628 | 611 | 119.0 |
| B | 5 | 236 | 252479 | 2116.45 | 628 | 611 | 119.0 |
| B | 0 | 190 | 33907 | 279.78 | 628 | 611 | 119.0 |
| C | 15 | 214 | 220523 | 1508.84 | 624 | 629 | 145.7 |
| C | 0 | 10 | 197082 | 1347.99 | 624 | 629 | 145.7 |
| C | 6 | 244 | 7114 | 44.5 | 624 | 629 | 145.7 |
| D | 12 | 6 | 1634281 | 11296.31 | 596 | 579 | 144.6 |
| D | 12 | 235 | 158055 | 1088.88 | 596 | 579 | 144.6 |
| D | 13 | 171 | 123475 | 849.77 | 596 | 579 | 144.6 |
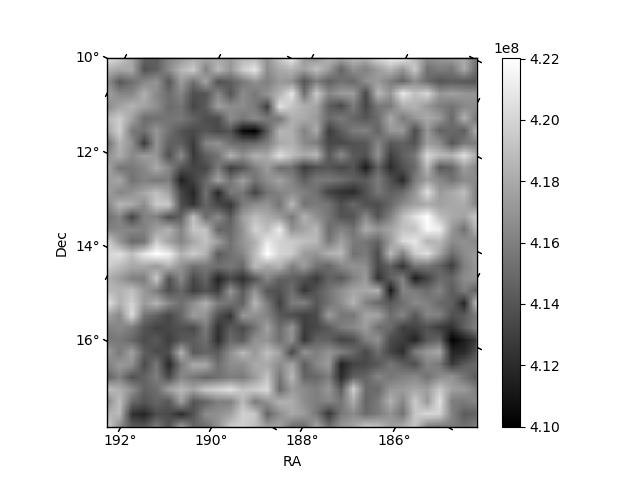
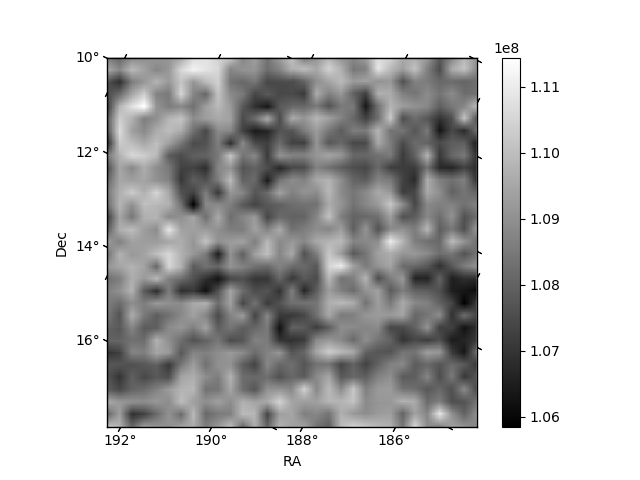
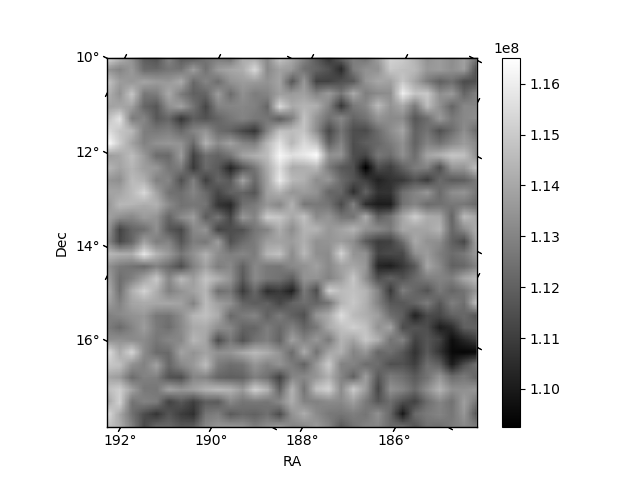
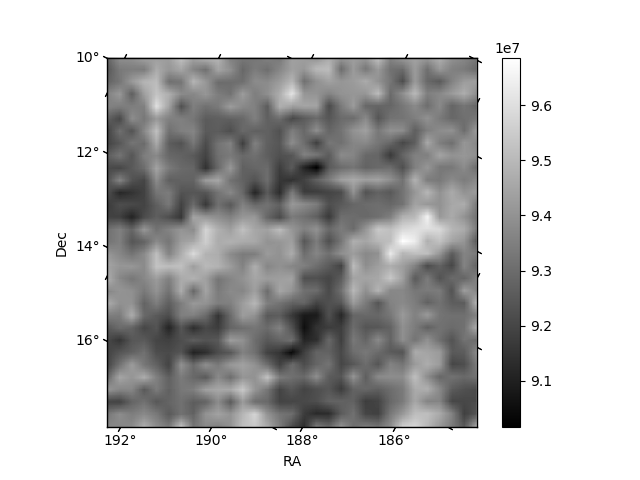
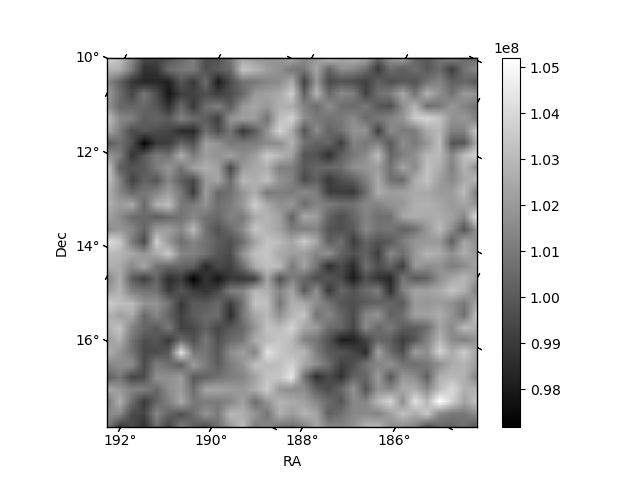
Histogram calculated using DETX and DETY for each event in the final _common_clean file
| Quadrant A | 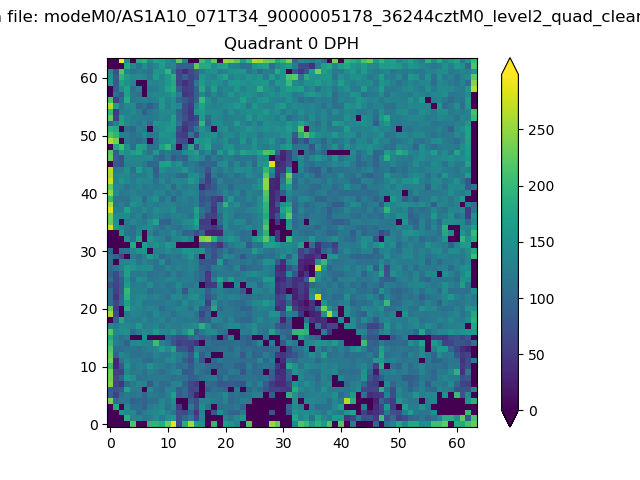 |
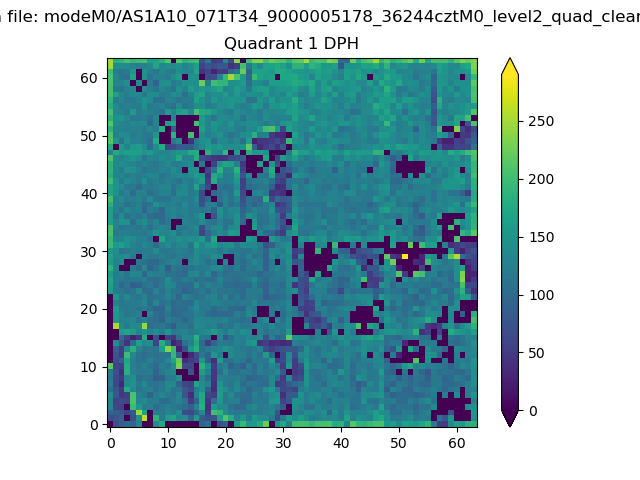 |
Quadrant B |
|---|---|---|---|
| Quadrant D | 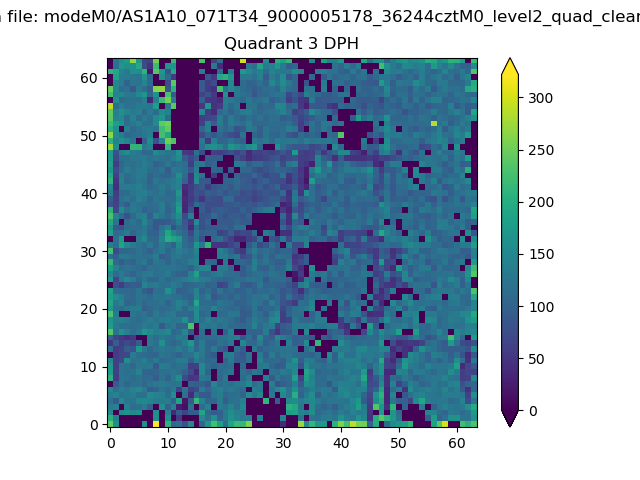 |
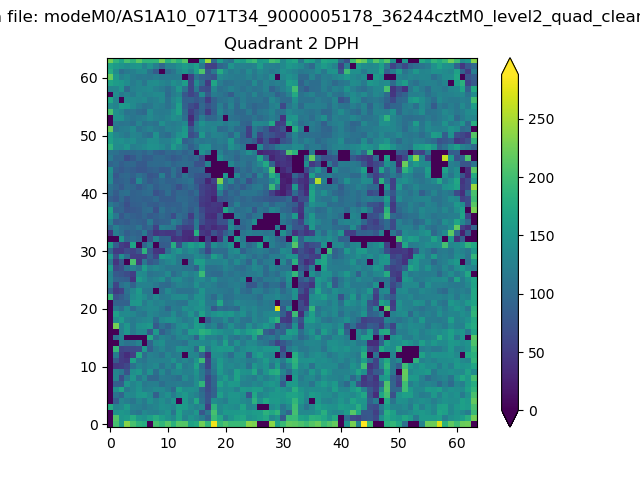 |
Quadrant C |
| Plot type | Count rate plots | Images |
|---|---|---|
| Comparison with Poisson distribution Blue bars denote a histogram of data divided into 1 sec bins. Red curve is a Poisson curve with rate = median count rate of data. |
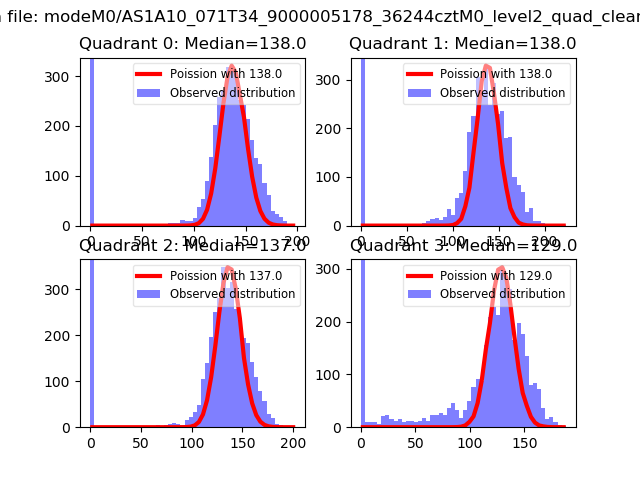 |
 |
| Quadrant-wise count rates Data is divided into 100 sec bins |
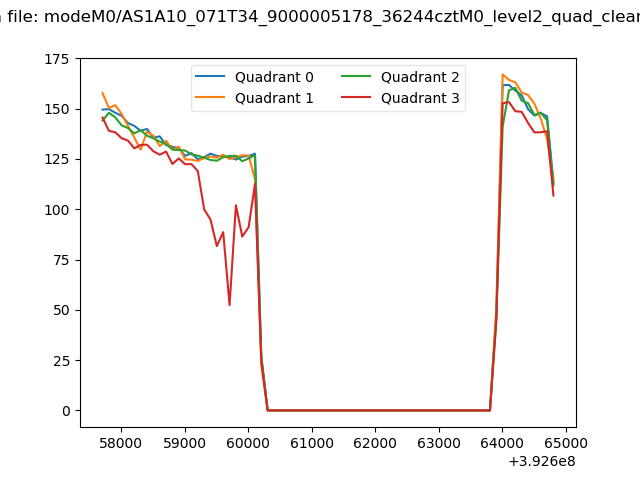 |
|
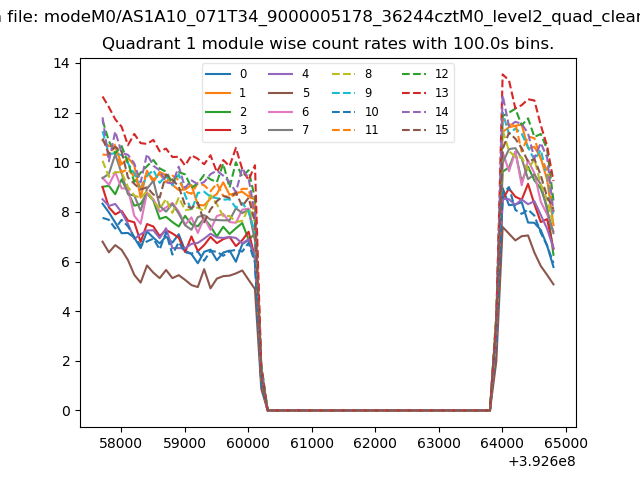
| Module-wise count rates for Quadrant A Data is divided into 100 sec bins |
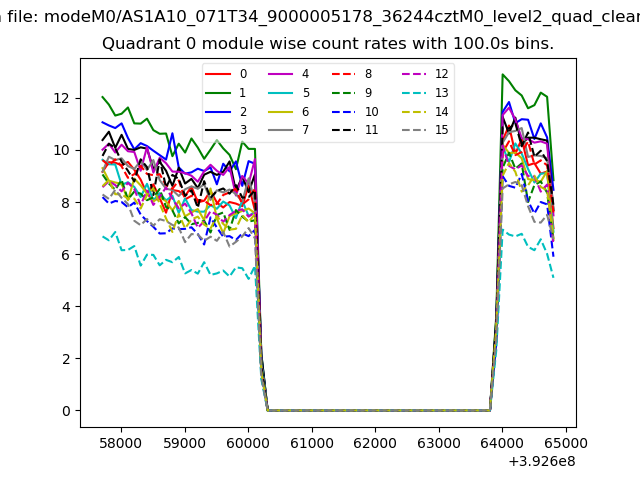 |
 |
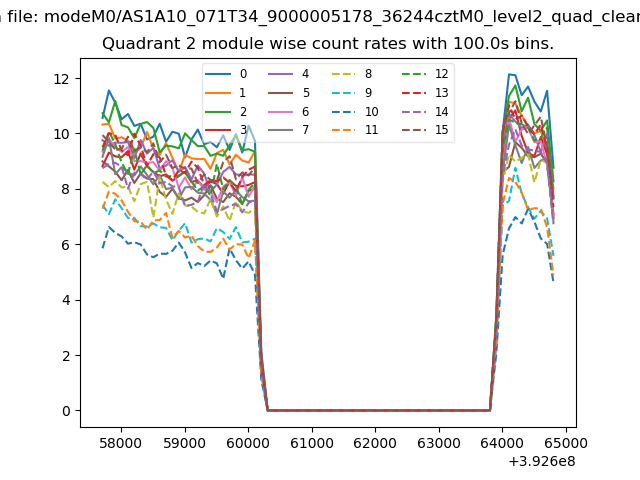
| Module-wise count rates for Quadrant B Data is divided into 100 sec bins |
 |
 |
| Module-wise count rates for Quadrant C Data is divided into 100 sec bins |
 |
 |
| Module-wise count rates for Quadrant D Data is divided into 100 sec bins |
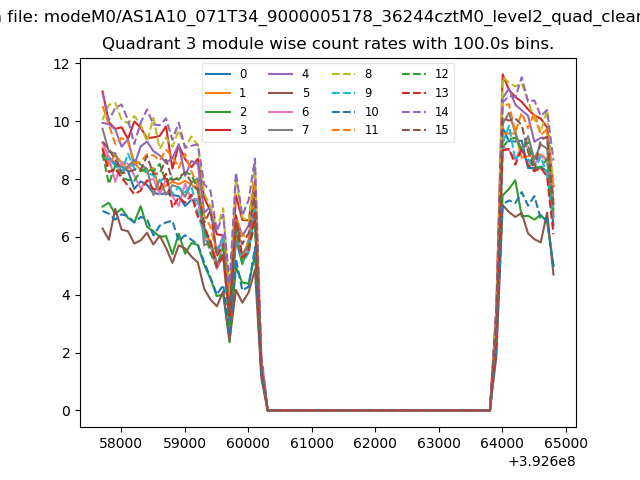 |
 |
| Parameter | Plot |
|---|---|
| CZT HV Monitor | 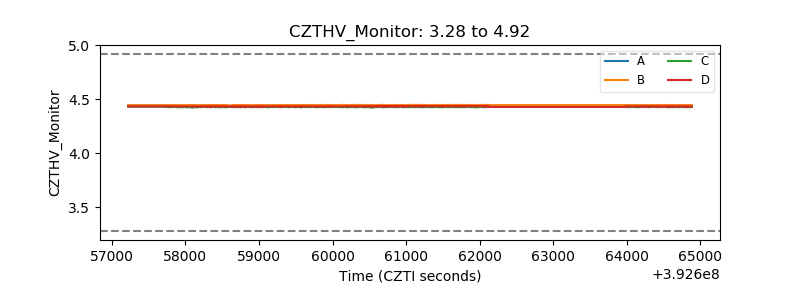 |
| D_VDD | 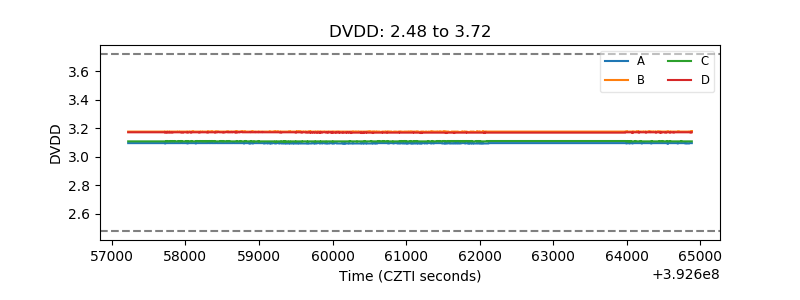 |
| Temperature 1 |  |
| Veto HV Monitor | 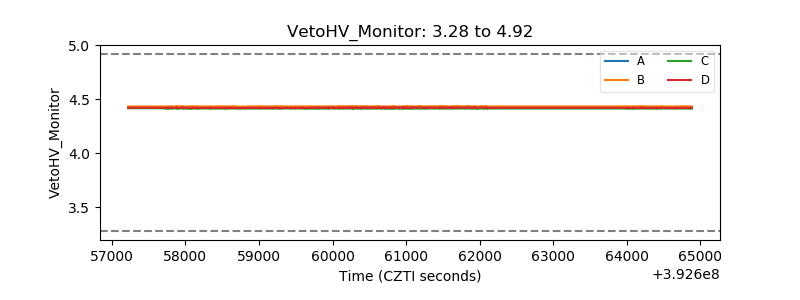 |
| Veto LLD | 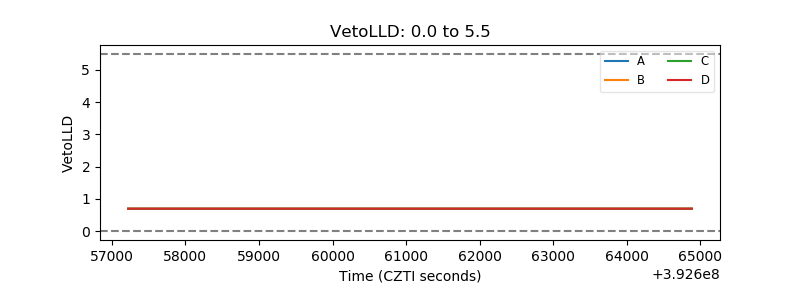 |
| Alpha Counter | 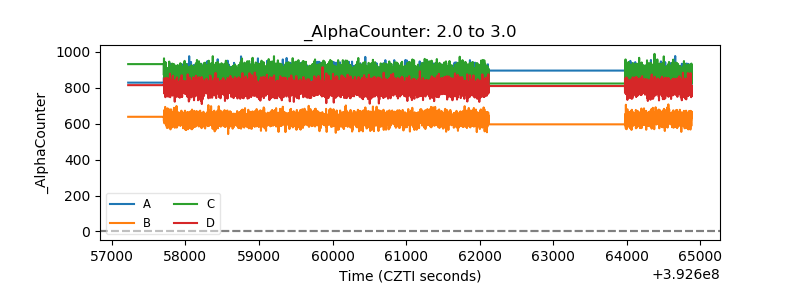 |
| _CPM_Rate | 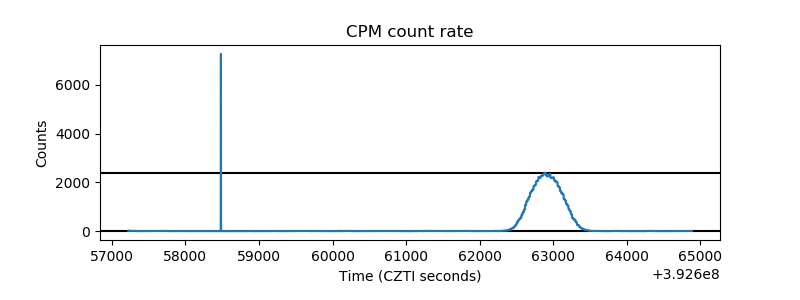 |
| CZT Counter | 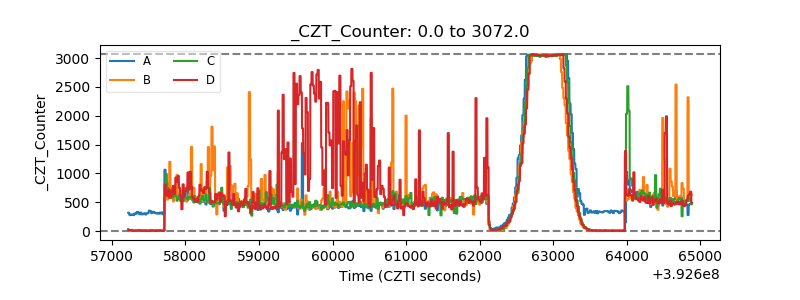 |
| +2.5 Volts monitor | 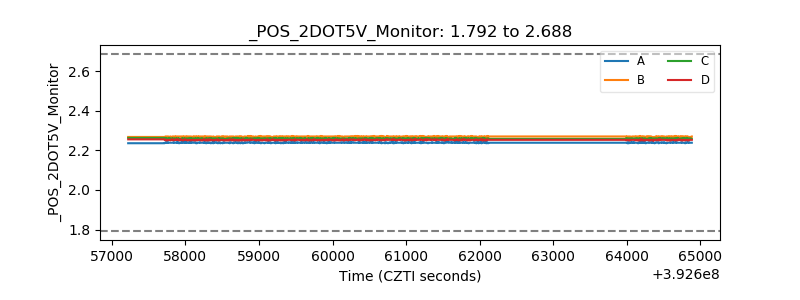 |
| +5 Volts monitor | 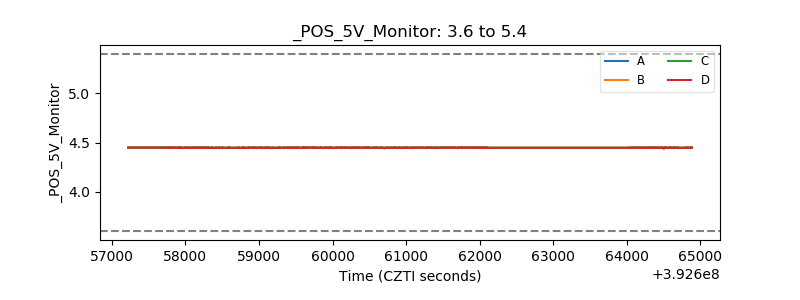 |
| _ROLL_ROT | 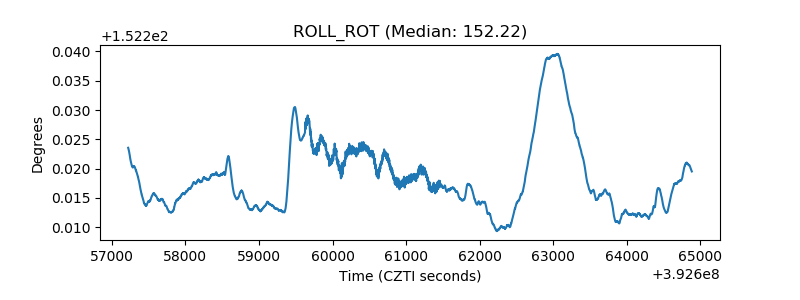 |
| _Roll_DEC | 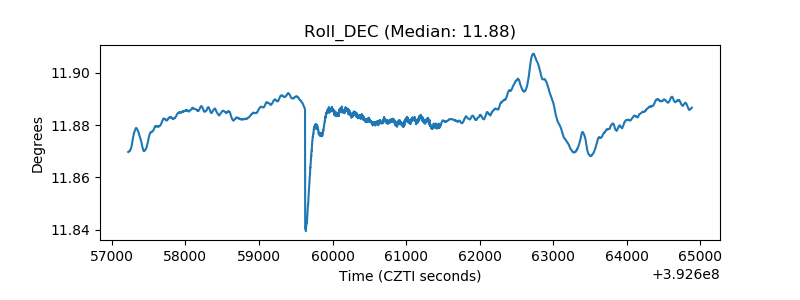 |
| _Roll_RA | 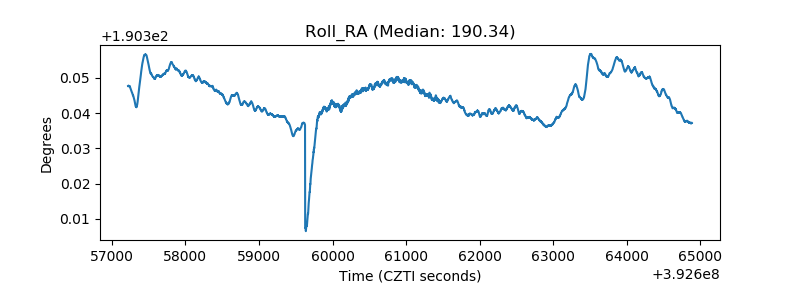 |
| Veto Counter | 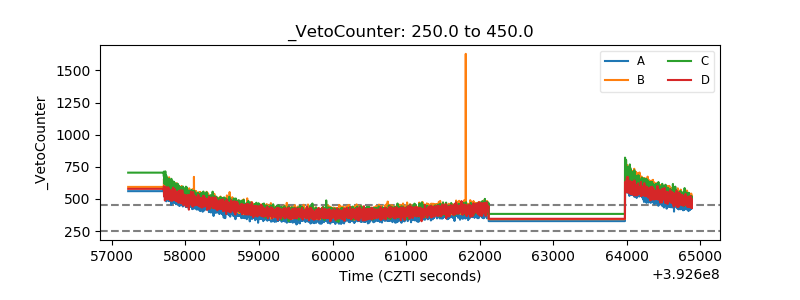 |