| Param | Original file | Final file |
|---|---|---|
| Filename | modeM0/AS1A10_071T34_9000005178_36240cztM0_level2.evt | modeM0/AS1A10_071T34_9000005178_36240cztM0_level2_quad_clean.evt |
| Size (bytes) | 852,577,920 | 153,763,200 |
| Size | 813.1 MB | 146.6 MB |
| Events in quadrant A | 5,248,604 | 999,252 |
| Events in quadrant B | 6,071,680 | 1,005,494 |
| Events in quadrant C | 5,674,057 | 989,131 |
| Events in quadrant D | 8,099,997 | 919,656 |
| Mode SS | |||
|---|---|---|---|
| Quadrant | BADHDUFLAG | Total packets | Discarded packets |
| A | 0 | 218 | 0 |
| B | 0 | 218 | 0 |
| C | 0 | 218 | 0 |
| D | 0 | 218 | 0 |
| Mode M9 | |||
|---|---|---|---|
| Quadrant | BADHDUFLAG | Total packets | Discarded packets |
| A | 0 | 29 | 0 |
| B | 0 | 29 | 0 |
| C | 0 | 29 | 0 |
| D | 0 | 30 | 0 |
| Mode M0 | |||
|---|---|---|---|
| Quadrant | BADHDUFLAG | Total packets | Discarded packets |
| A | 0 | 22378 | 4 |
| B | 0 | 24850 | 3 |
| C | 0 | 23120 | 3 |
| D | 0 | 31141 | 3 |
| Quadrant | Total seconds | Saturated seconds | Saturation percentage |
|---|---|---|---|
| A | 10739 | 41 | 0.381786% |
| B | 10739 | 236 | 2.197598% |
| C | 10739 | 76 | 0.707701% |
| D | 10739 | 659 | 6.136512% |
Noise dominated data is calculated using 1-second bins in cleaned event files. If a bin has >2000 counts, and if more than 50% of those come from <1% of pixels, then it is considered to be noise-dominated and hence unusable.
| Quadrant | # 1 sec bins | Bins with >0 counts | Bins with >2000 counts | High rate bins dominated by noise | Noise dominated (total time) | Noise dominated (detector-on time) | Marked lightcurve |
|---|---|---|---|---|---|---|---|
| A | 13545 | 10741 | 22 | 22 | 0.16% | 0.20% | 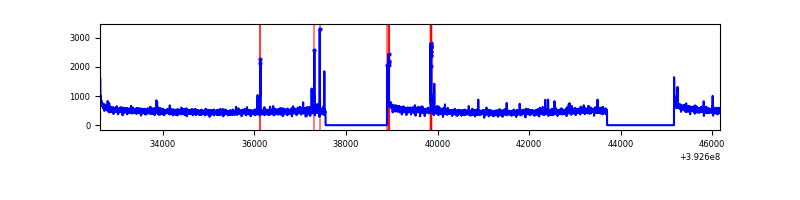 |
| B | 13545 | 10741 | 146 | 146 | 1.08% | 1.36% | 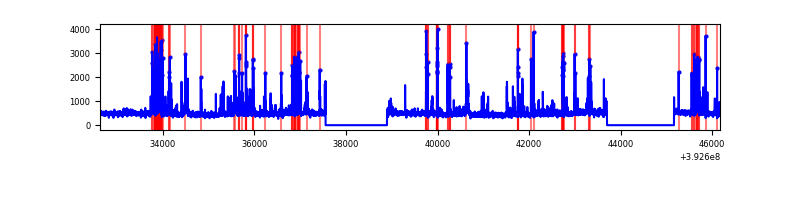 |
| C | 13545 | 10741 | 50 | 50 | 0.37% | 0.47% | 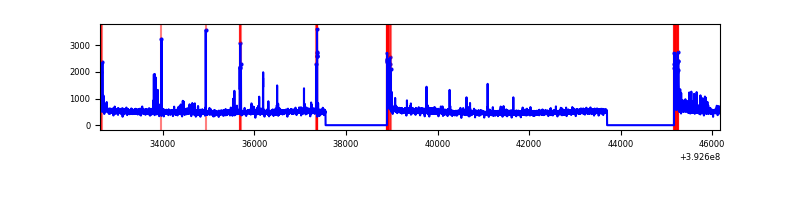 |
| D | 13545 | 10741 | 551 | 551 | 4.07% | 5.13% | 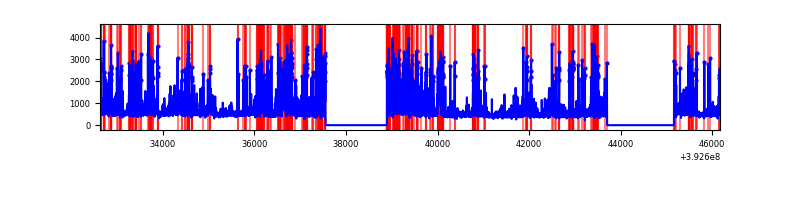 |
Top three noisy pixels from each quadrant. If the there are fewer than three noisy pixels in the level2.evt file, extra rows are filled as -1
| Pixel properties | Quadrant properties | ||||||
|---|---|---|---|---|---|---|---|
| Quadrant | DetID | PixID | Counts | Sigma | Mean | Median | Sigma |
| A | 10 | 83 | 311359 | 1218.63 | 1252 | 1226 | 254.5 |
| A | 9 | 143 | 85098 | 329.57 | 1252 | 1226 | 254.5 |
| A | 13 | 254 | 18990 | 69.8 | 1252 | 1226 | 254.5 |
| B | 5 | 172 | 897992 | 3736.52 | 1236 | 1203 | 240.0 |
| B | 5 | 255 | 80130 | 328.85 | 1236 | 1203 | 240.0 |
| B | 0 | 245 | 59452 | 242.7 | 1236 | 1203 | 240.0 |
| C | 15 | 214 | 444568 | 1547.58 | 1219 | 1227 | 286.5 |
| C | 0 | 10 | 345517 | 1201.82 | 1219 | 1227 | 286.5 |
| C | 0 | 207 | 131227 | 453.79 | 1219 | 1227 | 286.5 |
| D | 12 | 6 | 1000164 | 3424.45 | 1193 | 1163 | 291.7 |
| D | 12 | 235 | 432556 | 1478.76 | 1193 | 1163 | 291.7 |
| D | 2 | 250 | 428152 | 1463.66 | 1193 | 1163 | 291.7 |
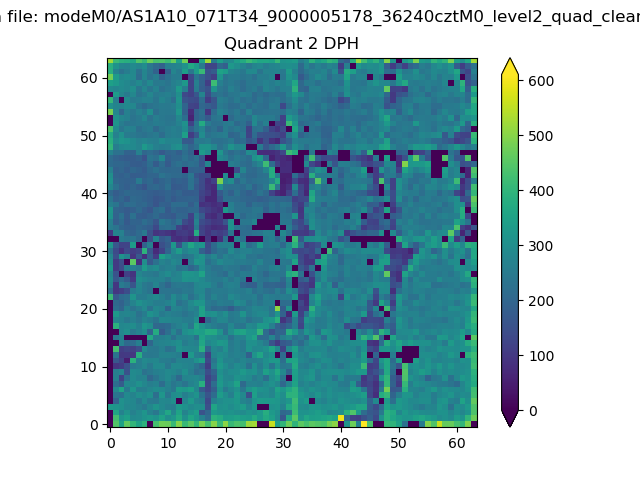
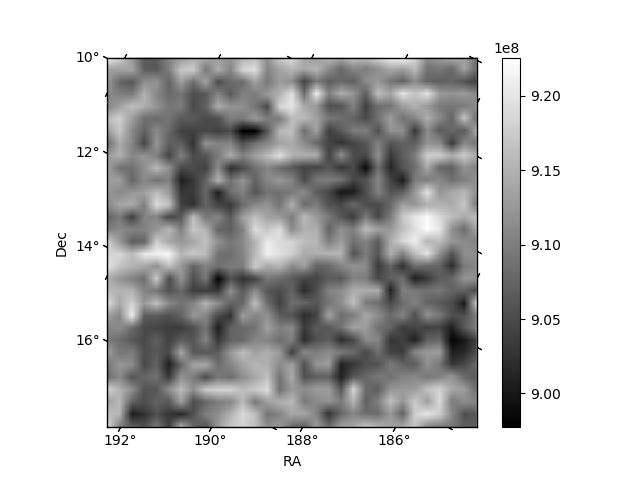
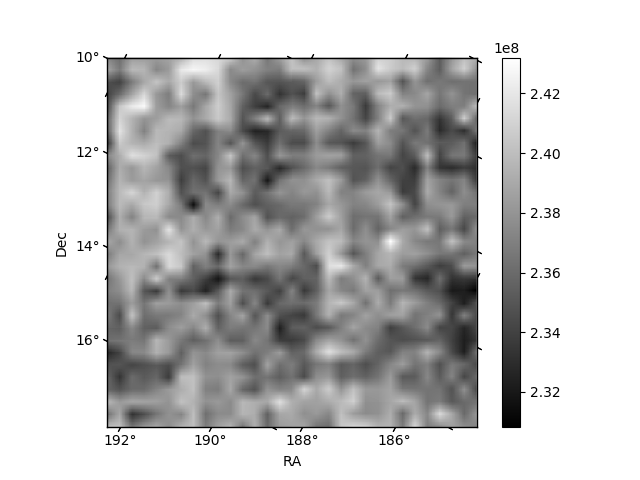
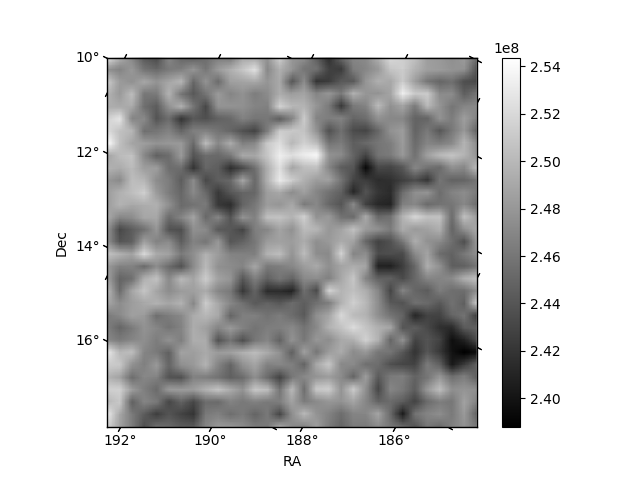
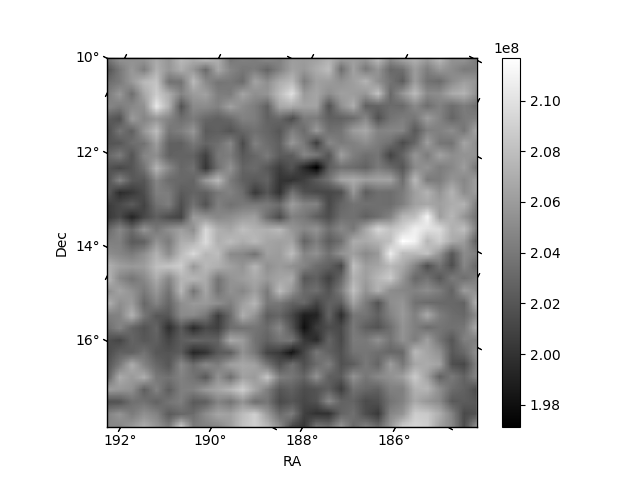
Histogram calculated using DETX and DETY for each event in the final _common_clean file
| Quadrant A | 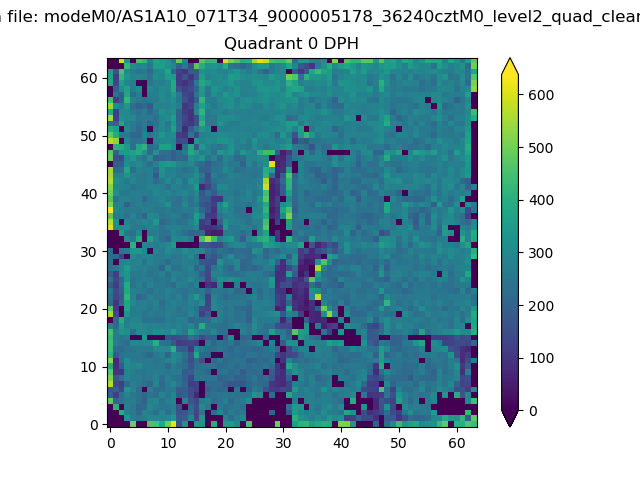 |
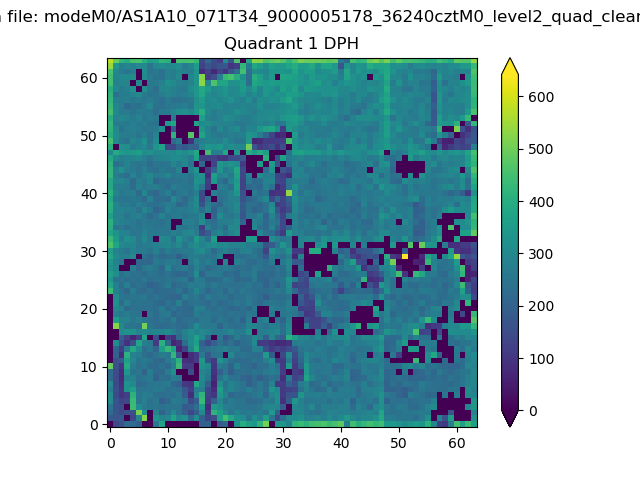 |
Quadrant B |
|---|---|---|---|
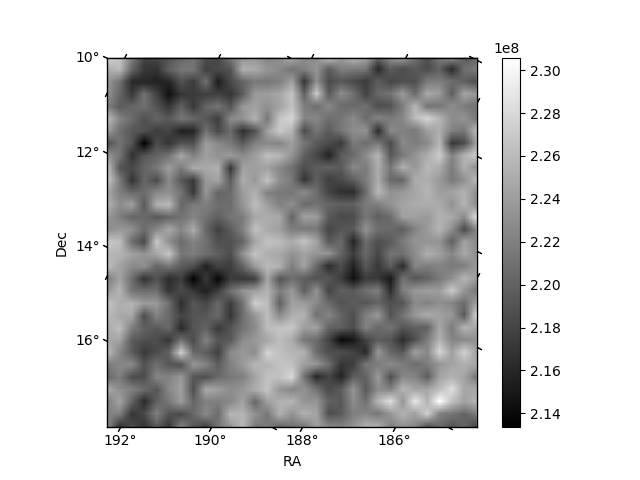
| Quadrant D | 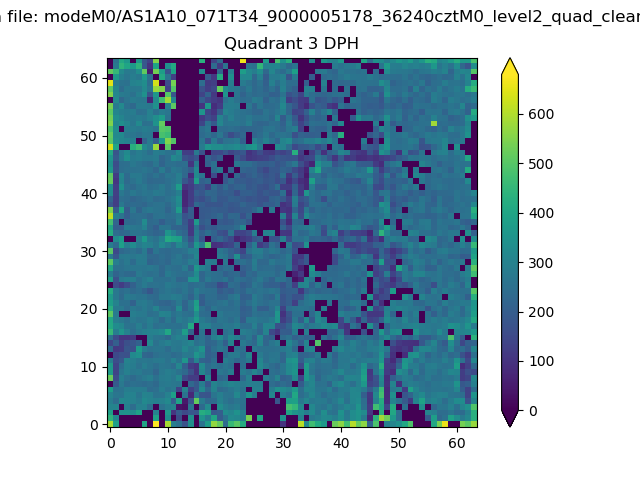 |
 |
Quadrant C |
| Plot type | Count rate plots | Images |
|---|---|---|
| Comparison with Poisson distribution Blue bars denote a histogram of data divided into 1 sec bins. Red curve is a Poisson curve with rate = median count rate of data. |
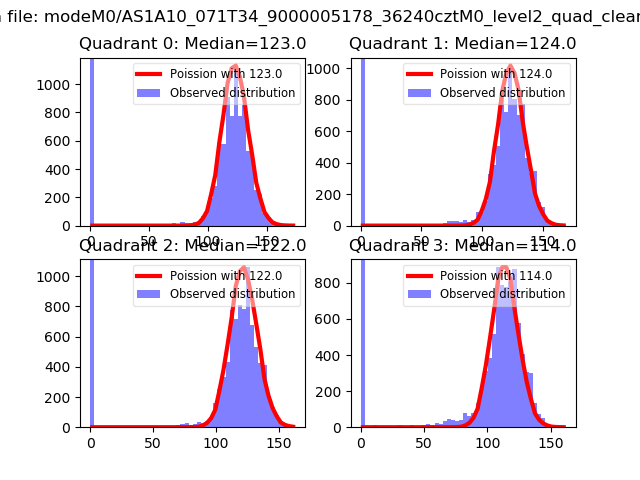 |
 |
| Quadrant-wise count rates Data is divided into 100 sec bins |
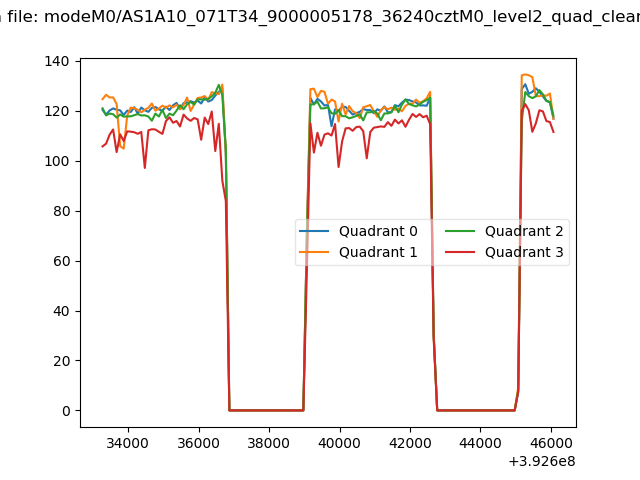 |
|
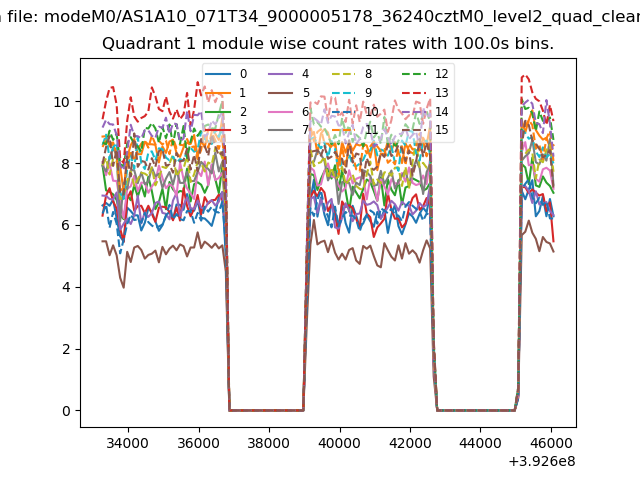
| Module-wise count rates for Quadrant A Data is divided into 100 sec bins |
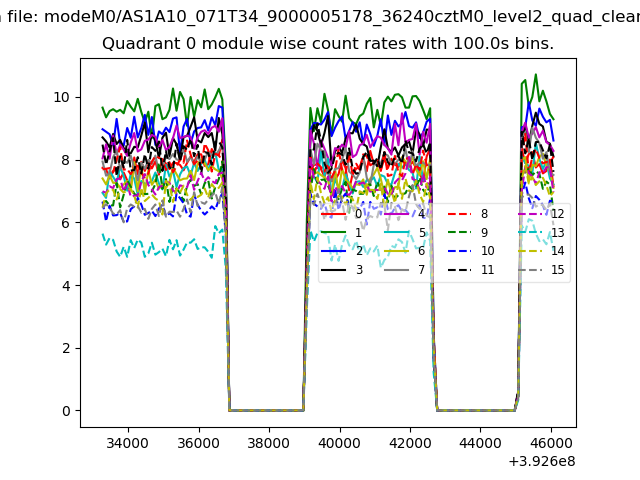 |
 |
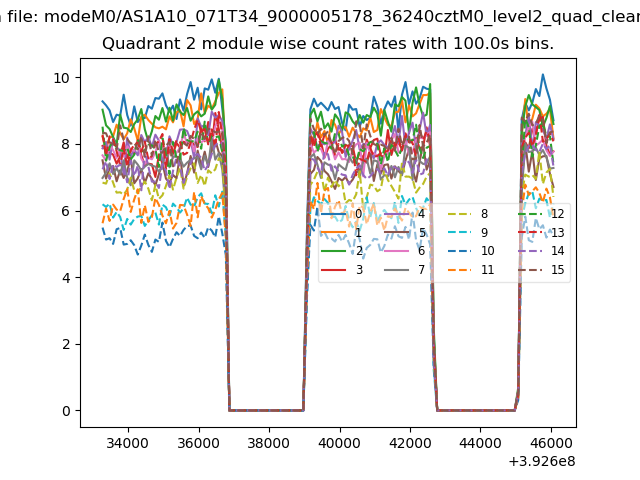
| Module-wise count rates for Quadrant B Data is divided into 100 sec bins |
 |
 |
| Module-wise count rates for Quadrant C Data is divided into 100 sec bins |
 |
 |
| Module-wise count rates for Quadrant D Data is divided into 100 sec bins |
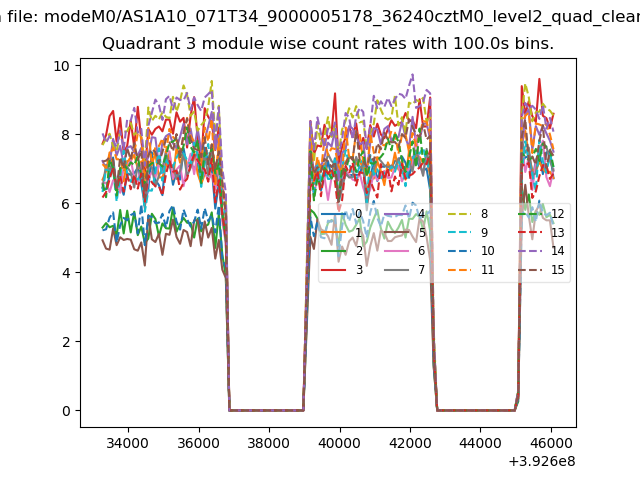 |
 |
| Parameter | Plot |
|---|---|
| CZT HV Monitor | 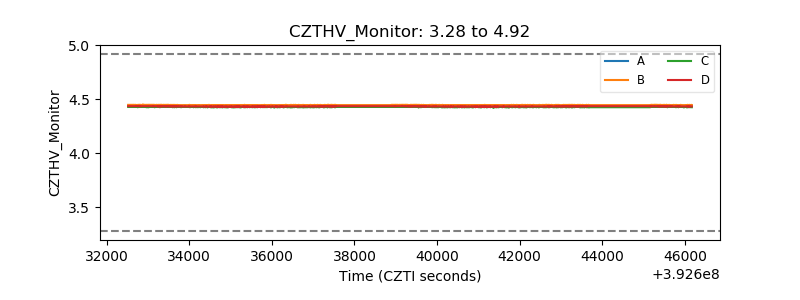 |
| D_VDD | 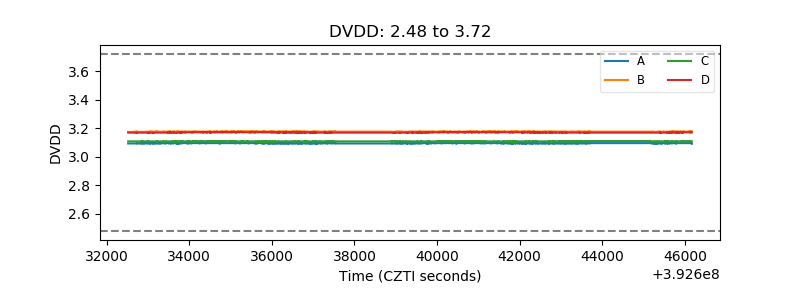 |
| Temperature 1 | 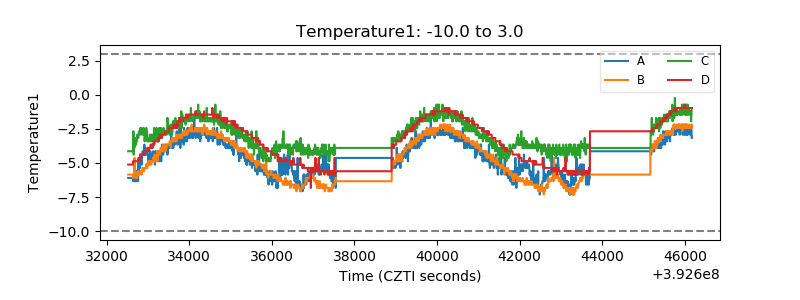 |
| Veto HV Monitor | 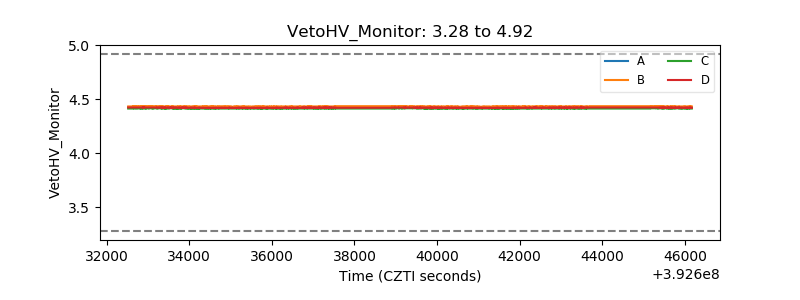 |
| Veto LLD | 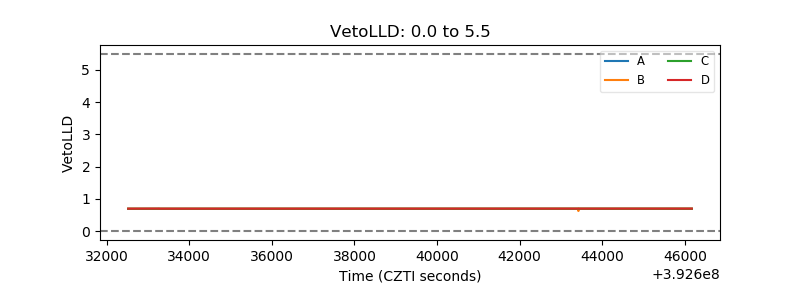 |
| Alpha Counter | 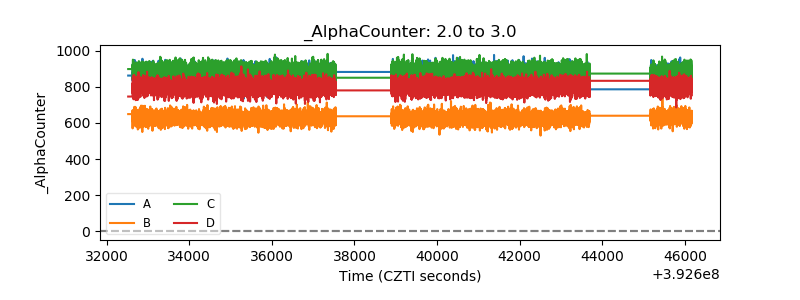 |
| _CPM_Rate | 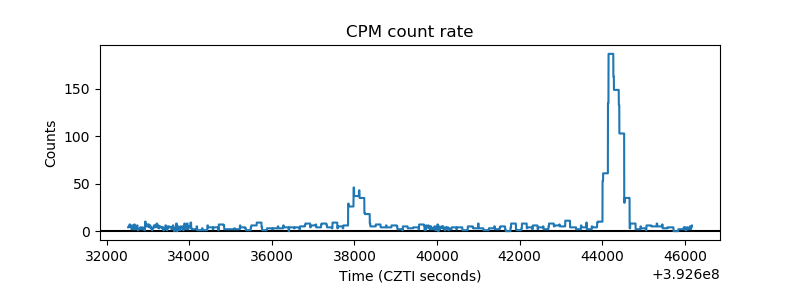 |
| CZT Counter | 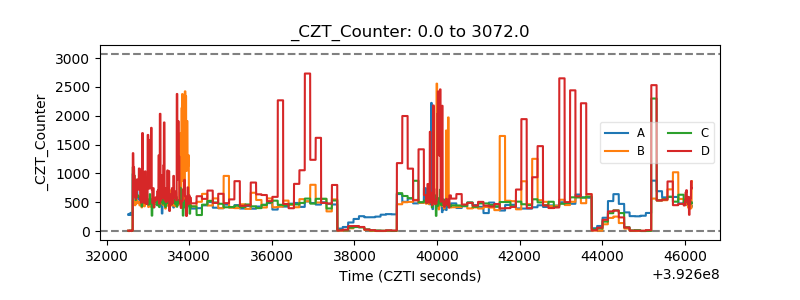 |
| +2.5 Volts monitor | 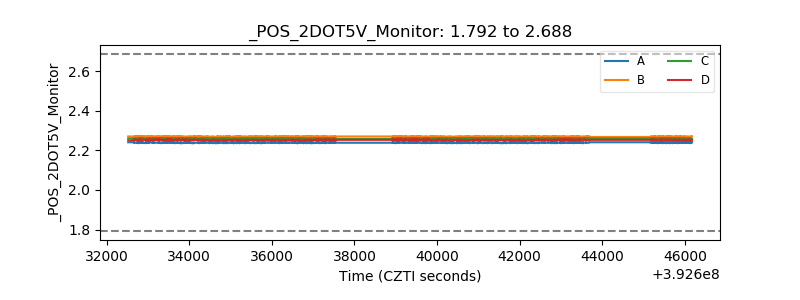 |
| +5 Volts monitor | 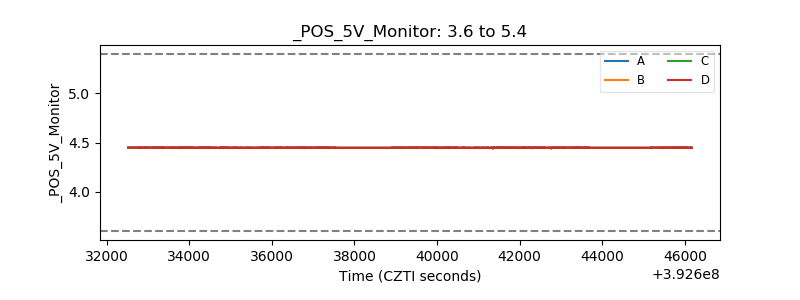 |
| _ROLL_ROT | 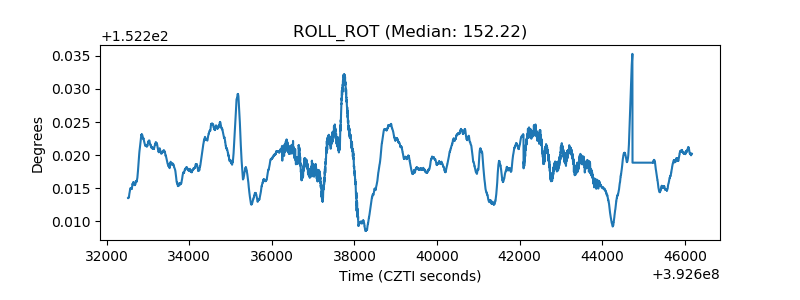 |
| _Roll_DEC | 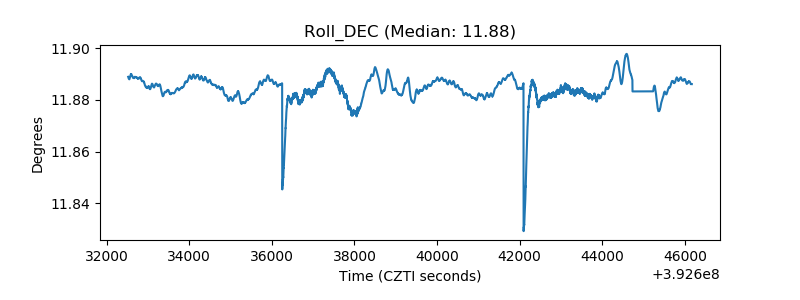 |
| _Roll_RA | 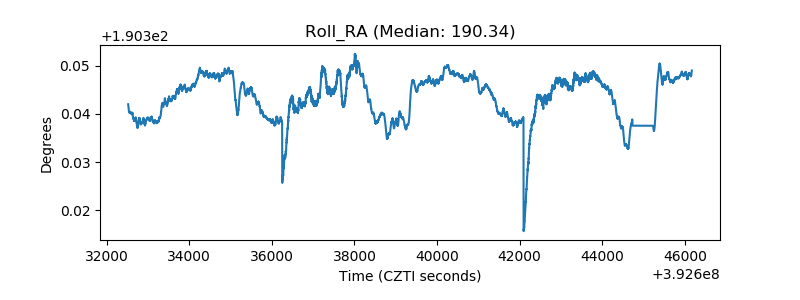 |
| Veto Counter | 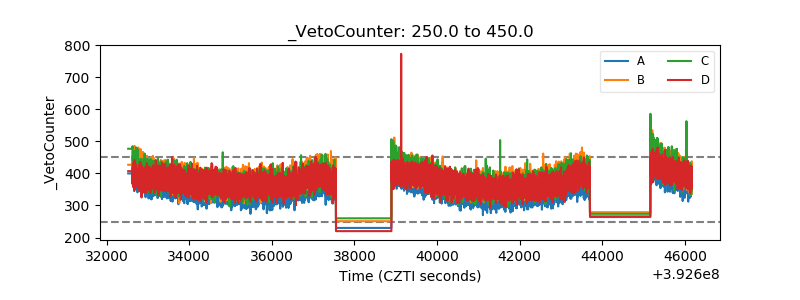 |