| Param | Original file | Final file |
|---|---|---|
| Filename | modeM0/AS1A10_071T34_9000005178_36238cztM0_level2.evt | modeM0/AS1A10_071T34_9000005178_36238cztM0_level2_quad_clean.evt |
| Size (bytes) | 558,034,560 | 95,639,040 |
| Size | 532.2 MB | 91.2 MB |
| Events in quadrant A | 3,405,024 | 612,805 |
| Events in quadrant B | 3,763,888 | 620,391 |
| Events in quadrant C | 3,603,394 | 609,970 |
| Events in quadrant D | 5,654,621 | 566,620 |
| Mode SS | |||
|---|---|---|---|
| Quadrant | BADHDUFLAG | Total packets | Discarded packets |
| A | 0 | 144 | 0 |
| B | 0 | 144 | 0 |
| C | 0 | 144 | 0 |
| D | 0 | 144 | 0 |
| Mode M9 | |||
|---|---|---|---|
| Quadrant | BADHDUFLAG | Total packets | Discarded packets |
| A | 0 | 26 | 0 |
| B | 0 | 26 | 0 |
| C | 0 | 26 | 0 |
| D | 0 | 26 | 0 |
| Mode M0 | |||
|---|---|---|---|
| Quadrant | BADHDUFLAG | Total packets | Discarded packets |
| A | 0 | 14372 | 3 |
| B | 0 | 15465 | 2 |
| C | 0 | 14635 | 2 |
| D | 0 | 21433 | 2 |
| Quadrant | Total seconds | Saturated seconds | Saturation percentage |
|---|---|---|---|
| A | 6983 | 8 | 0.114564% |
| B | 6983 | 74 | 1.059716% |
| C | 6983 | 24 | 0.343692% |
| D | 6983 | 402 | 5.756838% |
Noise dominated data is calculated using 1-second bins in cleaned event files. If a bin has >2000 counts, and if more than 50% of those come from <1% of pixels, then it is considered to be noise-dominated and hence unusable.
| Quadrant | # 1 sec bins | Bins with >0 counts | Bins with >2000 counts | High rate bins dominated by noise | Noise dominated (total time) | Noise dominated (detector-on time) | Marked lightcurve |
|---|---|---|---|---|---|---|---|
| A | 9579 | 6985 | 4 | 4 | 0.04% | 0.06% | 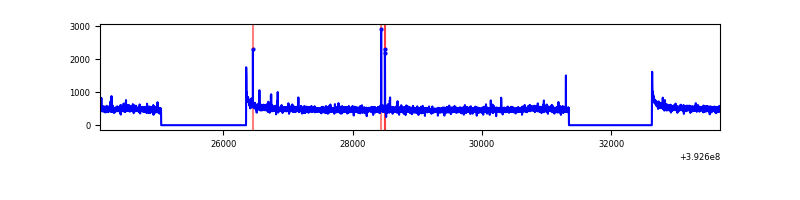 |
| B | 9579 | 6985 | 46 | 46 | 0.48% | 0.66% | 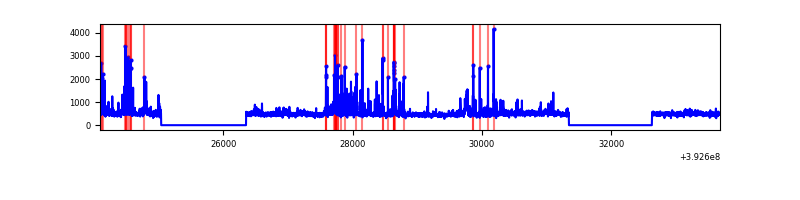 |
| C | 9579 | 6985 | 13 | 13 | 0.14% | 0.19% | 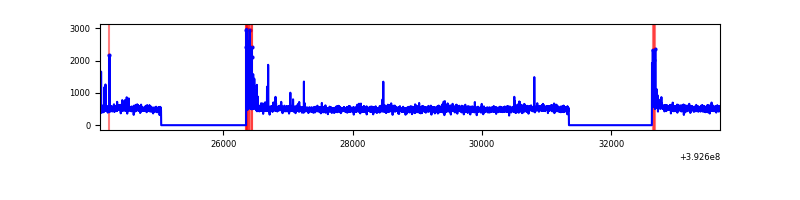 |
| D | 9579 | 6985 | 356 | 356 | 3.72% | 5.10% | 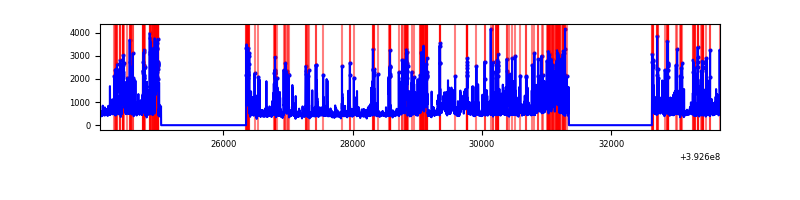 |
Top three noisy pixels from each quadrant. If the there are fewer than three noisy pixels in the level2.evt file, extra rows are filled as -1
| Pixel properties | Quadrant properties | ||||||
|---|---|---|---|---|---|---|---|
| Quadrant | DetID | PixID | Counts | Sigma | Mean | Median | Sigma |
| A | 10 | 83 | 202277 | 1209.4 | 819 | 801 | 166.6 |
| A | 9 | 143 | 19748 | 113.73 | 819 | 801 | 166.6 |
| A | 13 | 254 | 12763 | 71.8 | 819 | 801 | 166.6 |
| B | 5 | 172 | 199847 | 1260.82 | 814 | 792 | 157.9 |
| B | 5 | 236 | 186191 | 1174.33 | 814 | 792 | 157.9 |
| B | 0 | 190 | 48232 | 300.49 | 814 | 792 | 157.9 |
| C | 15 | 214 | 289369 | 1534.37 | 799 | 804 | 188.1 |
| C | 0 | 10 | 158591 | 838.99 | 799 | 804 | 188.1 |
| C | 12 | 250 | 27869 | 143.91 | 799 | 804 | 188.1 |
| D | 12 | 6 | 964670 | 5025.24 | 781 | 760 | 191.8 |
| D | 12 | 227 | 470888 | 2450.96 | 781 | 760 | 191.8 |
| D | 12 | 235 | 342037 | 1779.21 | 781 | 760 | 191.8 |
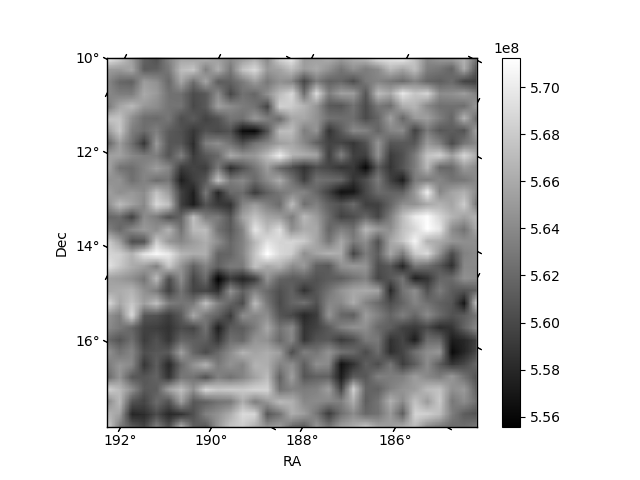
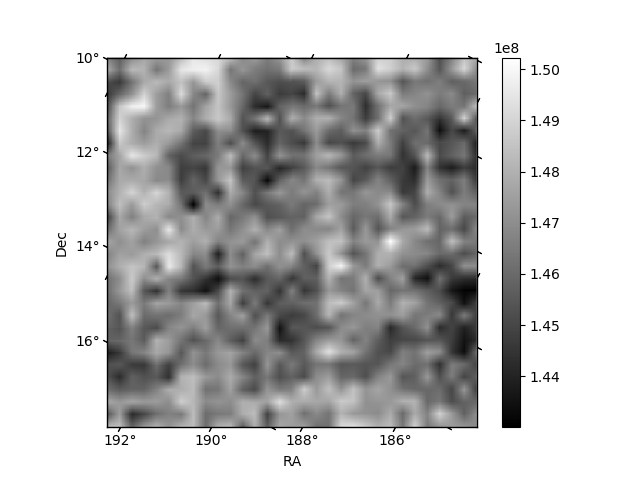
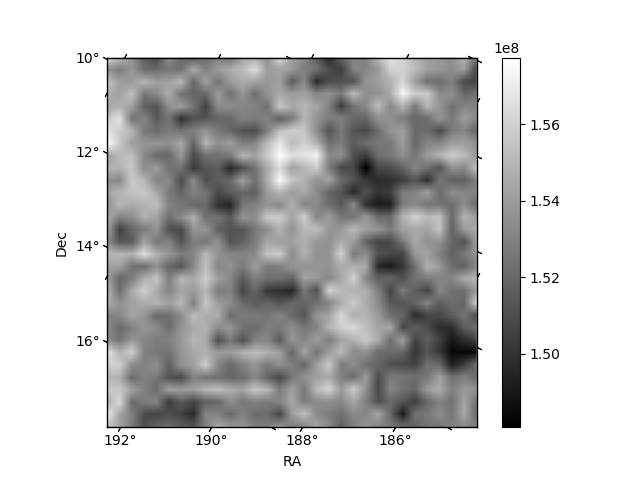
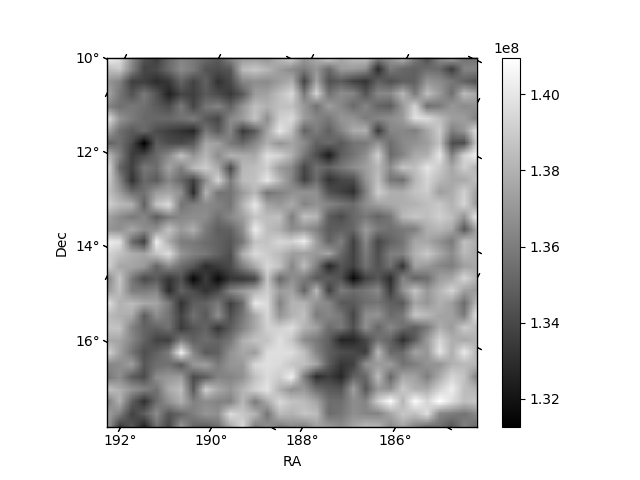
Histogram calculated using DETX and DETY for each event in the final _common_clean file
| Quadrant A | 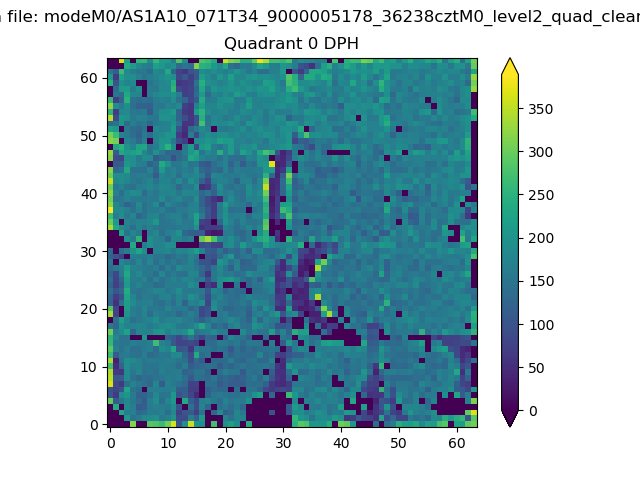 |
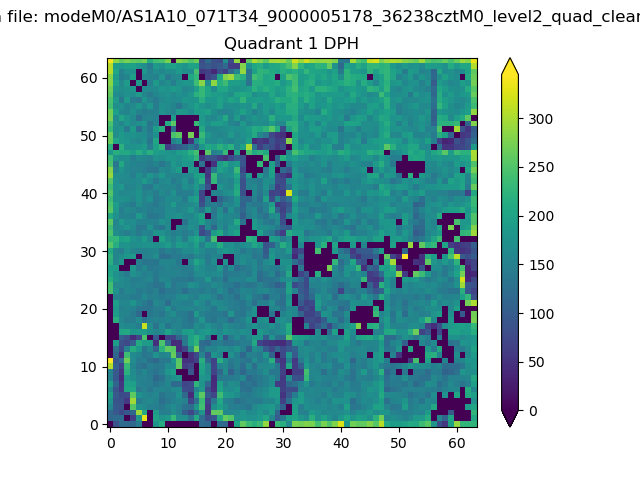 |
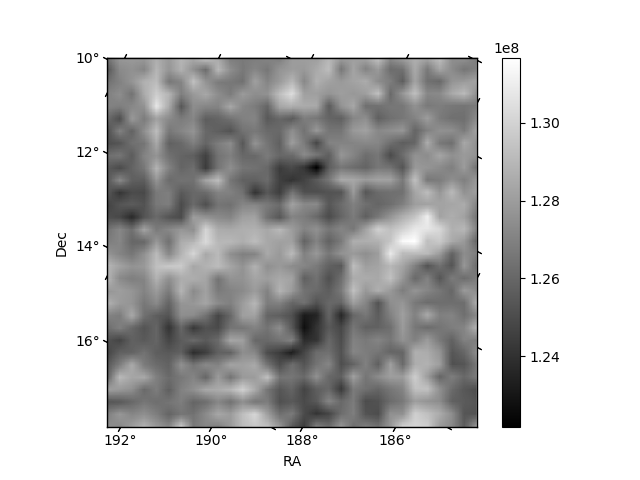
Quadrant B |
|---|---|---|---|
| Quadrant D | 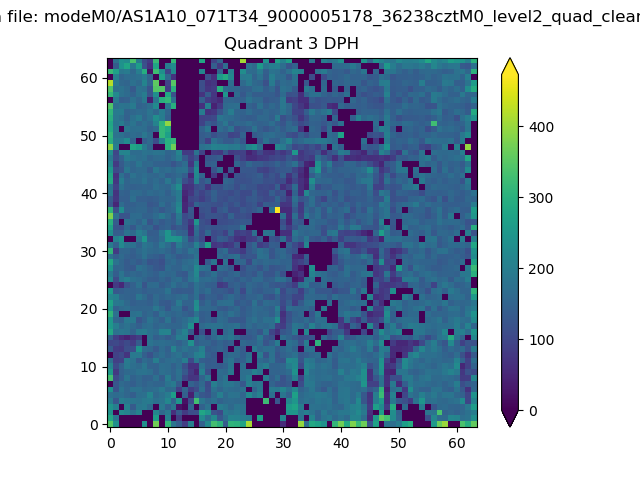 |
 |
Quadrant C |
| Plot type | Count rate plots | Images |
|---|---|---|
| Comparison with Poisson distribution Blue bars denote a histogram of data divided into 1 sec bins. Red curve is a Poisson curve with rate = median count rate of data. |
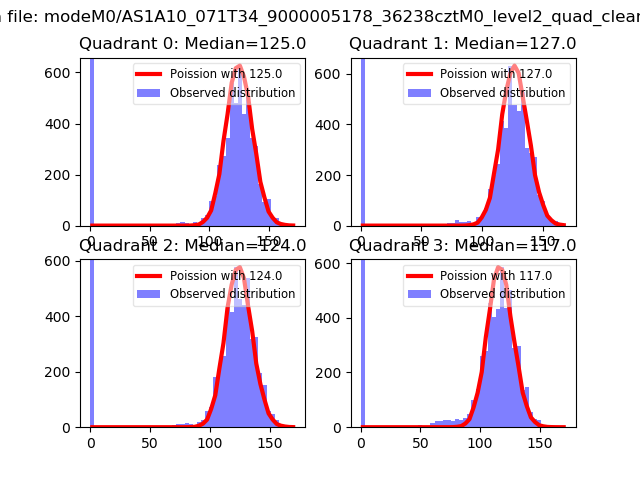 |
 |
| Quadrant-wise count rates Data is divided into 100 sec bins |
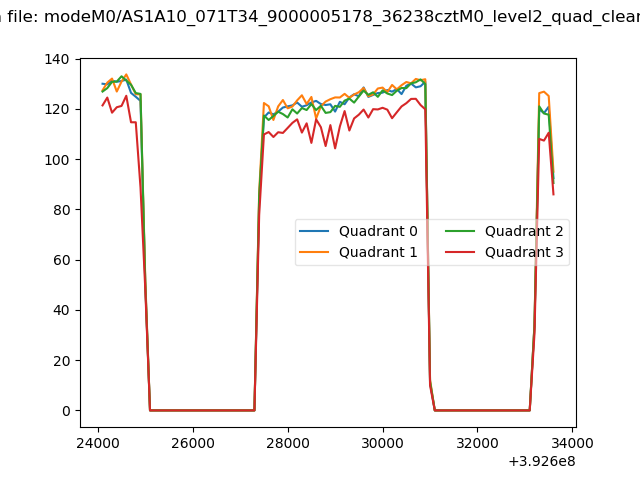 |
|
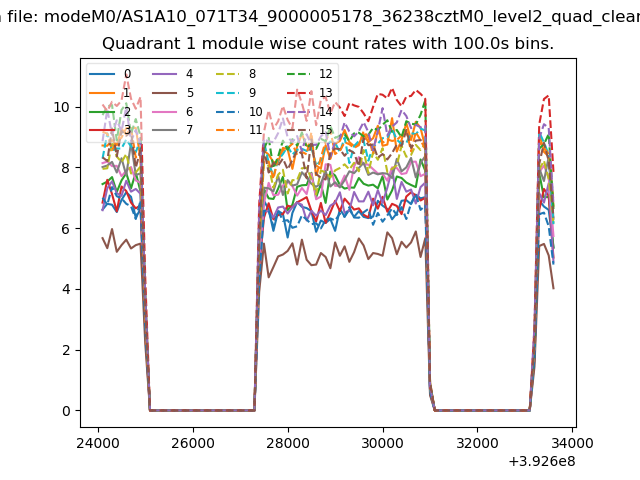
| Module-wise count rates for Quadrant A Data is divided into 100 sec bins |
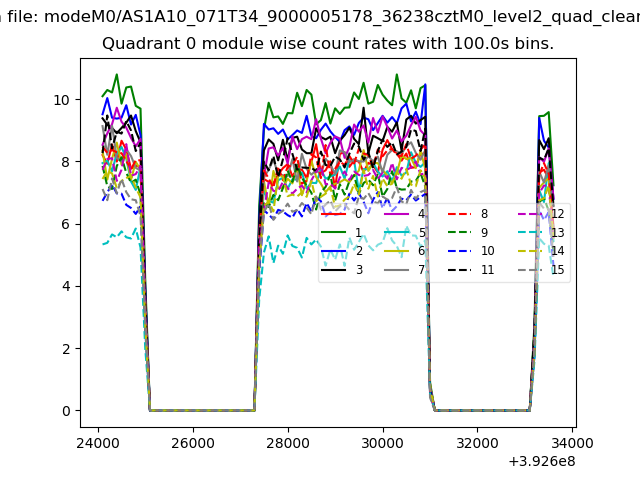 |
 |
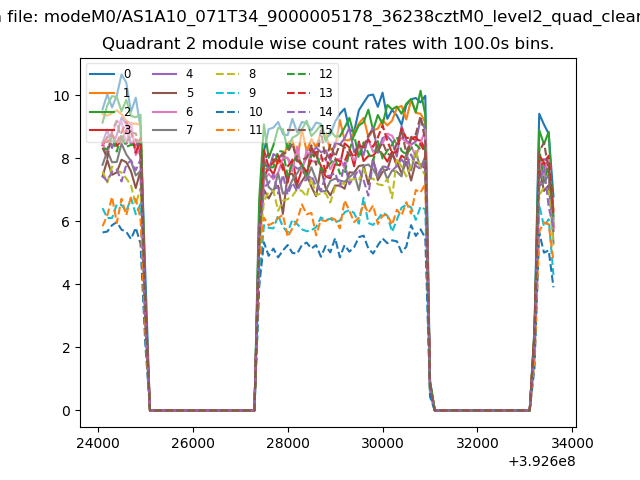
| Module-wise count rates for Quadrant B Data is divided into 100 sec bins |
 |
 |
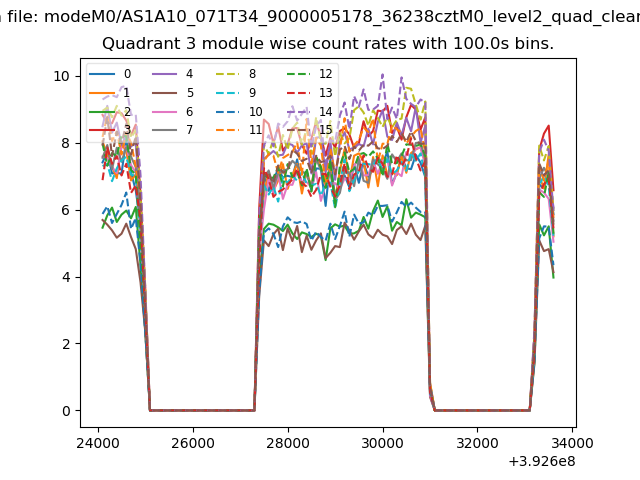
| Module-wise count rates for Quadrant C Data is divided into 100 sec bins |
 |
 |
| Module-wise count rates for Quadrant D Data is divided into 100 sec bins |
 |
 |
| Parameter | Plot |
|---|---|
| CZT HV Monitor | 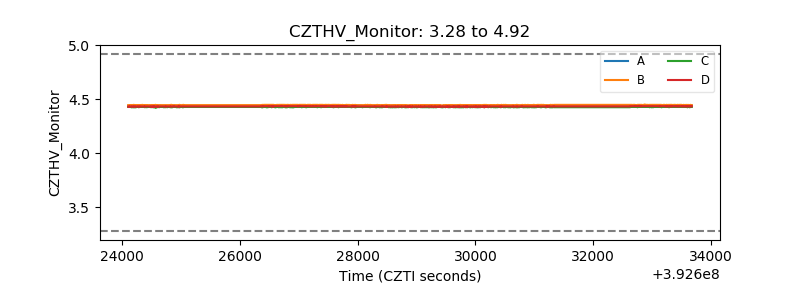 |
| D_VDD | 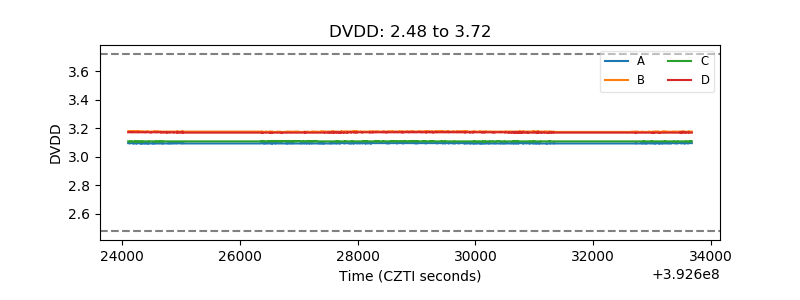 |
| Temperature 1 | 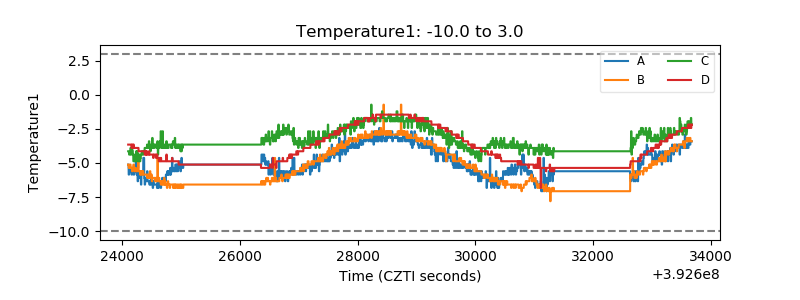 |
| Veto HV Monitor | 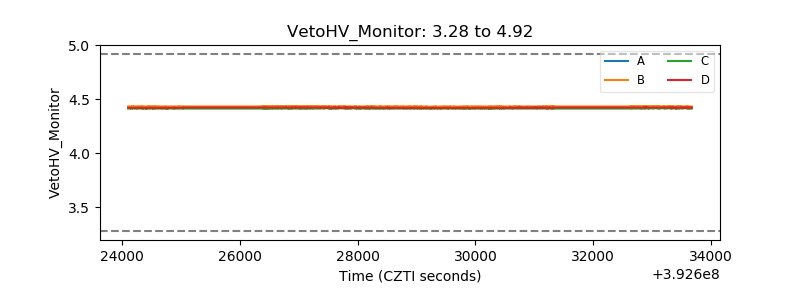 |
| Veto LLD | 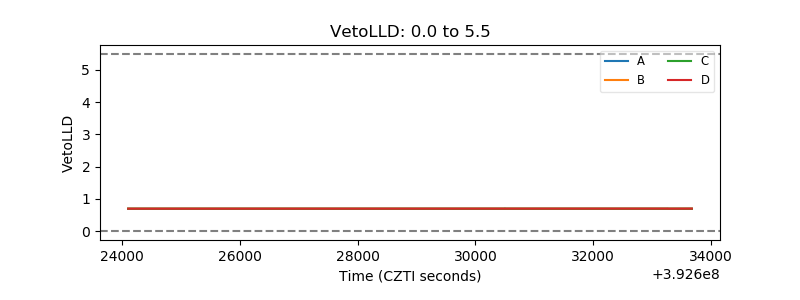 |
| Alpha Counter | 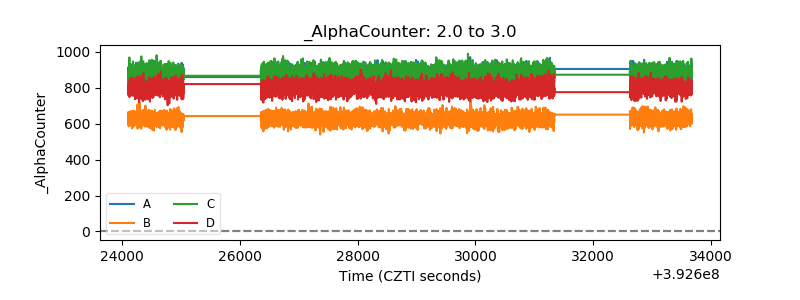 |
| _CPM_Rate | 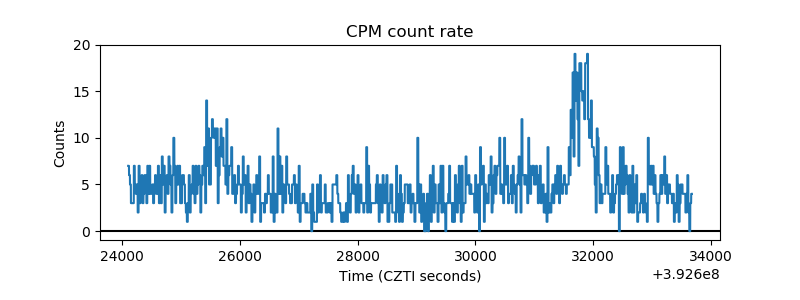 |
| CZT Counter | 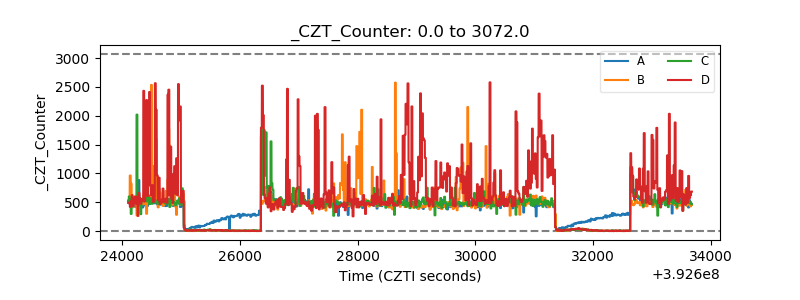 |
| +2.5 Volts monitor | 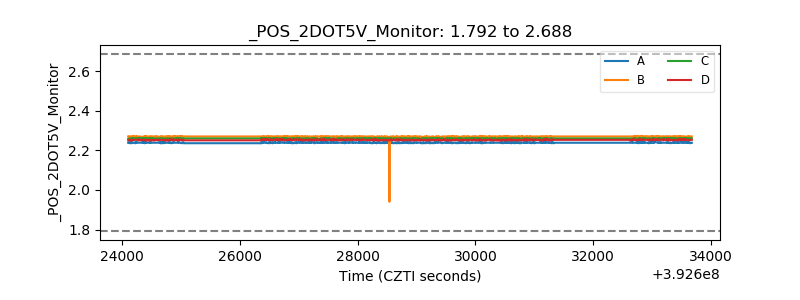 |
| +5 Volts monitor | 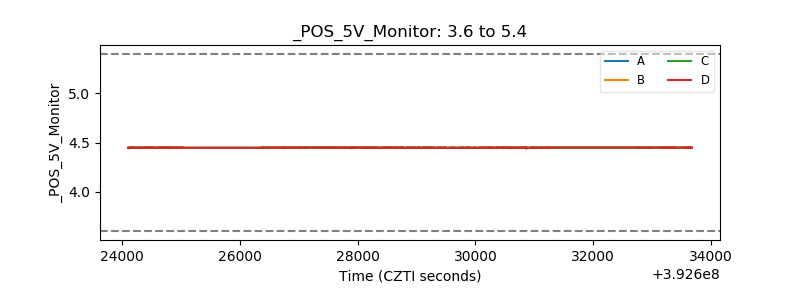 |
| _ROLL_ROT | 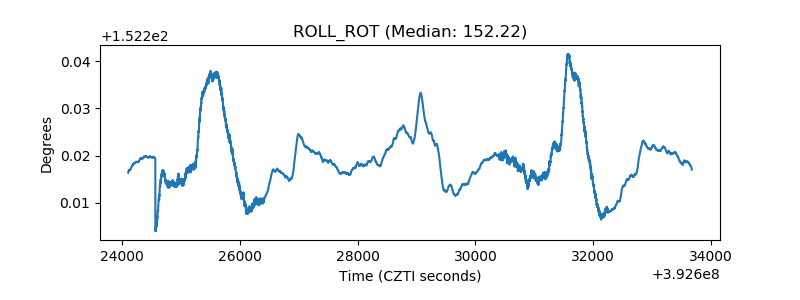 |
| _Roll_DEC | 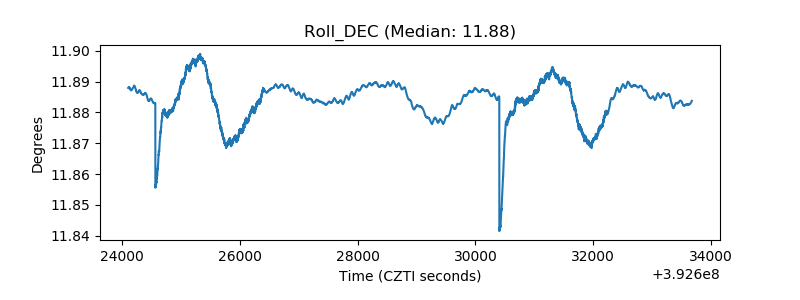 |
| _Roll_RA | 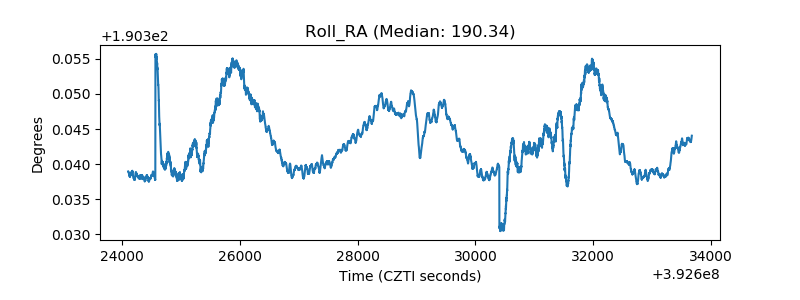 |
| Veto Counter | 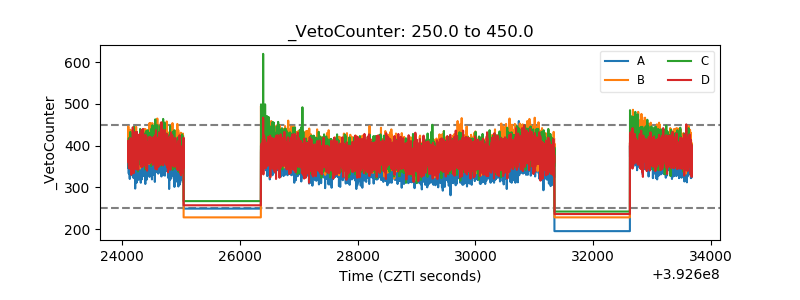 |