| Param | Original file | Final file |
|---|---|---|
| Filename | modeM0/AS1A10_071T34_9000005178_36237cztM0_level2.evt | modeM0/AS1A10_071T34_9000005178_36237cztM0_level2_quad_clean.evt |
| Size (bytes) | 624,585,600 | 86,120,640 |
| Size | 595.7 MB | 82.1 MB |
| Events in quadrant A | 3,363,900 | 556,412 |
| Events in quadrant B | 4,003,466 | 554,770 |
| Events in quadrant C | 3,634,876 | 552,085 |
| Events in quadrant D | 7,448,820 | 466,074 |
| Mode SS | |||
|---|---|---|---|
| Quadrant | BADHDUFLAG | Total packets | Discarded packets |
| A | 0 | 142 | 0 |
| B | 0 | 142 | 0 |
| C | 0 | 142 | 0 |
| D | 0 | 142 | 0 |
| Mode M9 | |||
|---|---|---|---|
| Quadrant | BADHDUFLAG | Total packets | Discarded packets |
| A | 0 | 27 | 0 |
| B | 0 | 27 | 0 |
| C | 0 | 27 | 0 |
| D | 0 | 27 | 0 |
| Mode M0 | |||
|---|---|---|---|
| Quadrant | BADHDUFLAG | Total packets | Discarded packets |
| A | 0 | 14141 | 3 |
| B | 0 | 16215 | 2 |
| C | 0 | 14685 | 2 |
| D | 0 | 26784 | 2 |
| Quadrant | Total seconds | Saturated seconds | Saturation percentage |
|---|---|---|---|
| A | 6859 | 12 | 0.174953% |
| B | 6859 | 147 | 2.143170% |
| C | 6859 | 38 | 0.554017% |
| D | 6859 | 1177 | 17.159936% |
Noise dominated data is calculated using 1-second bins in cleaned event files. If a bin has >2000 counts, and if more than 50% of those come from <1% of pixels, then it is considered to be noise-dominated and hence unusable.
| Quadrant | # 1 sec bins | Bins with >0 counts | Bins with >2000 counts | High rate bins dominated by noise | Noise dominated (total time) | Noise dominated (detector-on time) | Marked lightcurve |
|---|---|---|---|---|---|---|---|
| A | 9633 | 6861 | 4 | 4 | 0.04% | 0.06% | 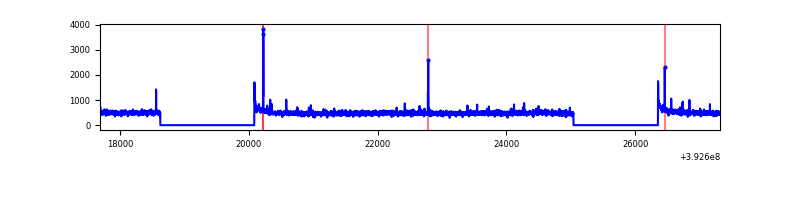 |
| B | 9633 | 6860 | 103 | 103 | 1.07% | 1.50% | 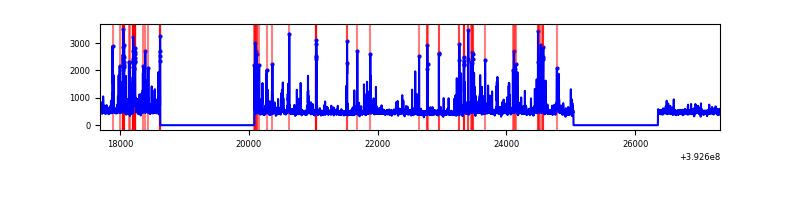 |
| C | 9633 | 6861 | 25 | 25 | 0.26% | 0.36% | 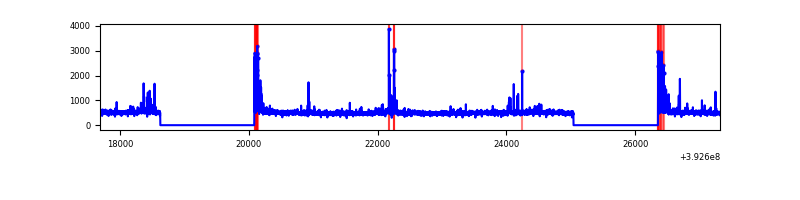 |
| D | 9633 | 6861 | 1136 | 1136 | 11.79% | 16.56% | 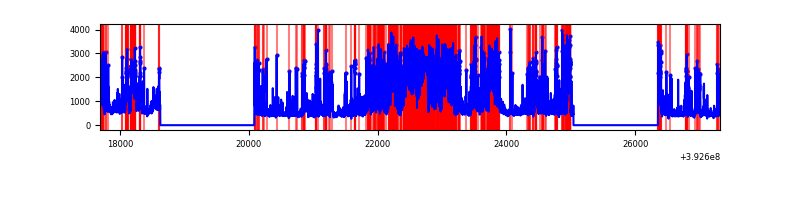 |
Top three noisy pixels from each quadrant. If the there are fewer than three noisy pixels in the level2.evt file, extra rows are filled as -1
| Pixel properties | Quadrant properties | ||||||
|---|---|---|---|---|---|---|---|
| Quadrant | DetID | PixID | Counts | Sigma | Mean | Median | Sigma |
| A | 10 | 83 | 205512 | 1254.85 | 804 | 787 | 163.1 |
| A | 9 | 143 | 20062 | 118.14 | 804 | 787 | 163.1 |
| A | 13 | 254 | 12031 | 68.92 | 804 | 787 | 163.1 |
| B | 5 | 172 | 331759 | 2156.43 | 795 | 774 | 153.5 |
| B | 5 | 236 | 279732 | 1817.46 | 795 | 774 | 153.5 |
| B | 5 | 200 | 49053 | 314.55 | 795 | 774 | 153.5 |
| C | 15 | 214 | 285544 | 1551.53 | 784 | 788 | 183.5 |
| C | 0 | 10 | 191335 | 1038.22 | 784 | 788 | 183.5 |
| C | 12 | 250 | 60827 | 327.13 | 784 | 788 | 183.5 |
| D | 12 | 227 | 3000170 | 16648.94 | 734 | 714 | 180.2 |
| D | 12 | 6 | 715570 | 3967.92 | 734 | 714 | 180.2 |
| D | 12 | 235 | 232598 | 1287.11 | 734 | 714 | 180.2 |
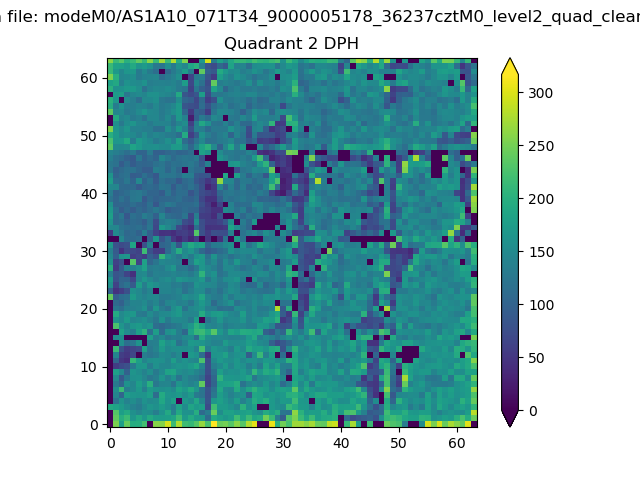
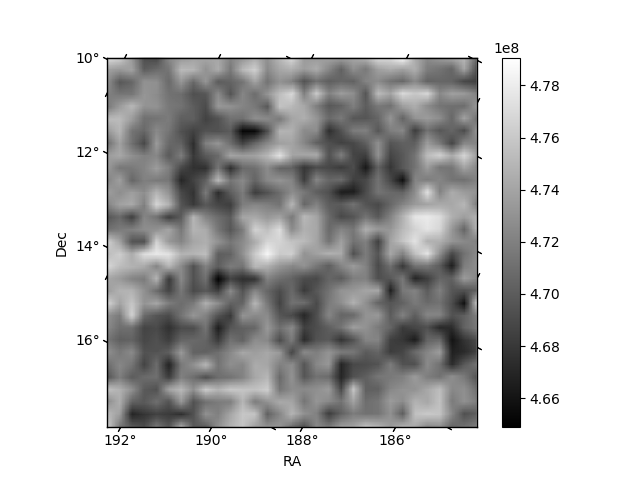
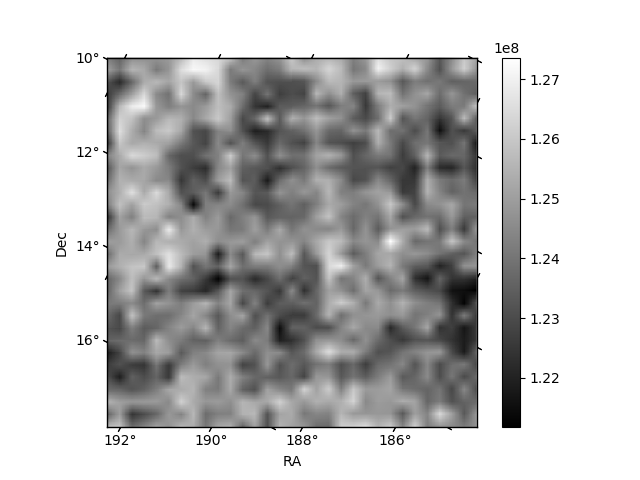
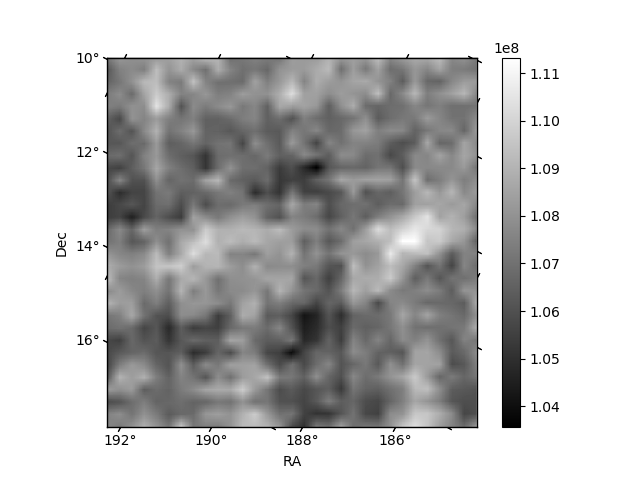
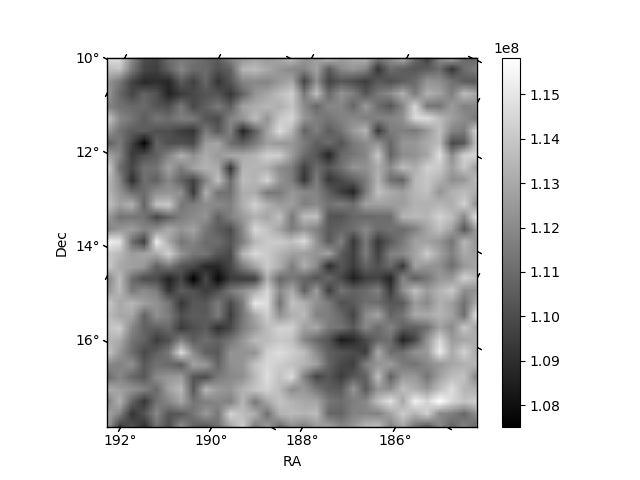
Histogram calculated using DETX and DETY for each event in the final _common_clean file
| Quadrant A | 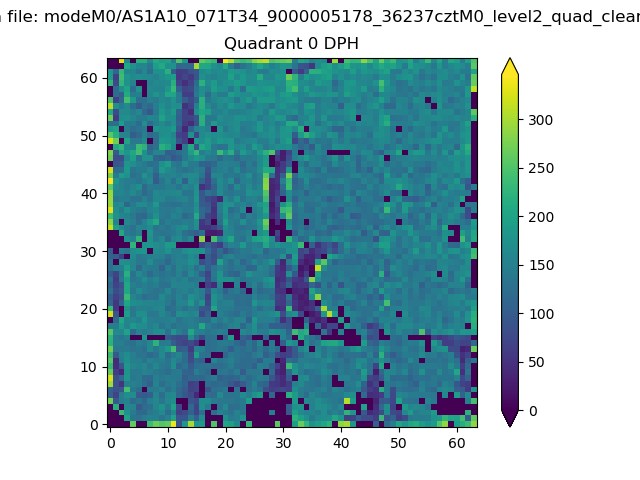 |
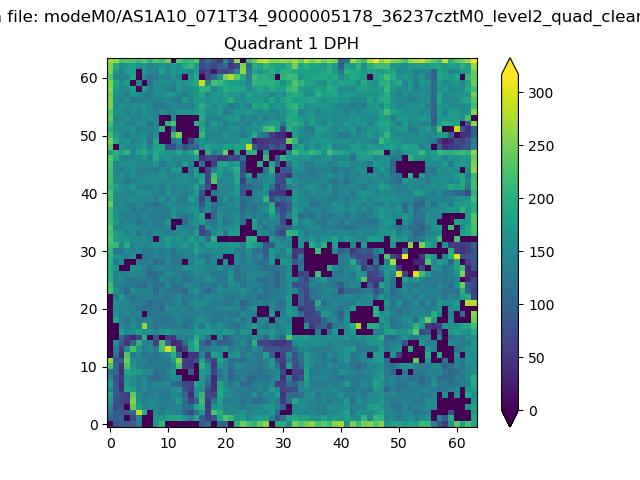 |
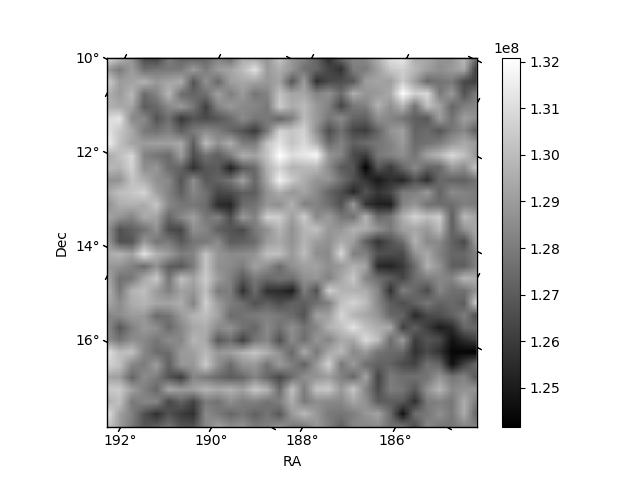
Quadrant B |
|---|---|---|---|
| Quadrant D | 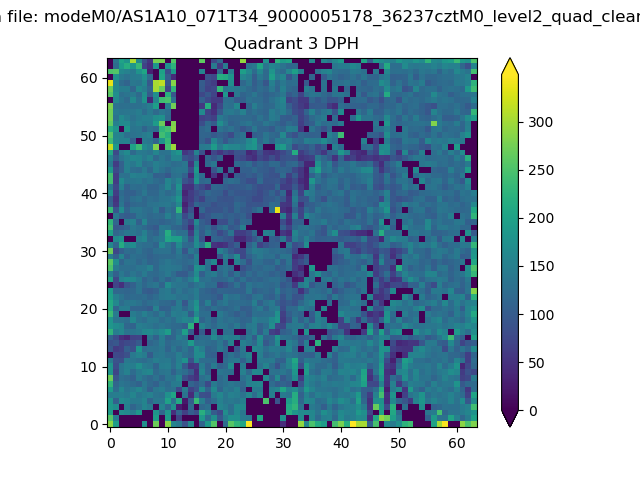 |
 |
Quadrant C |
| Plot type | Count rate plots | Images |
|---|---|---|
| Comparison with Poisson distribution Blue bars denote a histogram of data divided into 1 sec bins. Red curve is a Poisson curve with rate = median count rate of data. |
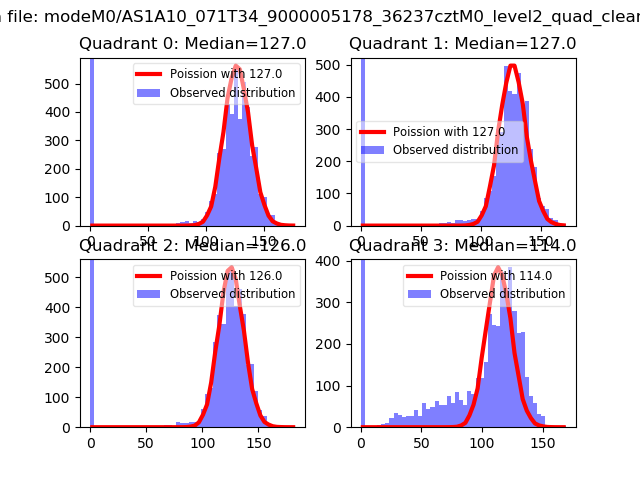 |
 |
| Quadrant-wise count rates Data is divided into 100 sec bins |
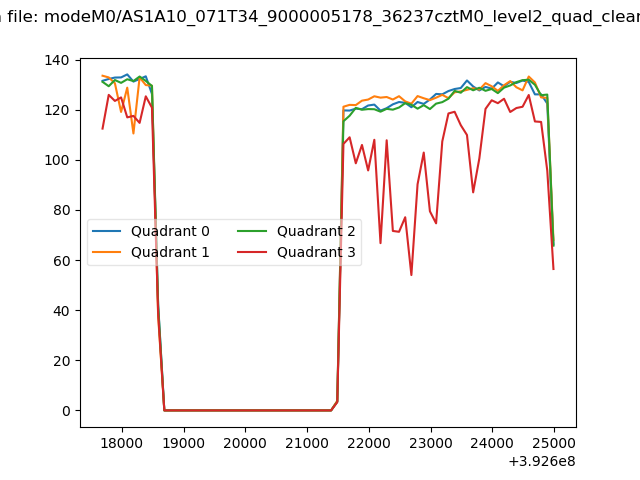 |
|
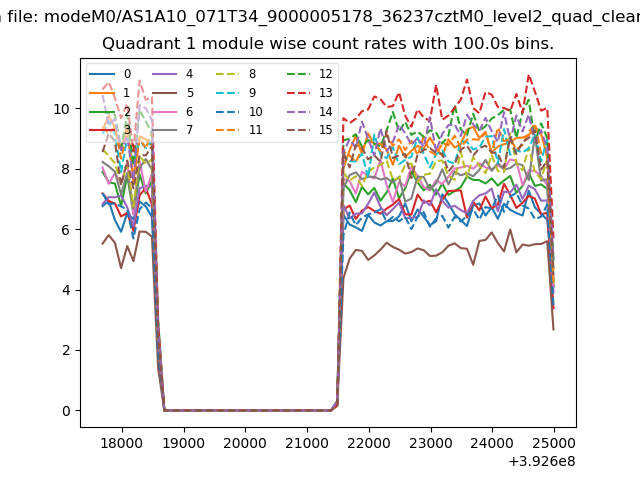
| Module-wise count rates for Quadrant A Data is divided into 100 sec bins |
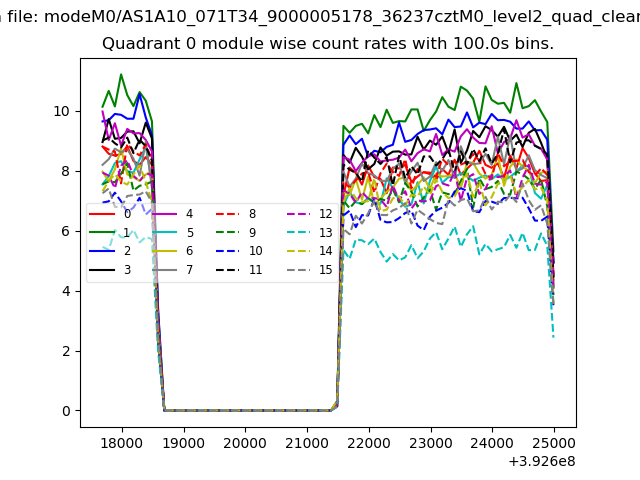 |
 |
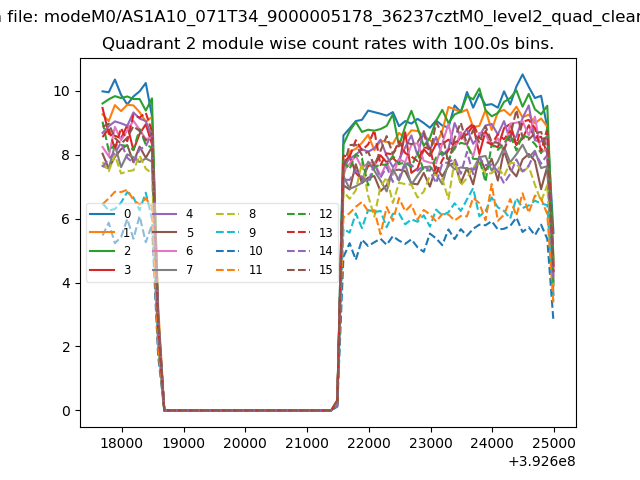
| Module-wise count rates for Quadrant B Data is divided into 100 sec bins |
 |
 |
| Module-wise count rates for Quadrant C Data is divided into 100 sec bins |
 |
 |
| Module-wise count rates for Quadrant D Data is divided into 100 sec bins |
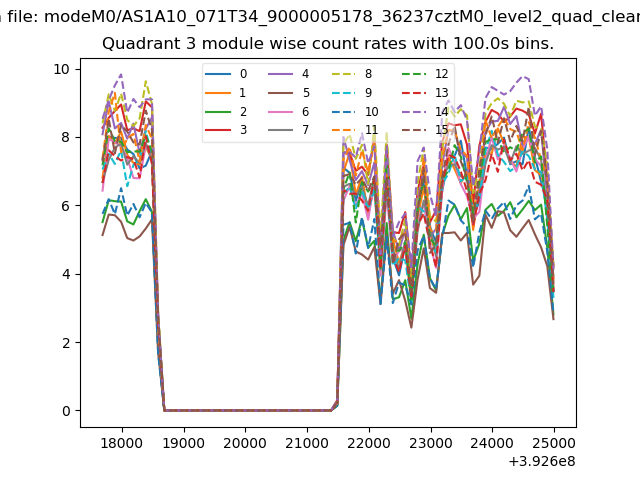 |
 |
| Parameter | Plot |
|---|---|
| CZT HV Monitor | 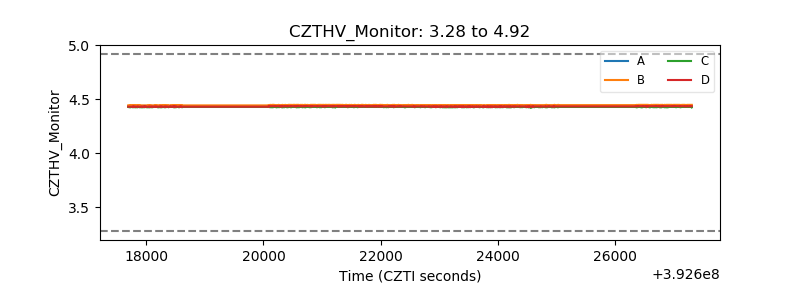 |
| D_VDD | 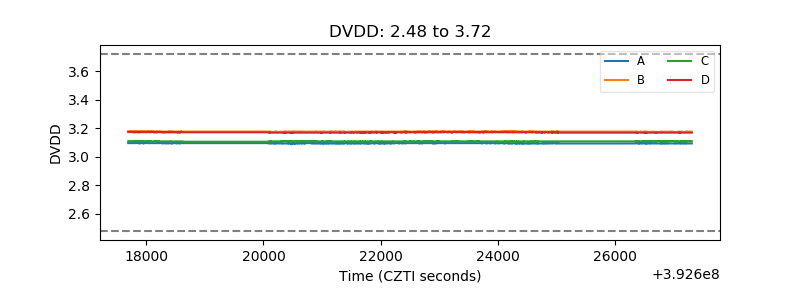 |
| Temperature 1 | 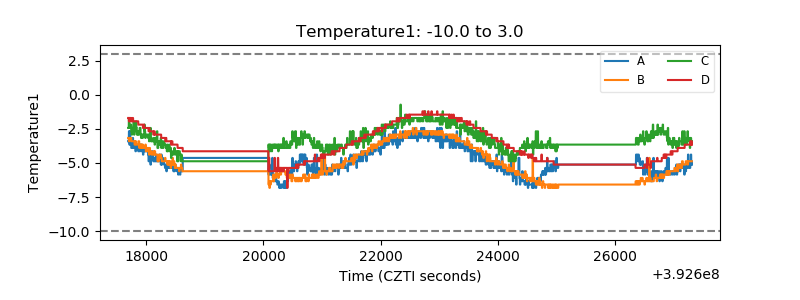 |
| Veto HV Monitor | 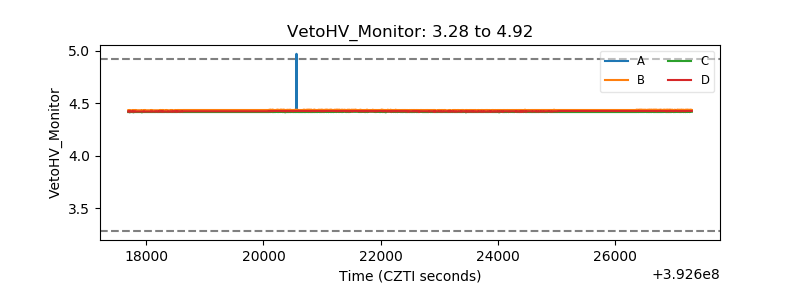 |
| Veto LLD | 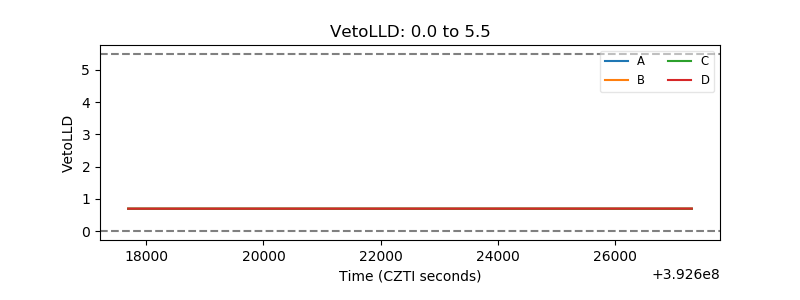 |
| Alpha Counter | 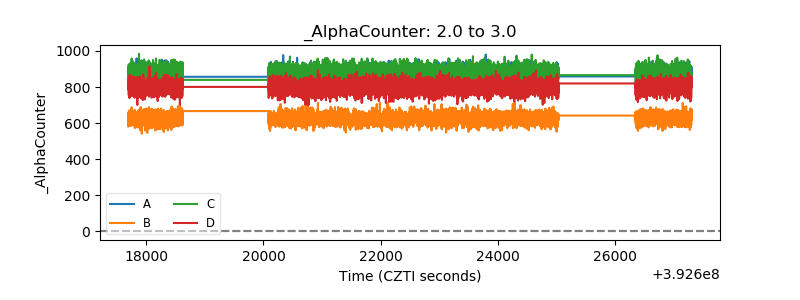 |
| _CPM_Rate | 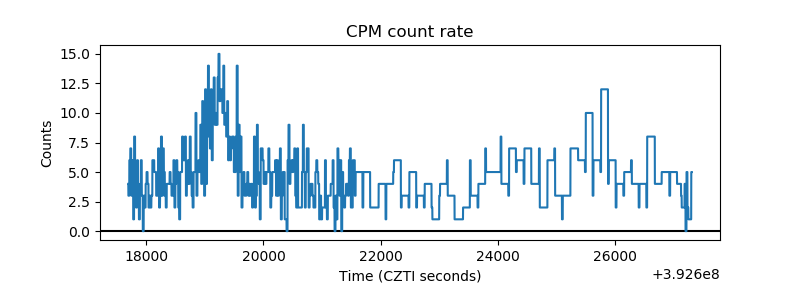 |
| CZT Counter | 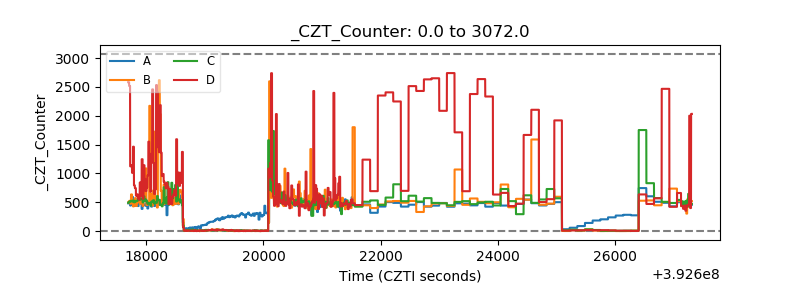 |
| +2.5 Volts monitor | 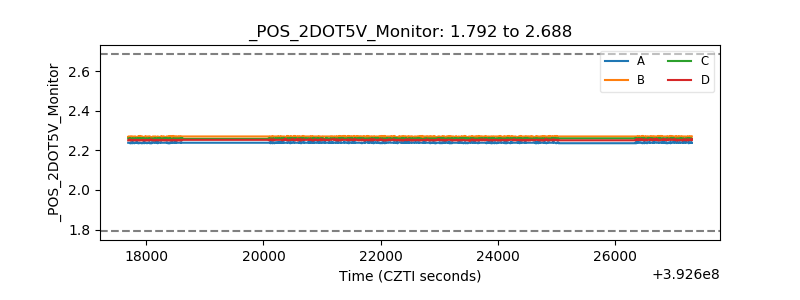 |
| +5 Volts monitor | 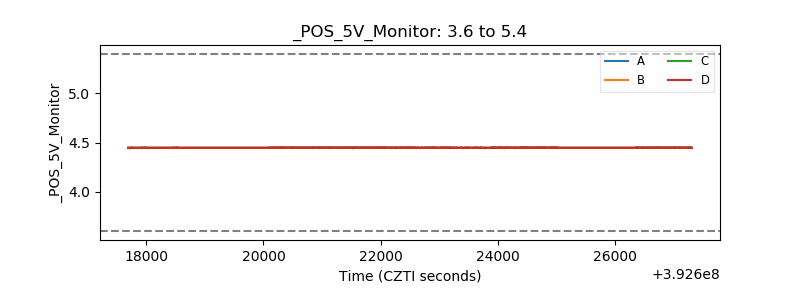 |
| _ROLL_ROT | 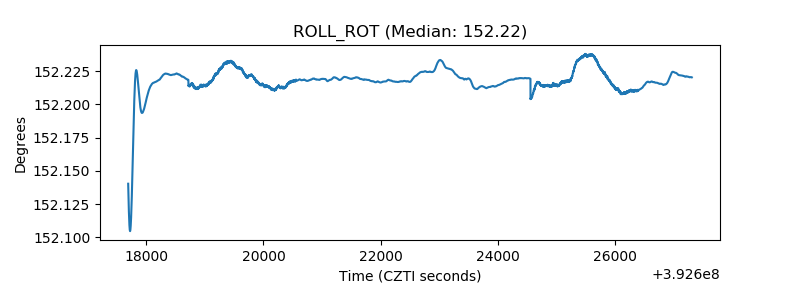 |
| _Roll_DEC | 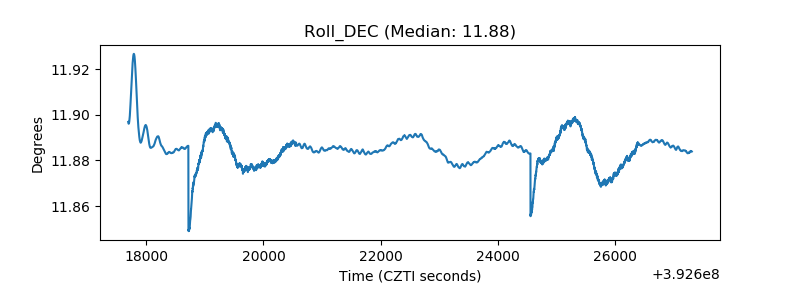 |
| _Roll_RA | 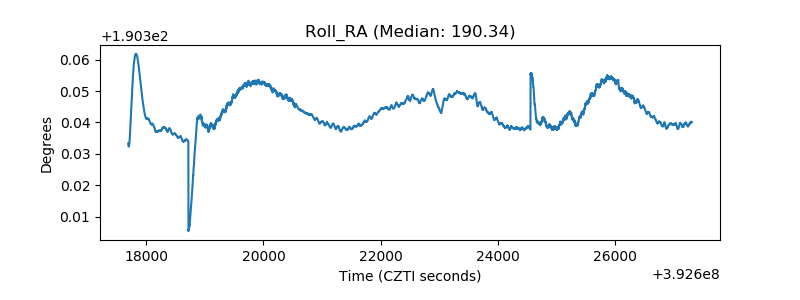 |
| Veto Counter | 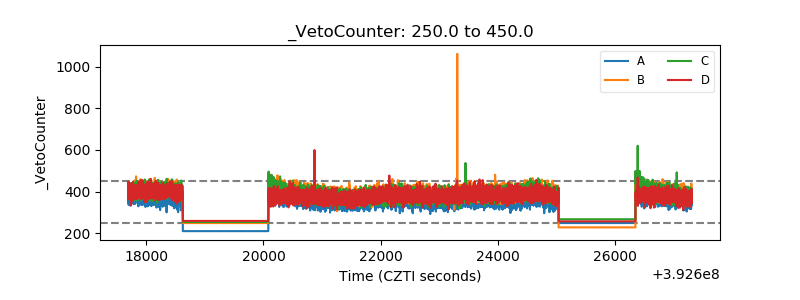 |