| Param | Original file | Final file |
|---|---|---|
| Filename | modeM0/AS1A10_071T34_9000005178_36236cztM0_level2.evt | modeM0/AS1A10_071T34_9000005178_36236cztM0_level2_quad_clean.evt |
| Size (bytes) | 198,792,000 | 27,308,160 |
| Size | 189.6 MB | 26.0 MB |
| Events in quadrant A | 1,070,513 | 176,306 |
| Events in quadrant B | 1,447,587 | 171,433 |
| Events in quadrant C | 1,184,026 | 175,045 |
| Events in quadrant D | 2,173,572 | 151,151 |
| Mode SS | |||
|---|---|---|---|
| Quadrant | BADHDUFLAG | Total packets | Discarded packets |
| A | 0 | 46 | 0 |
| B | 0 | 46 | 0 |
| C | 0 | 46 | 0 |
| D | 0 | 46 | 0 |
| Mode M9 | |||
|---|---|---|---|
| Quadrant | BADHDUFLAG | Total packets | Discarded packets |
| A | 0 | 14 | 0 |
| B | 0 | 14 | 0 |
| C | 0 | 14 | 0 |
| D | 0 | 14 | 0 |
| Mode M0 | |||
|---|---|---|---|
| Quadrant | BADHDUFLAG | Total packets | Discarded packets |
| A | 0 | 4397 | 2 |
| B | 0 | 5621 | 1 |
| C | 0 | 4662 | 1 |
| D | 0 | 7889 | 1 |
| Quadrant | Total seconds | Saturated seconds | Saturation percentage |
|---|---|---|---|
| A | 2095 | 8 | 0.381862% |
| B | 2095 | 100 | 4.773270% |
| C | 2095 | 17 | 0.811456% |
| D | 2095 | 268 | 12.792363% |
Noise dominated data is calculated using 1-second bins in cleaned event files. If a bin has >2000 counts, and if more than 50% of those come from <1% of pixels, then it is considered to be noise-dominated and hence unusable.
| Quadrant | # 1 sec bins | Bins with >0 counts | Bins with >2000 counts | High rate bins dominated by noise | Noise dominated (total time) | Noise dominated (detector-on time) | Marked lightcurve |
|---|---|---|---|---|---|---|---|
| A | 3556 | 2096 | 2 | 2 | 0.06% | 0.10% |  |
| B | 3556 | 2095 | 67 | 67 | 1.88% | 3.20% |  |
| C | 3556 | 2096 | 12 | 12 | 0.34% | 0.57% |  |
| D | 3556 | 2096 | 279 | 279 | 7.85% | 13.31% |  |
Top three noisy pixels from each quadrant. If the there are fewer than three noisy pixels in the level2.evt file, extra rows are filled as -1
| Pixel properties | Quadrant properties | ||||||
|---|---|---|---|---|---|---|---|
| Quadrant | DetID | PixID | Counts | Sigma | Mean | Median | Sigma |
| A | 10 | 83 | 84927 | 1613.58 | 249 | 243 | 52.5 |
| A | 10 | 248 | 9470 | 175.81 | 249 | 243 | 52.5 |
| A | 13 | 6 | 5530 | 100.74 | 249 | 243 | 52.5 |
| B | 5 | 172 | 175774 | 3602.6 | 245 | 238 | 48.7 |
| B | 5 | 236 | 156544 | 3207.93 | 245 | 238 | 48.7 |
| B | 5 | 255 | 37230 | 759.2 | 245 | 238 | 48.7 |
| C | 15 | 214 | 91452 | 1551.94 | 244 | 245 | 58.8 |
| C | 0 | 10 | 90529 | 1536.24 | 244 | 245 | 58.8 |
| C | 12 | 250 | 43728 | 739.89 | 244 | 245 | 58.8 |
| D | 12 | 227 | 966894 | 16381.95 | 232 | 224 | 59.0 |
| D | 12 | 235 | 124662 | 2108.82 | 232 | 224 | 59.0 |
| D | 13 | 171 | 65370 | 1104.02 | 232 | 224 | 59.0 |
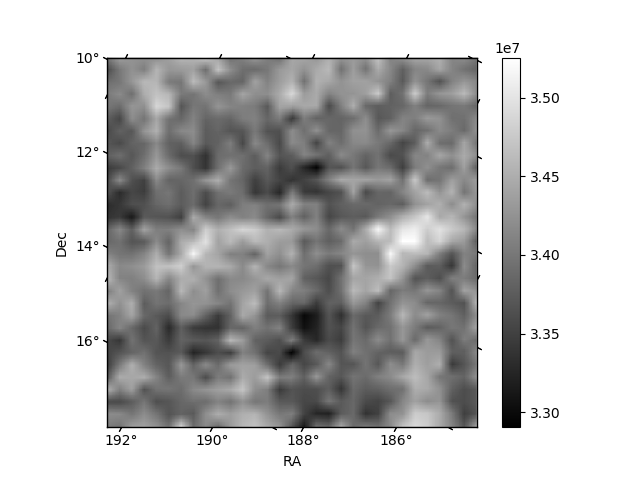
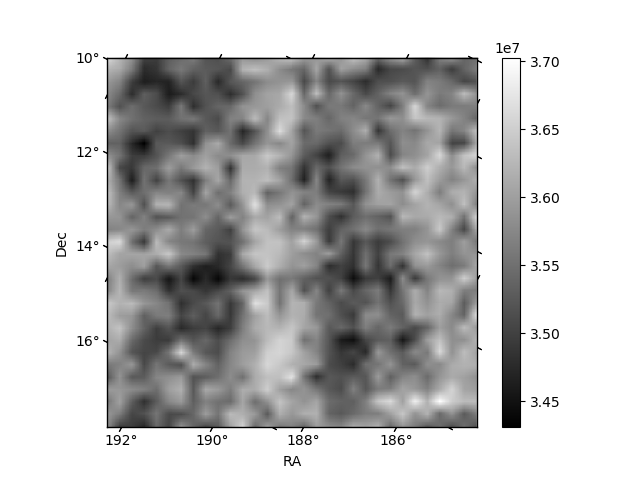
Histogram calculated using DETX and DETY for each event in the final _common_clean file
| Quadrant A |  |
 |
Quadrant B |
|---|---|---|---|
| Quadrant D |  |
 |
Quadrant C |
| Plot type | Count rate plots | Images |
|---|---|---|
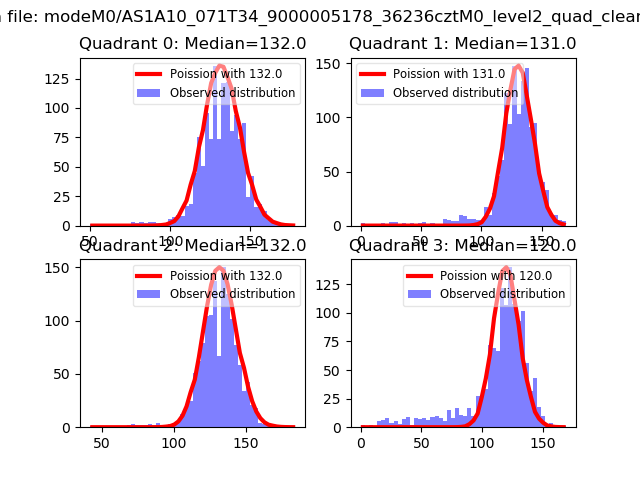
| Comparison with Poisson distribution Blue bars denote a histogram of data divided into 1 sec bins. Red curve is a Poisson curve with rate = median count rate of data. |
 |
 |
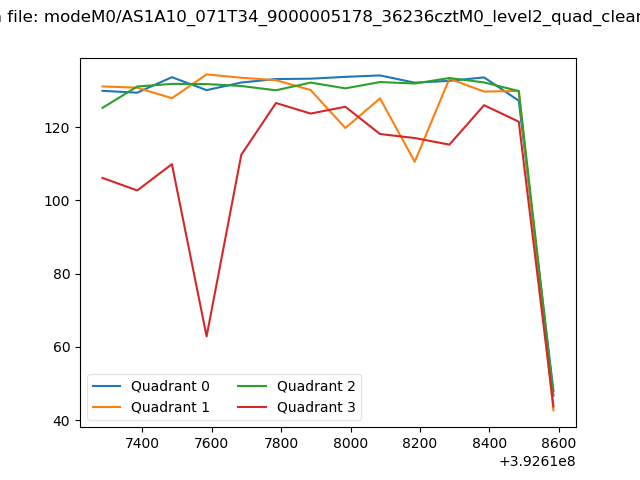
| Quadrant-wise count rates Data is divided into 100 sec bins |
 |
|
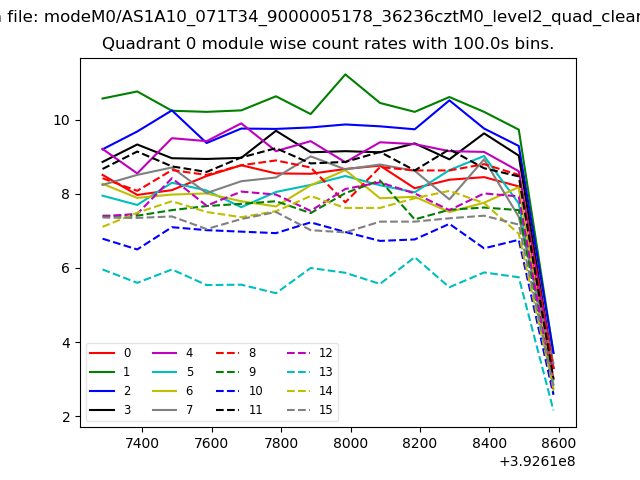
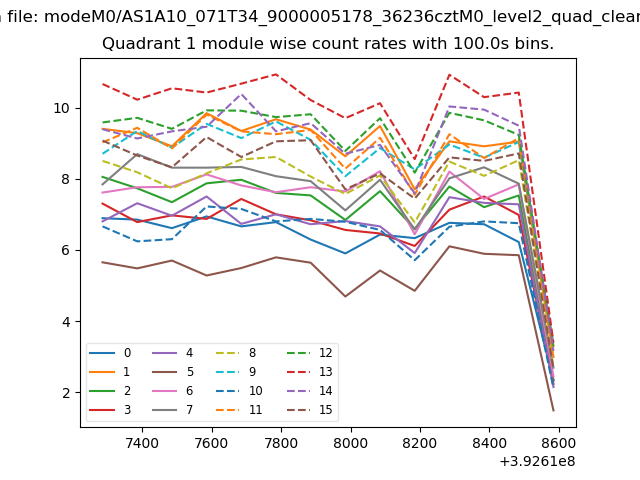
| Module-wise count rates for Quadrant A Data is divided into 100 sec bins |
 |
 |
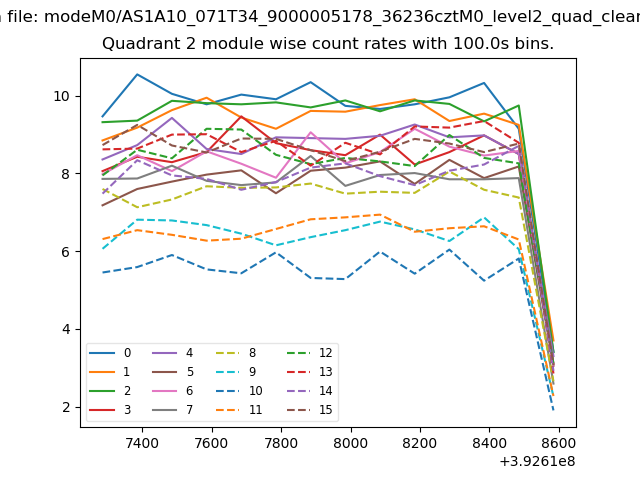
| Module-wise count rates for Quadrant B Data is divided into 100 sec bins |
 |
 |
| Module-wise count rates for Quadrant C Data is divided into 100 sec bins |
 |
 |
| Module-wise count rates for Quadrant D Data is divided into 100 sec bins |
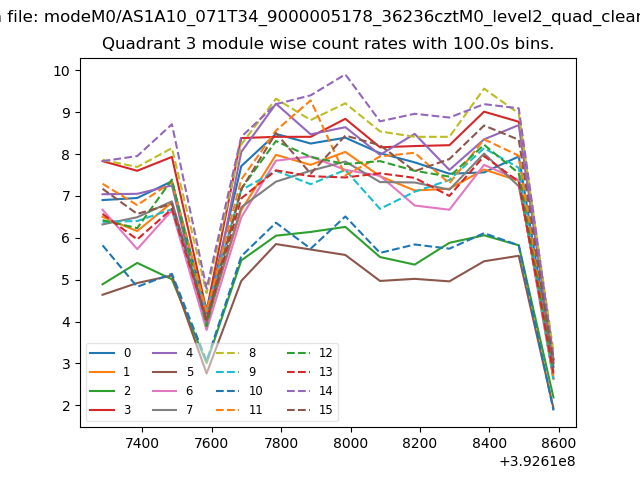 |
 |
| Parameter | Plot |
|---|---|
| CZT HV Monitor | 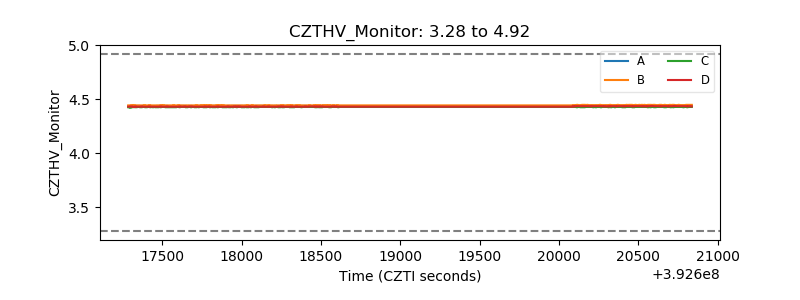 |
| D_VDD | 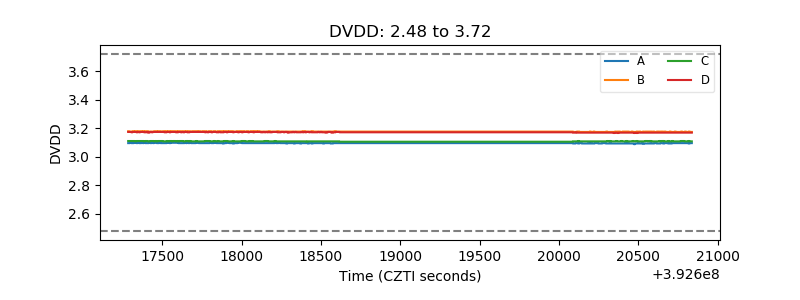 |
| Temperature 1 | 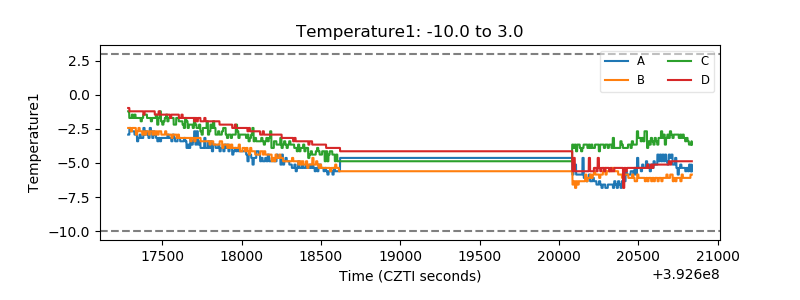 |
| Veto HV Monitor | 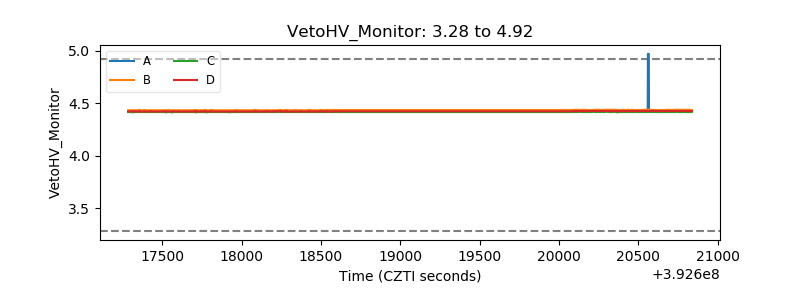 |
| Veto LLD | 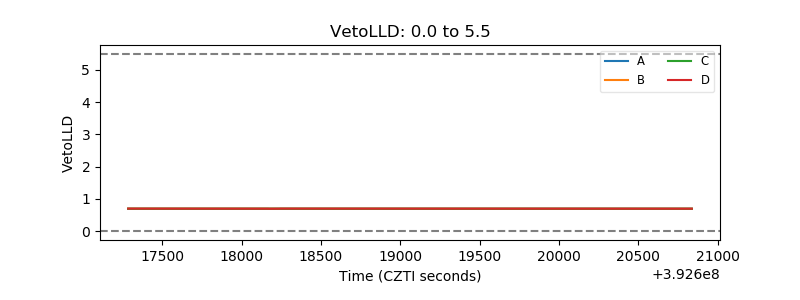 |
| Alpha Counter | 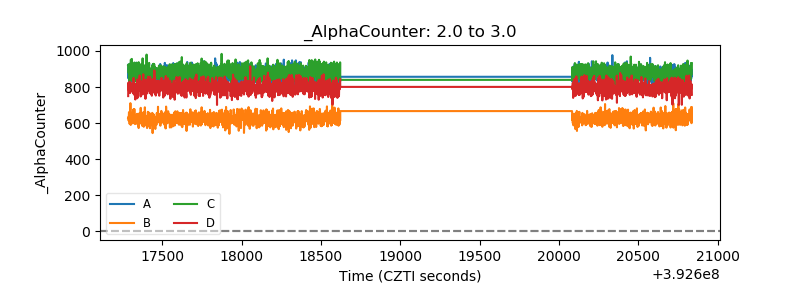 |
| _CPM_Rate | 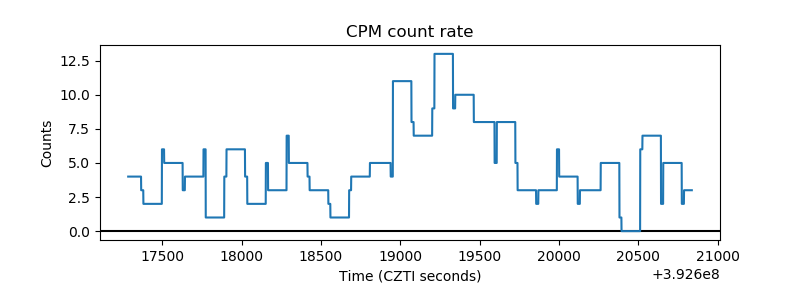 |
| CZT Counter | 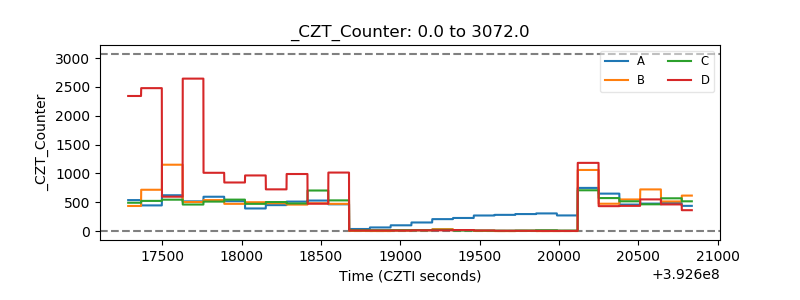 |
| +2.5 Volts monitor | 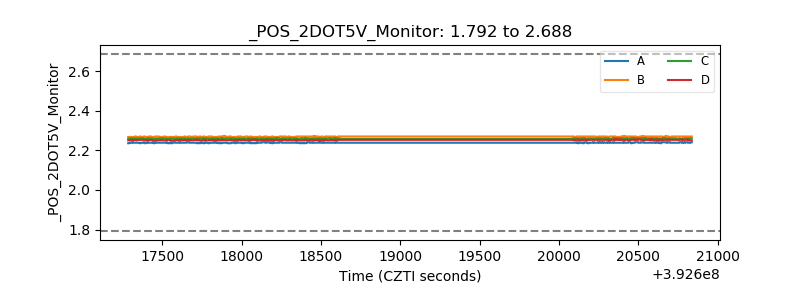 |
| +5 Volts monitor | 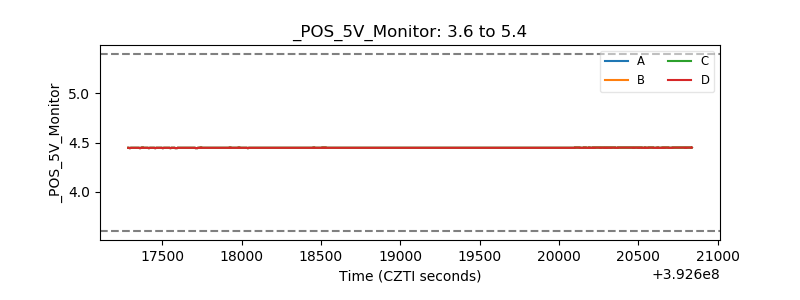 |
| _ROLL_ROT | 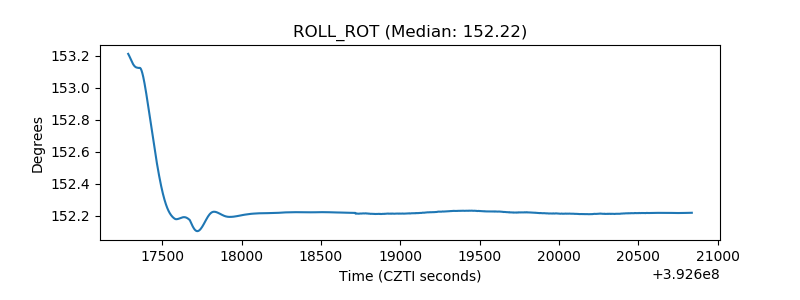 |
| _Roll_DEC | 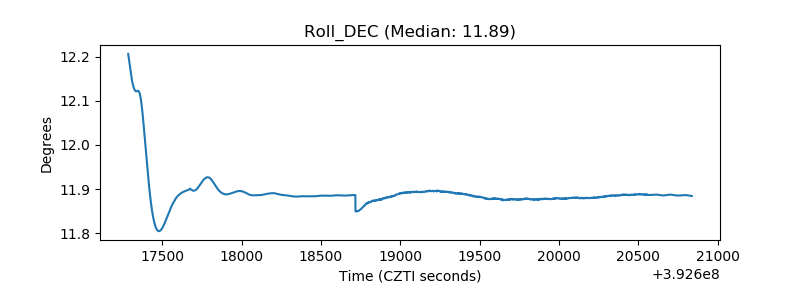 |
| _Roll_RA | 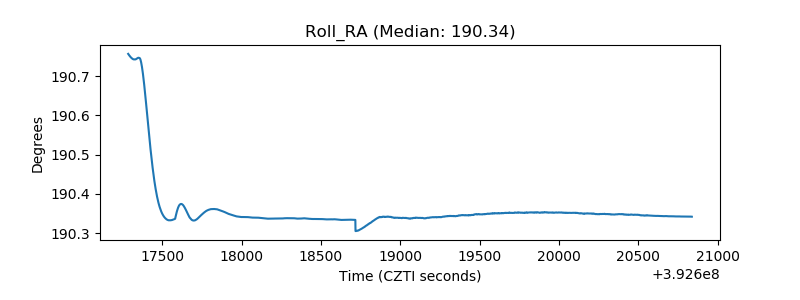 |
| Veto Counter | 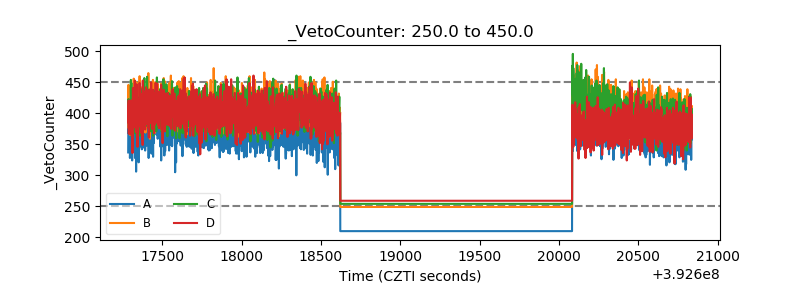 |