| Param | Original file | Final file |
|---|---|---|
| Filename | modeM0/AS1A11_080T02_9000005176_36236cztM0_level2.evt | modeM0/AS1A11_080T02_9000005176_36236cztM0_level2_quad_clean.evt |
| Size (bytes) | 297,118,080 | 33,932,160 |
| Size | 283.4 MB | 32.4 MB |
| Events in quadrant A | 1,543,614 | 204,346 |
| Events in quadrant B | 3,443,586 | 197,722 |
| Events in quadrant C | 1,648,994 | 202,213 |
| Events in quadrant D | 2,139,059 | 190,879 |
| Mode M9 | |||
|---|---|---|---|
| Quadrant | BADHDUFLAG | Total packets | Discarded packets |
| A | 0 | 17 | 0 |
| B | 0 | 17 | 0 |
| C | 0 | 17 | 0 |
| D | 0 | 17 | 0 |
| Mode M0 | |||
|---|---|---|---|
| Quadrant | BADHDUFLAG | Total packets | Discarded packets |
| A | 0 | 6662 | 1 |
| B | 0 | 12406 | 1 |
| C | 0 | 6853 | 1 |
| D | 0 | 8590 | 1 |
| Mode SS | |||
|---|---|---|---|
| Quadrant | BADHDUFLAG | Total packets | Discarded packets |
| A | 0 | 68 | 0 |
| B | 0 | 68 | 0 |
| C | 0 | 68 | 0 |
| D | 0 | 68 | 0 |
| Quadrant | Total seconds | Saturated seconds | Saturation percentage |
|---|---|---|---|
| A | 3259 | 4 | 0.122737% |
| B | 3259 | 722 | 22.154035% |
| C | 3259 | 25 | 0.767106% |
| D | 3259 | 127 | 3.896901% |
Noise dominated data is calculated using 1-second bins in cleaned event files. If a bin has >2000 counts, and if more than 50% of those come from <1% of pixels, then it is considered to be noise-dominated and hence unusable.
| Quadrant | # 1 sec bins | Bins with >0 counts | Bins with >2000 counts | High rate bins dominated by noise | Noise dominated (total time) | Noise dominated (detector-on time) | Marked lightcurve |
|---|---|---|---|---|---|---|---|
| A | 5052 | 3260 | 0 | 0 | 0.00% | 0.00% | 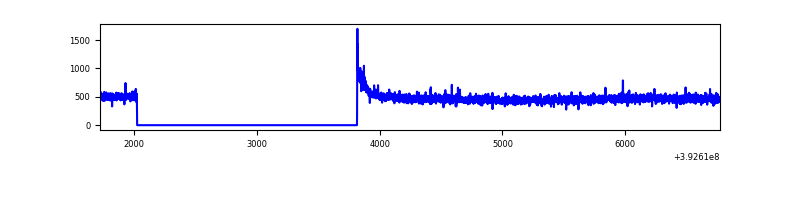 |
| B | 5052 | 3260 | 520 | 520 | 10.29% | 15.95% | 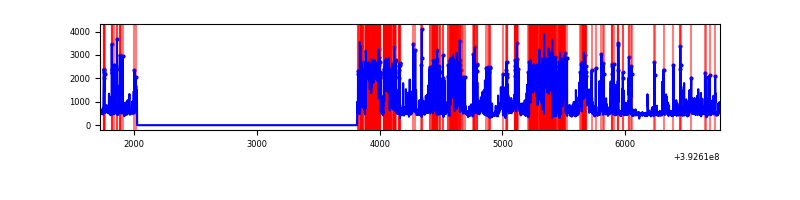 |
| C | 5052 | 3260 | 15 | 15 | 0.30% | 0.46% | 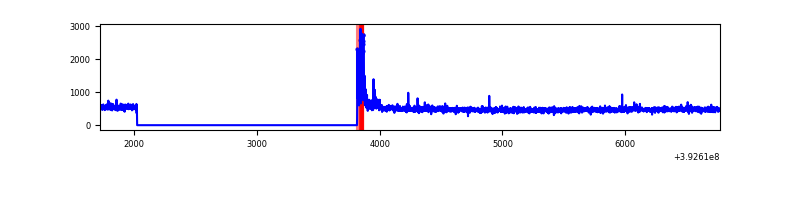 |
| D | 5052 | 3260 | 102 | 102 | 2.02% | 3.13% | 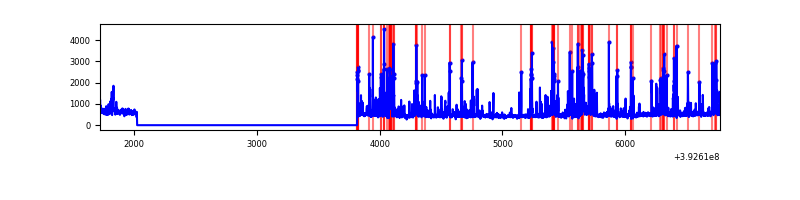 |
Top three noisy pixels from each quadrant. If the there are fewer than three noisy pixels in the level2.evt file, extra rows are filled as -1
| Pixel properties | Quadrant properties | ||||||
|---|---|---|---|---|---|---|---|
| Quadrant | DetID | PixID | Counts | Sigma | Mean | Median | Sigma |
| A | 10 | 83 | 98608 | 1294.23 | 371 | 362 | 75.9 |
| A | 13 | 254 | 5510 | 67.82 | 371 | 362 | 75.9 |
| A | 9 | 143 | 4588 | 55.67 | 371 | 362 | 75.9 |
| B | 5 | 236 | 1762590 | 26493.59 | 336 | 328 | 66.5 |
| B | 5 | 172 | 230360 | 3458.27 | 336 | 328 | 66.5 |
| B | 0 | 189 | 38673 | 576.47 | 336 | 328 | 66.5 |
| C | 15 | 214 | 137305 | 1607.77 | 359 | 360 | 85.2 |
| C | 0 | 10 | 102889 | 1203.71 | 359 | 360 | 85.2 |
| C | 15 | 208 | 5380 | 58.94 | 359 | 360 | 85.2 |
| D | 12 | 6 | 312549 | 3546.15 | 353 | 343 | 88.0 |
| D | 13 | 249 | 126497 | 1432.9 | 353 | 343 | 88.0 |
| D | 13 | 171 | 75765 | 856.67 | 353 | 343 | 88.0 |
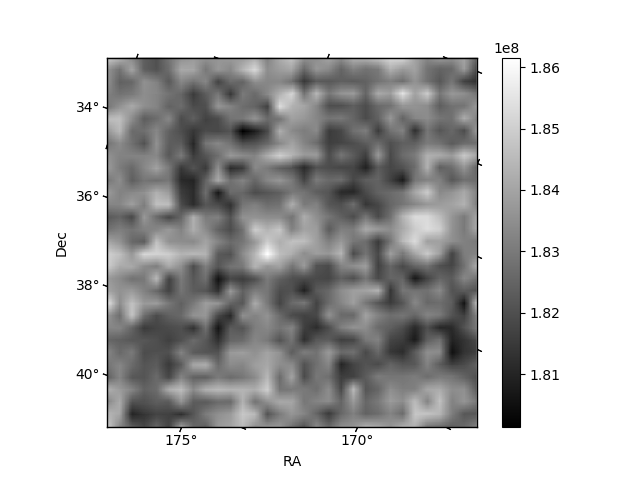
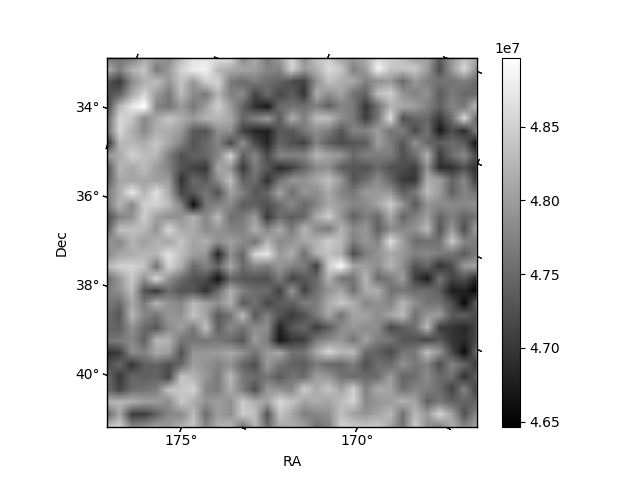
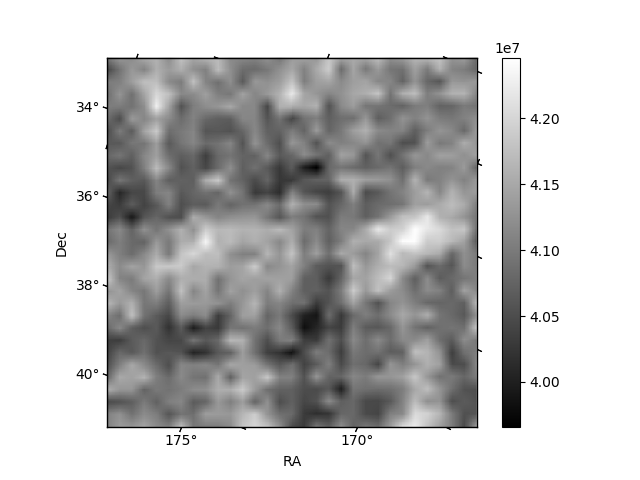
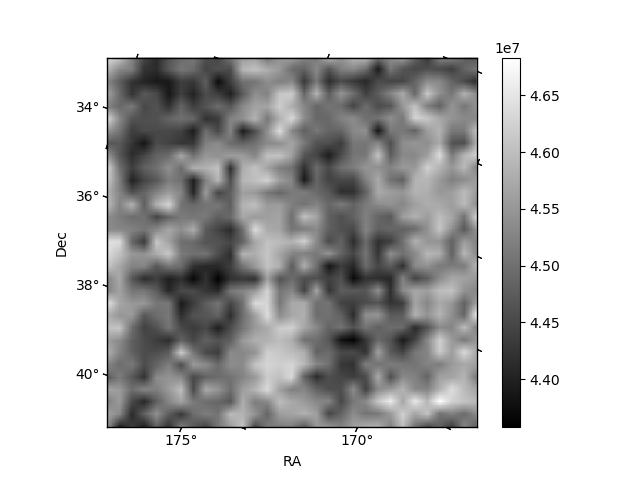
Histogram calculated using DETX and DETY for each event in the final _common_clean file
| Quadrant A | 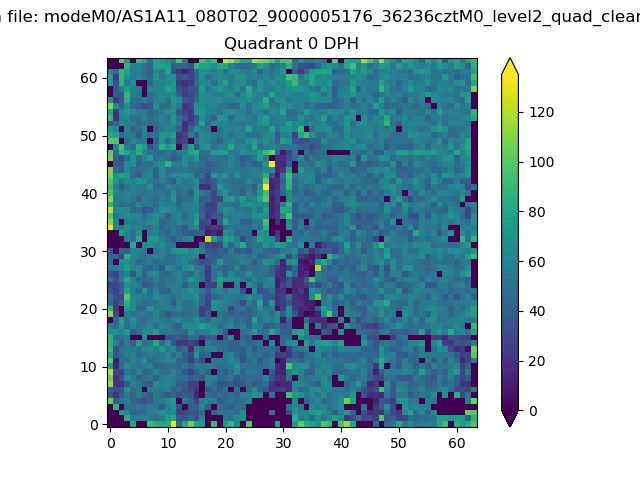 |
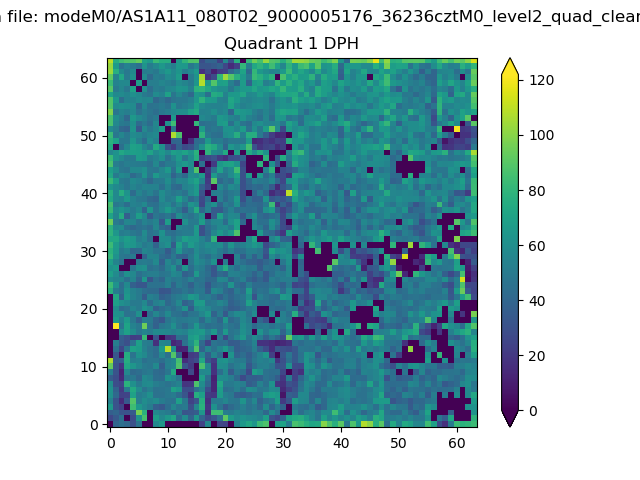 |
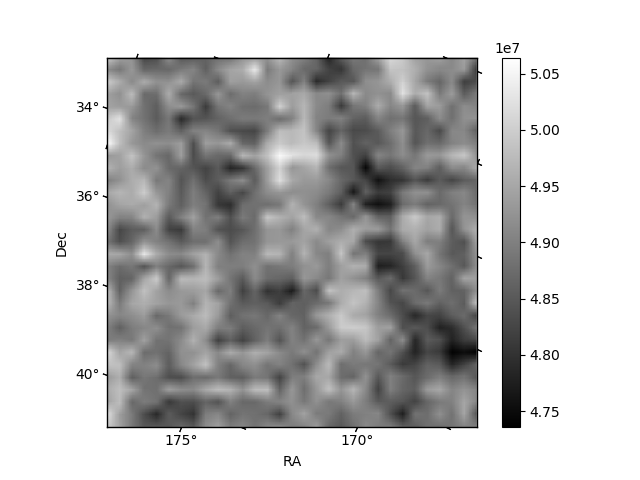
Quadrant B |
|---|---|---|---|
| Quadrant D | 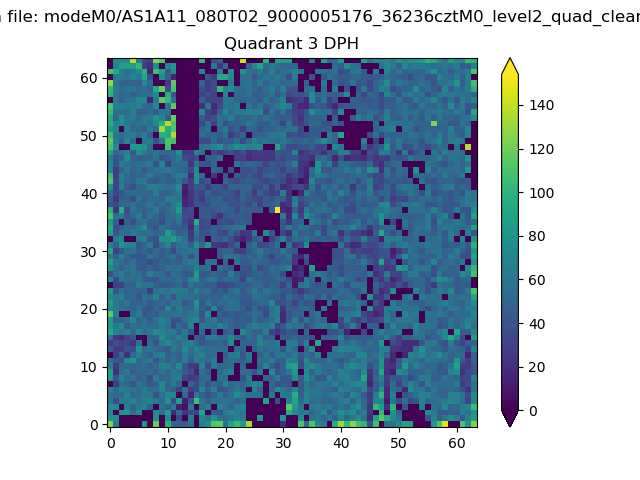 |
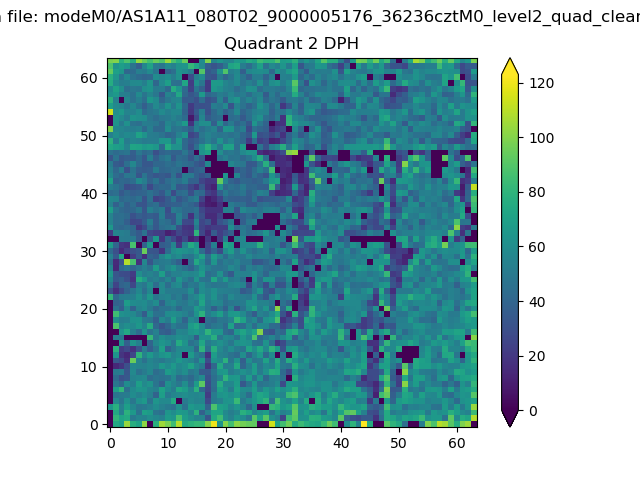 |
Quadrant C |
| Plot type | Count rate plots | Images |
|---|---|---|
| Comparison with Poisson distribution Blue bars denote a histogram of data divided into 1 sec bins. Red curve is a Poisson curve with rate = median count rate of data. |
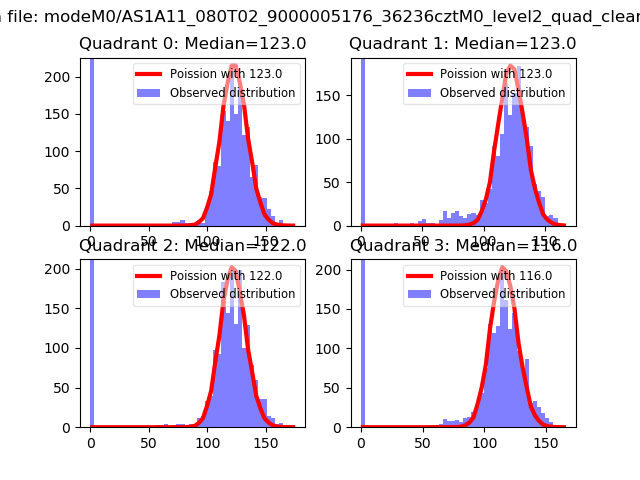 |
 |
| Quadrant-wise count rates Data is divided into 100 sec bins |
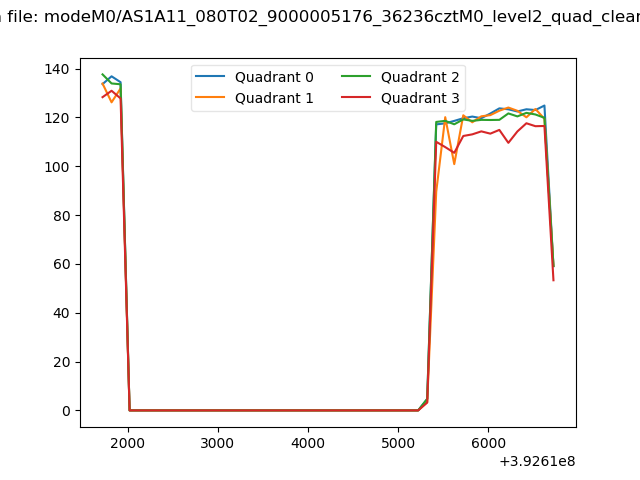 |
|
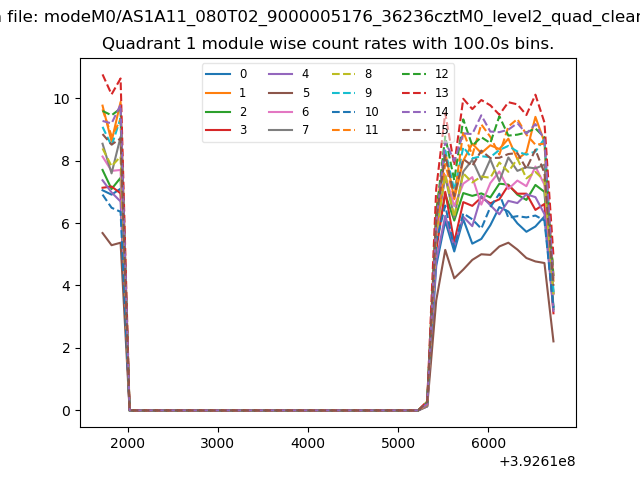
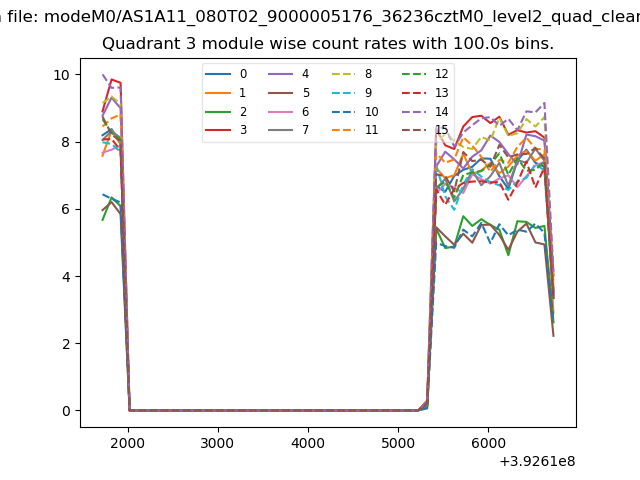
| Module-wise count rates for Quadrant A Data is divided into 100 sec bins |
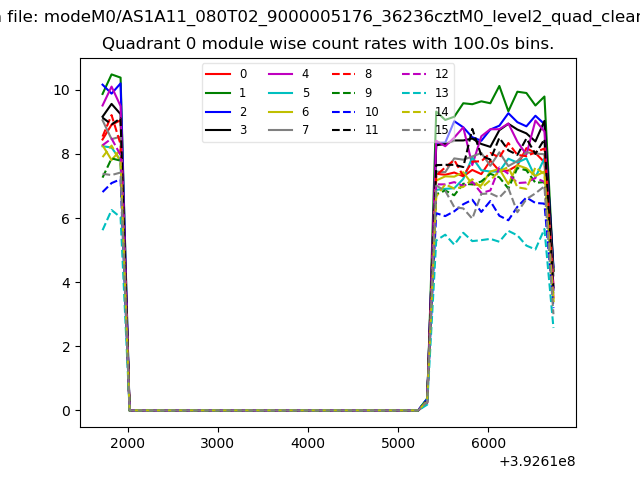 |
 |
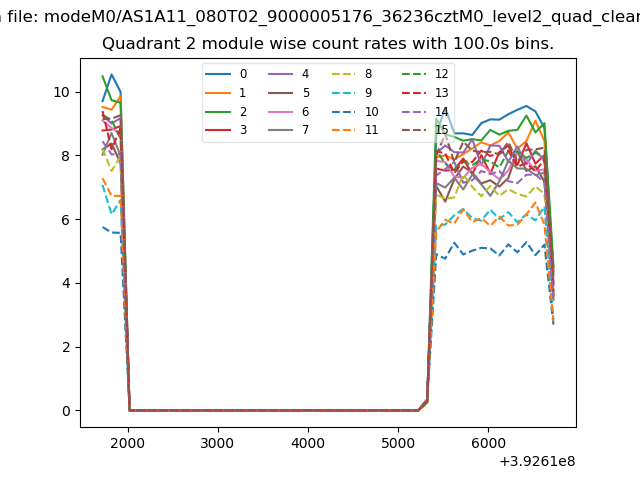
| Module-wise count rates for Quadrant B Data is divided into 100 sec bins |
 |
 |
| Module-wise count rates for Quadrant C Data is divided into 100 sec bins |
 |
 |
| Module-wise count rates for Quadrant D Data is divided into 100 sec bins |
 |
 |
| Parameter | Plot |
|---|---|
| CZT HV Monitor | 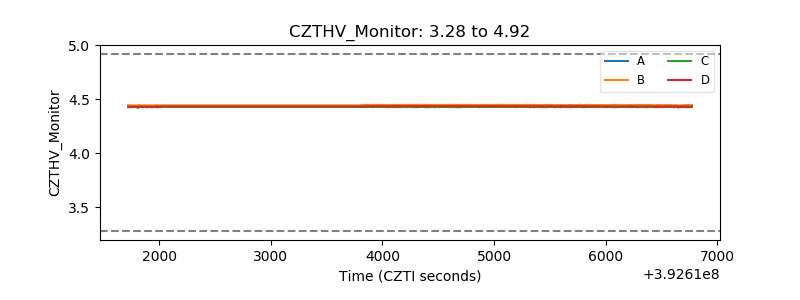 |
| D_VDD | 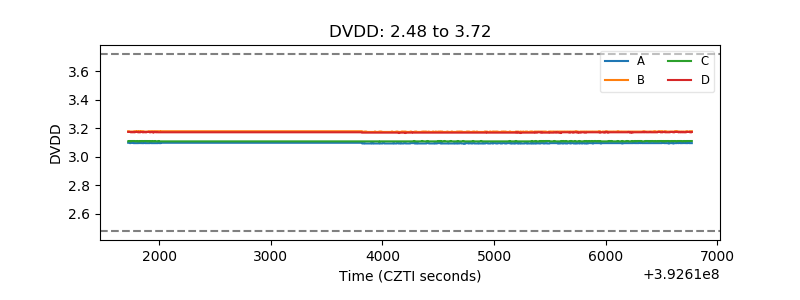 |
| Temperature 1 | 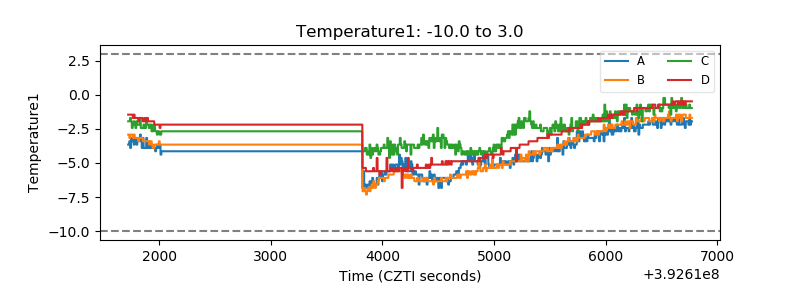 |
| Veto HV Monitor | 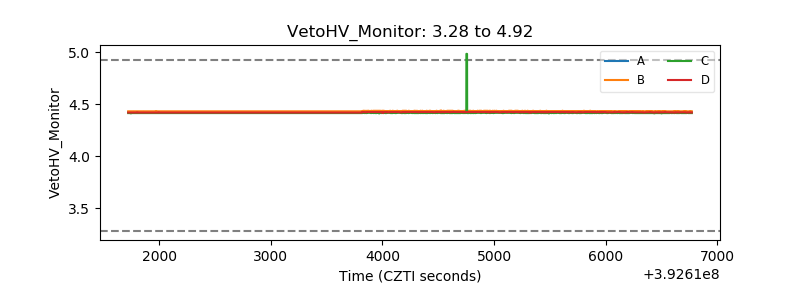 |
| Veto LLD | 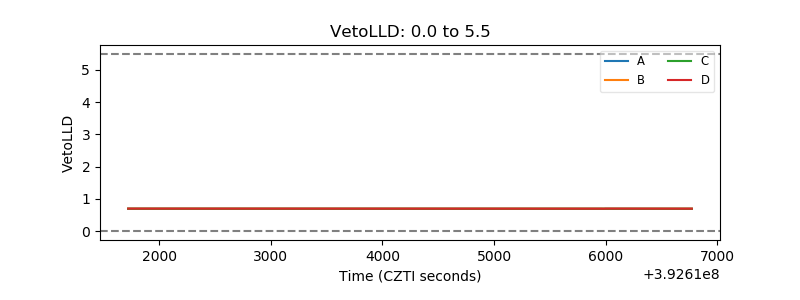 |
| Alpha Counter | 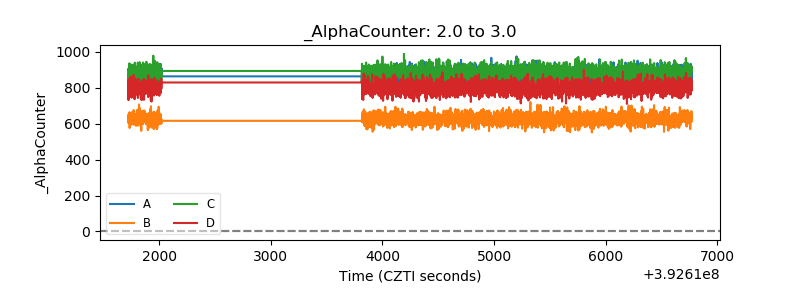 |
| _CPM_Rate | 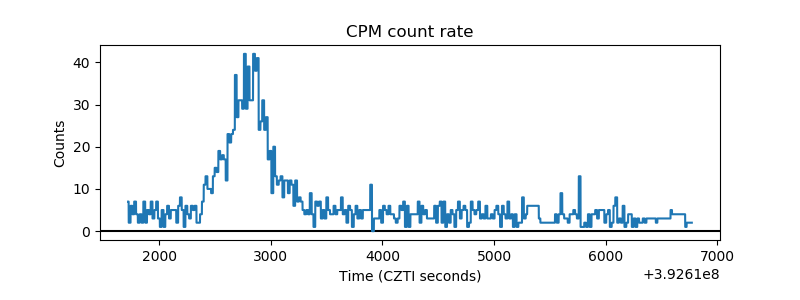 |
| CZT Counter | 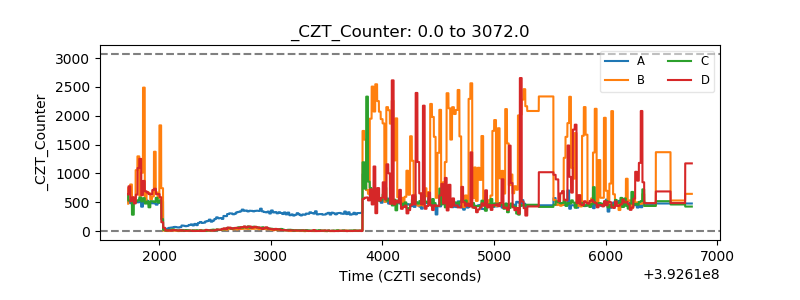 |
| +2.5 Volts monitor |  |
| +5 Volts monitor | 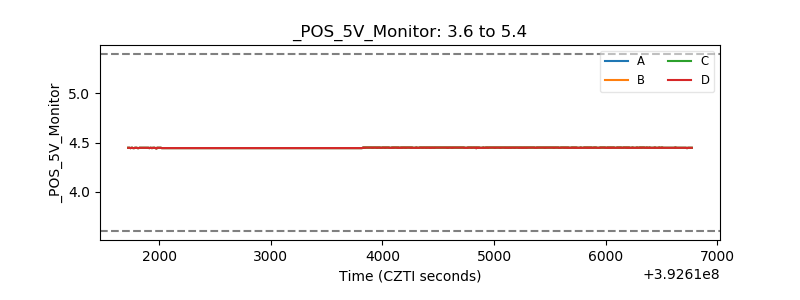 |
| _ROLL_ROT | 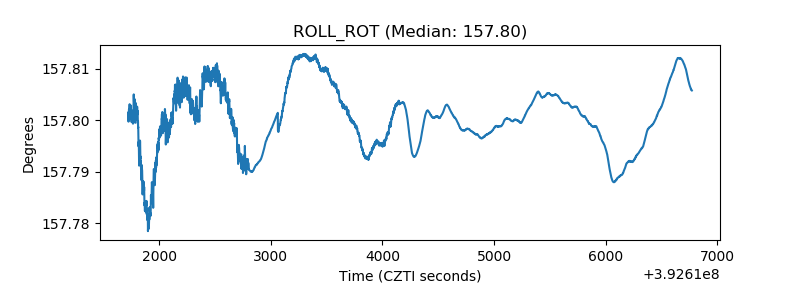 |
| _Roll_DEC | 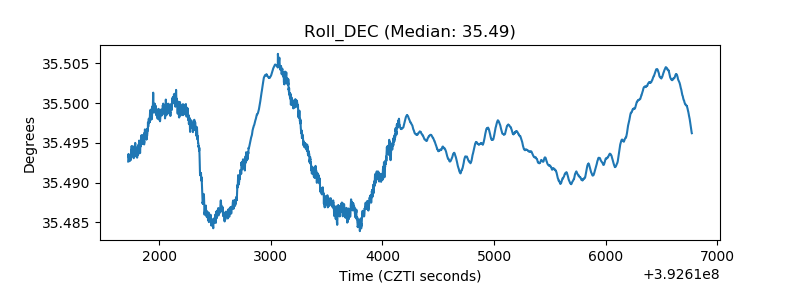 |
| _Roll_RA | 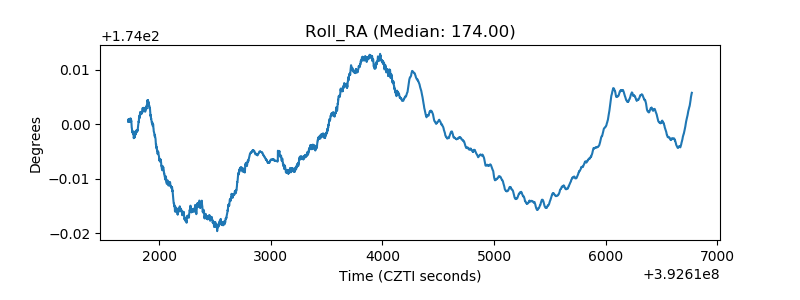 |
| Veto Counter | 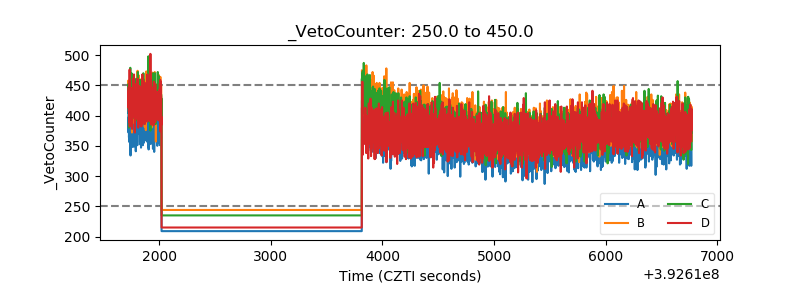 |