| Param | Original file | Final file |
|---|---|---|
| Filename | modeM0/AS1A11_080T02_9000005176_36234cztM0_level2.evt | modeM0/AS1A11_080T02_9000005176_36234cztM0_level2_quad_clean.evt |
| Size (bytes) | 465,687,360 | 46,592,640 |
| Size | 444.1 MB | 44.4 MB |
| Events in quadrant A | 2,449,753 | 278,021 |
| Events in quadrant B | 3,416,141 | 271,775 |
| Events in quadrant C | 2,665,969 | 272,918 |
| Events in quadrant D | 5,235,026 | 239,368 |
| Mode M9 | |||
|---|---|---|---|
| Quadrant | BADHDUFLAG | Total packets | Discarded packets |
| A | 0 | 40 | 0 |
| B | 0 | 40 | 0 |
| C | 0 | 40 | 0 |
| D | 0 | 41 | 0 |
| Mode M0 | |||
|---|---|---|---|
| Quadrant | BADHDUFLAG | Total packets | Discarded packets |
| A | 0 | 10296 | 3 |
| B | 0 | 13369 | 2 |
| C | 0 | 10765 | 2 |
| D | 0 | 18905 | 2 |
| Mode SS | |||
|---|---|---|---|
| Quadrant | BADHDUFLAG | Total packets | Discarded packets |
| A | 0 | 102 | 0 |
| B | 0 | 102 | 0 |
| C | 0 | 102 | 0 |
| D | 0 | 102 | 0 |
| Quadrant | Total seconds | Saturated seconds | Saturation percentage |
|---|---|---|---|
| A | 4957 | 4 | 0.080694% |
| B | 4957 | 296 | 5.971354% |
| C | 4957 | 68 | 1.371797% |
| D | 4957 | 565 | 11.398023% |
Noise dominated data is calculated using 1-second bins in cleaned event files. If a bin has >2000 counts, and if more than 50% of those come from <1% of pixels, then it is considered to be noise-dominated and hence unusable.
| Quadrant | # 1 sec bins | Bins with >0 counts | Bins with >2000 counts | High rate bins dominated by noise | Noise dominated (total time) | Noise dominated (detector-on time) | Marked lightcurve |
|---|---|---|---|---|---|---|---|
| A | 7050 | 4958 | 0 | 0 | 0.00% | 0.00% | 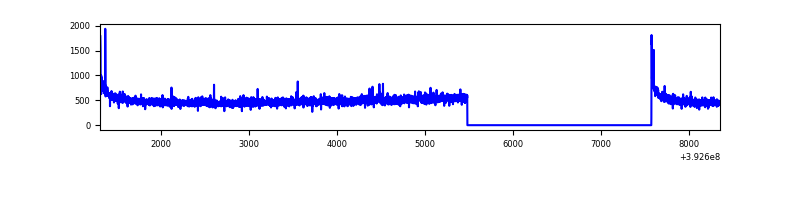 |
| B | 7050 | 4958 | 231 | 231 | 3.28% | 4.66% | 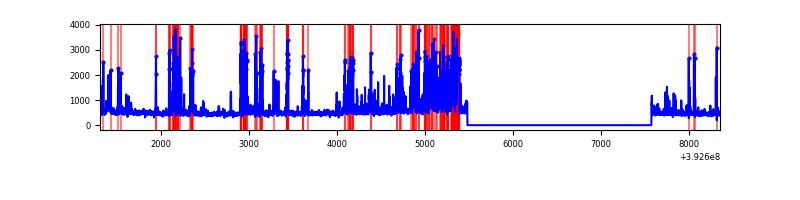 |
| C | 7050 | 4958 | 43 | 43 | 0.61% | 0.87% | 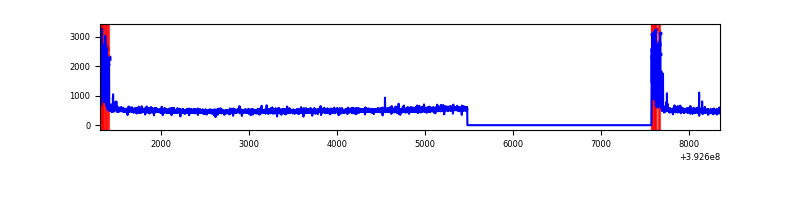 |
| D | 7050 | 4958 | 568 | 568 | 8.06% | 11.46% | 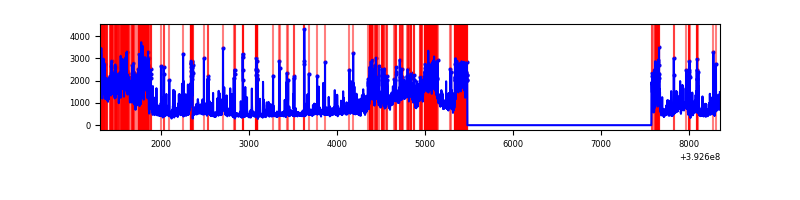 |
Top three noisy pixels from each quadrant. If the there are fewer than three noisy pixels in the level2.evt file, extra rows are filled as -1
| Pixel properties | Quadrant properties | ||||||
|---|---|---|---|---|---|---|---|
| Quadrant | DetID | PixID | Counts | Sigma | Mean | Median | Sigma |
| A | 10 | 83 | 173155 | 1475.52 | 581 | 570 | 117.0 |
| A | 13 | 6 | 12641 | 103.2 | 581 | 570 | 117.0 |
| A | 9 | 143 | 9893 | 79.71 | 581 | 570 | 117.0 |
| B | 5 | 172 | 491398 | 4521.4 | 568 | 556 | 108.6 |
| B | 5 | 236 | 456395 | 4198.97 | 568 | 556 | 108.6 |
| B | 5 | 255 | 110713 | 1014.71 | 568 | 556 | 108.6 |
| C | 0 | 10 | 258305 | 1950.86 | 564 | 568 | 132.1 |
| C | 15 | 214 | 207943 | 1569.66 | 564 | 568 | 132.1 |
| C | 13 | 61 | 3796 | 24.43 | 564 | 568 | 132.1 |
| D | 12 | 227 | 1838302 | 13777.88 | 544 | 529 | 133.4 |
| D | 12 | 235 | 428848 | 3211.13 | 544 | 529 | 133.4 |
| D | 12 | 6 | 237900 | 1779.58 | 544 | 529 | 133.4 |
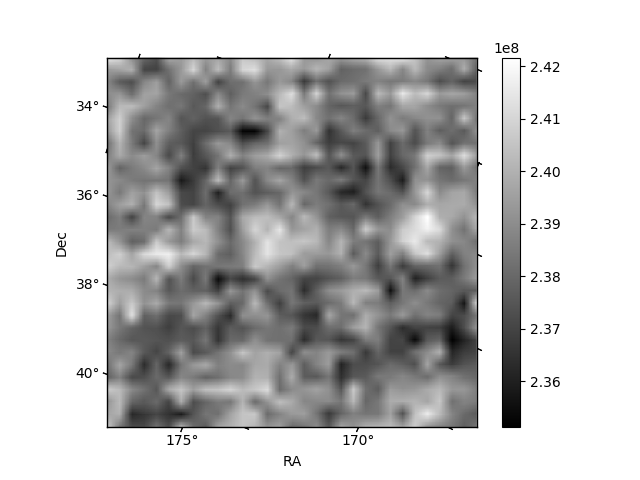
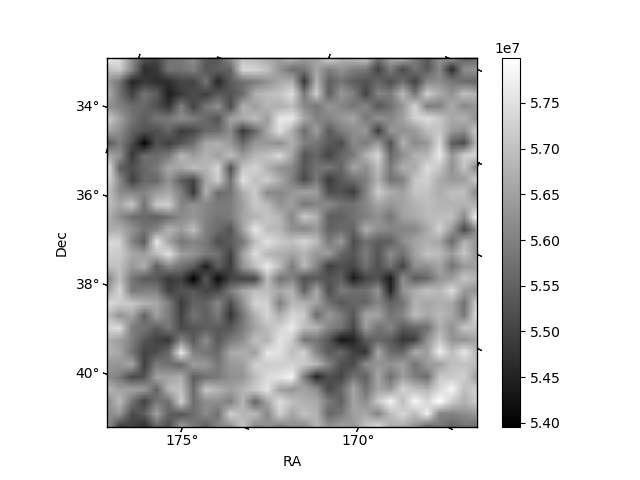
Histogram calculated using DETX and DETY for each event in the final _common_clean file
| Quadrant A | 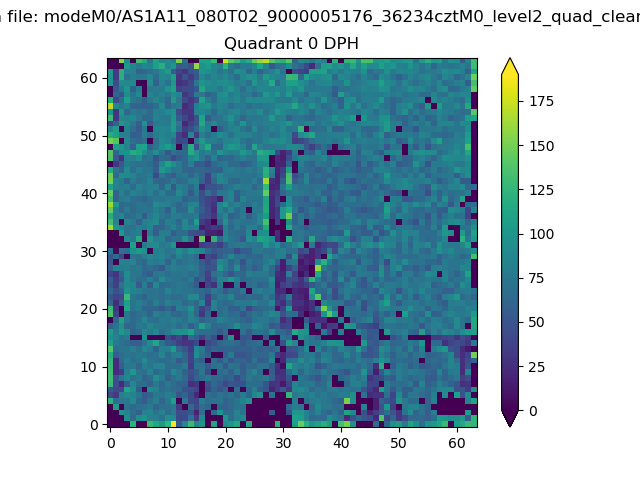 |
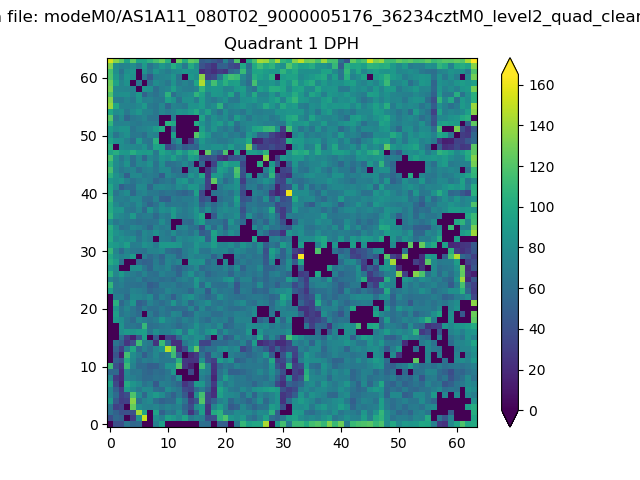 |
Quadrant B |
|---|---|---|---|
| Quadrant D |  |
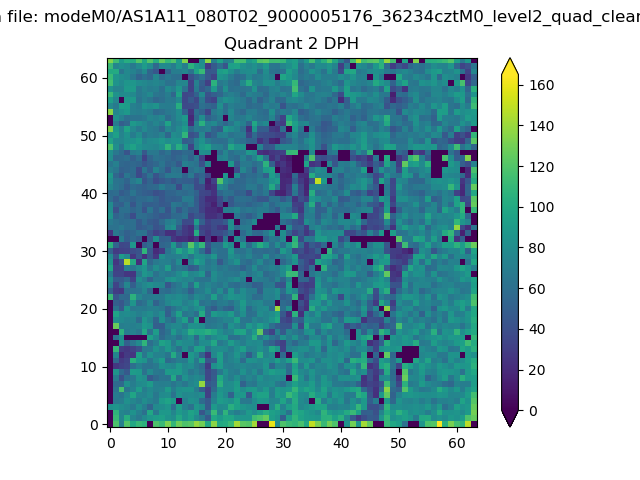 |
Quadrant C |
| Plot type | Count rate plots | Images |
|---|---|---|
| Comparison with Poisson distribution Blue bars denote a histogram of data divided into 1 sec bins. Red curve is a Poisson curve with rate = median count rate of data. |
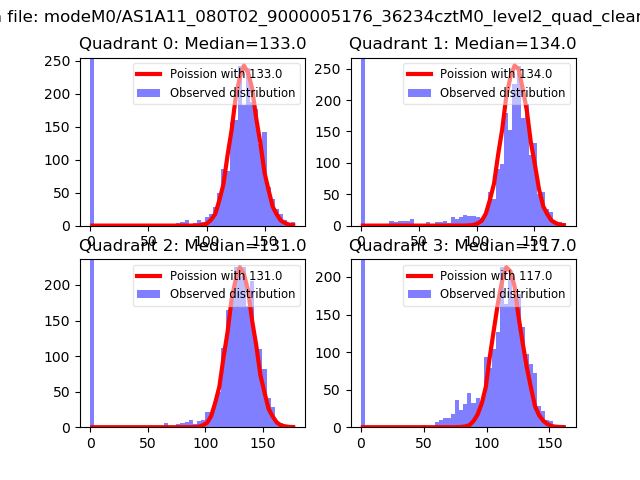 |
 |
| Quadrant-wise count rates Data is divided into 100 sec bins |
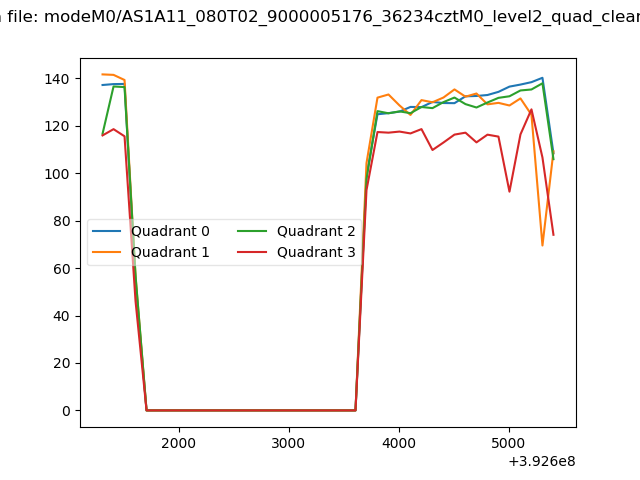 |
|
| Module-wise count rates for Quadrant A Data is divided into 100 sec bins |
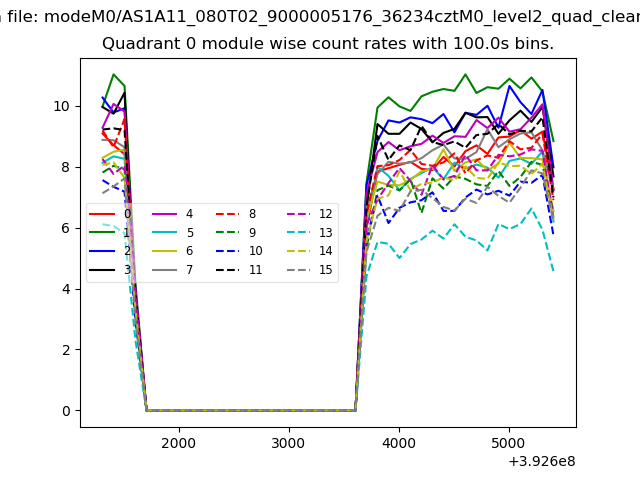 |
 |
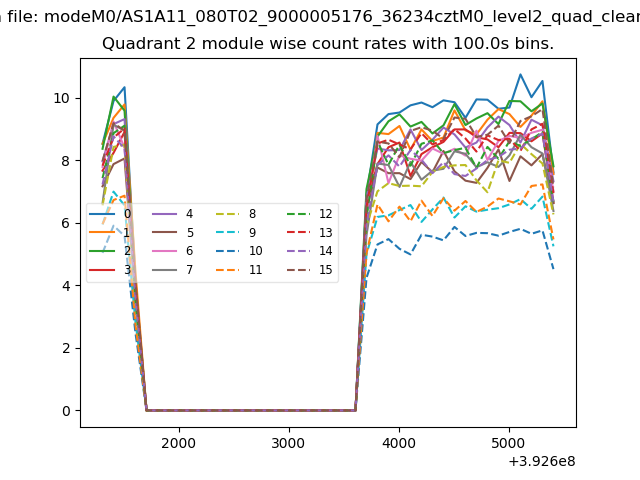
| Module-wise count rates for Quadrant B Data is divided into 100 sec bins |
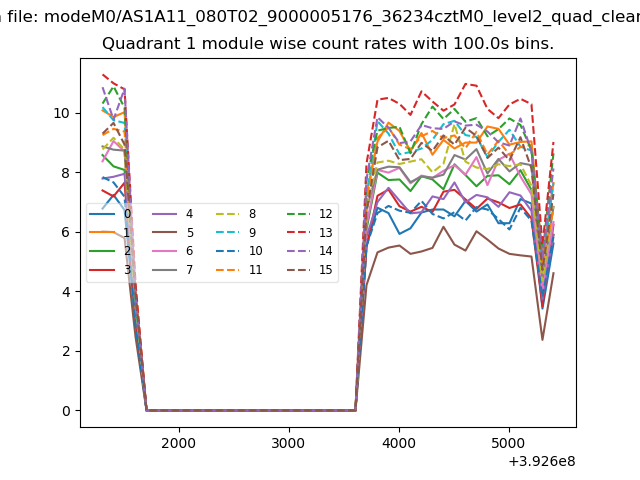 |
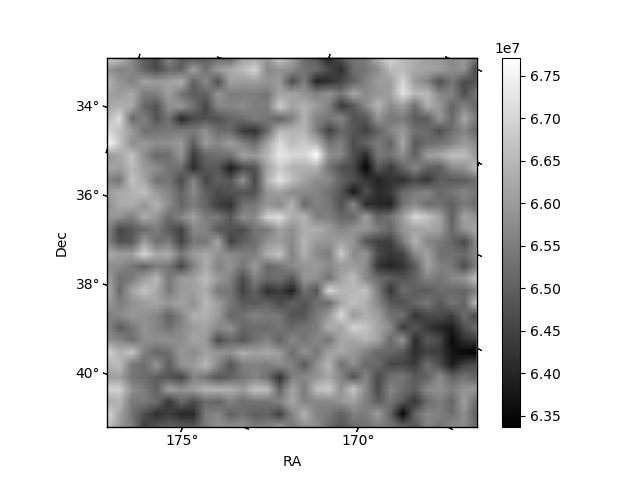 |
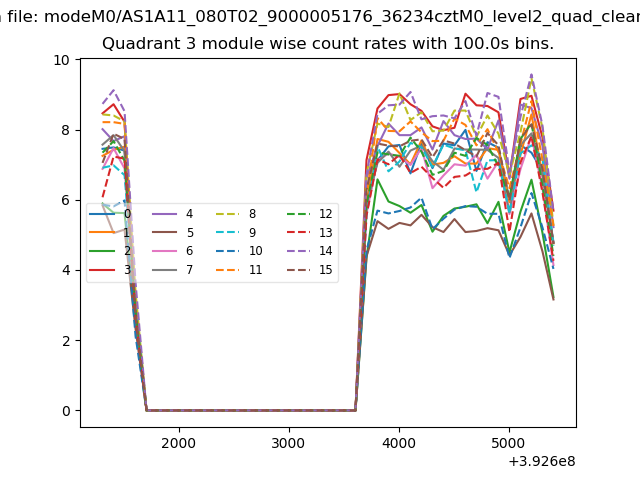
| Module-wise count rates for Quadrant C Data is divided into 100 sec bins |
 |
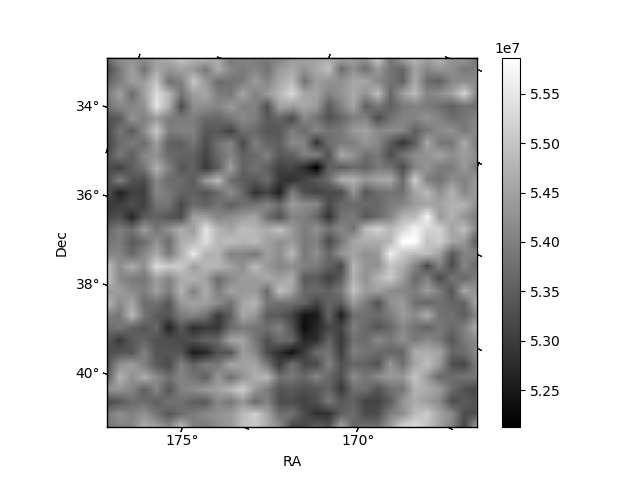 |
| Module-wise count rates for Quadrant D Data is divided into 100 sec bins |
 |
 |
| Parameter | Plot |
|---|---|
| CZT HV Monitor | 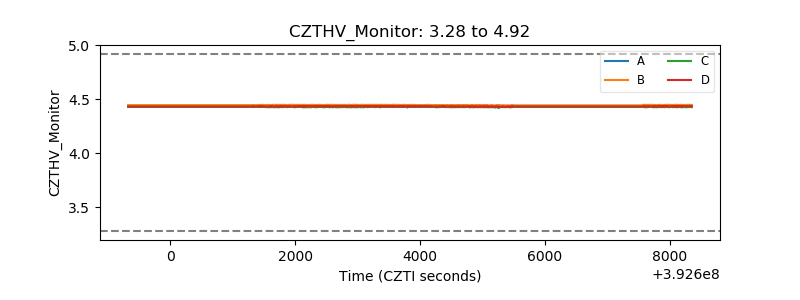 |
| D_VDD | 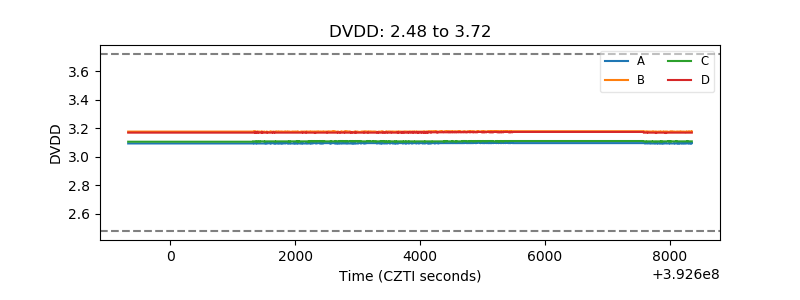 |
| Temperature 1 | 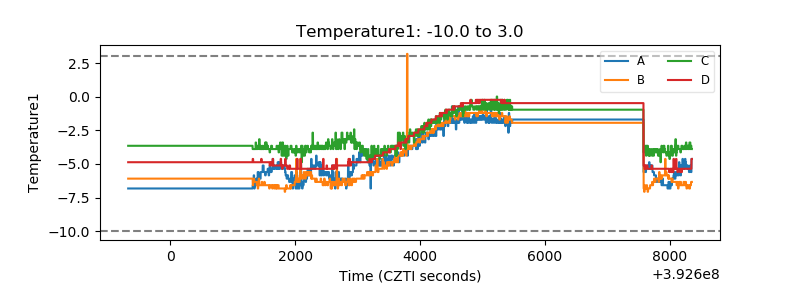 |
| Veto HV Monitor | 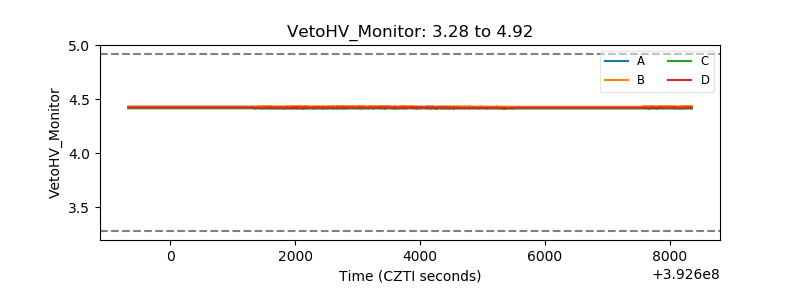 |
| Veto LLD | 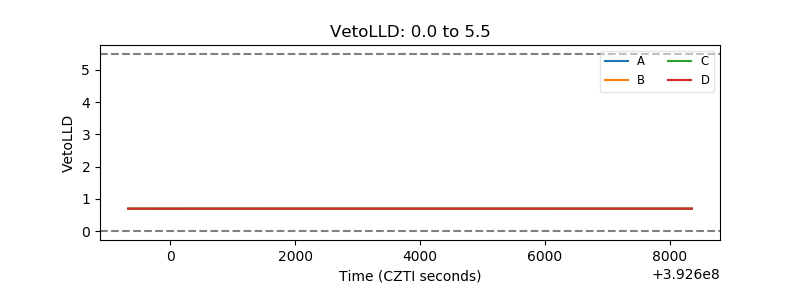 |
| Alpha Counter | 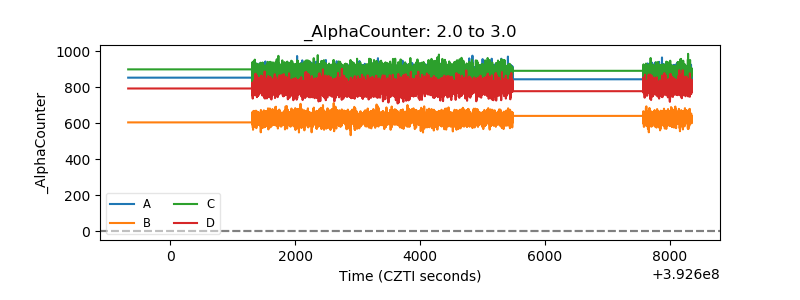 |
| _CPM_Rate | 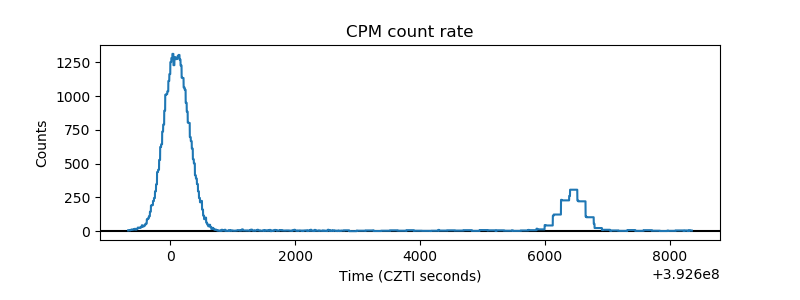 |
| CZT Counter | 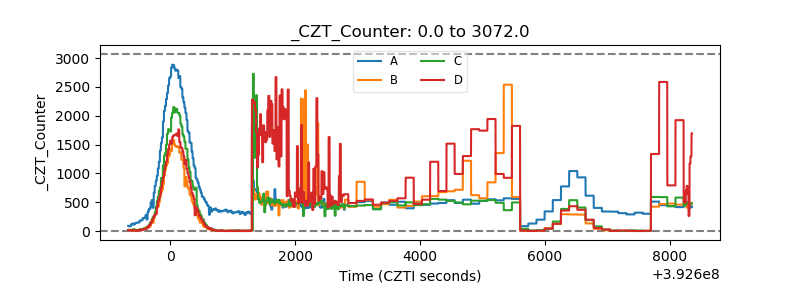 |
| +2.5 Volts monitor | 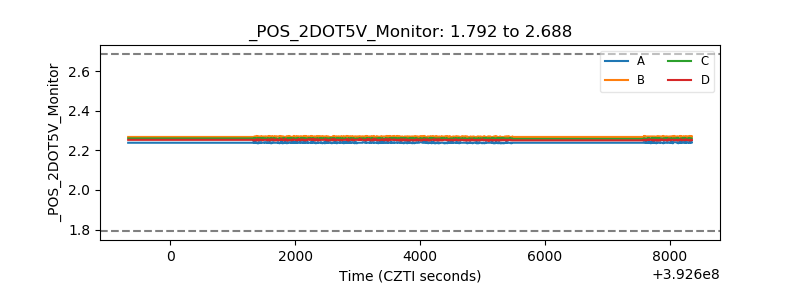 |
| +5 Volts monitor | 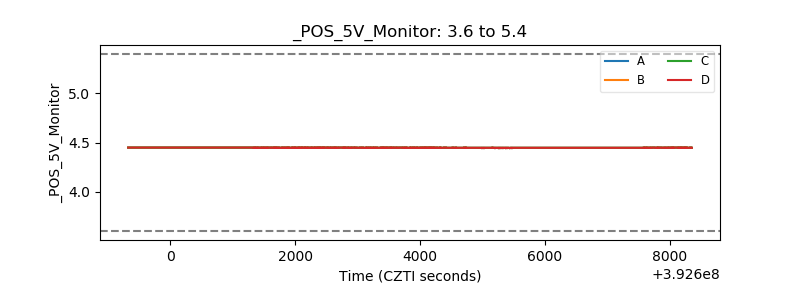 |
| _ROLL_ROT | 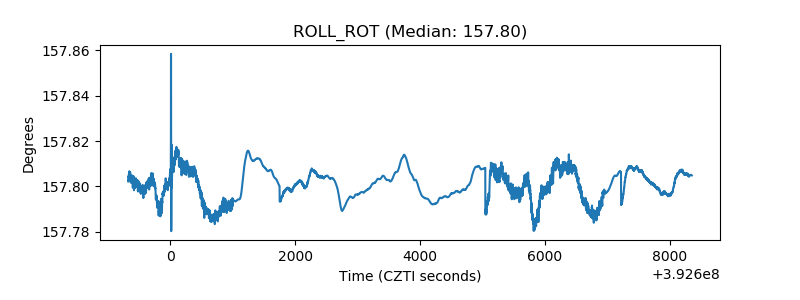 |
| _Roll_DEC | 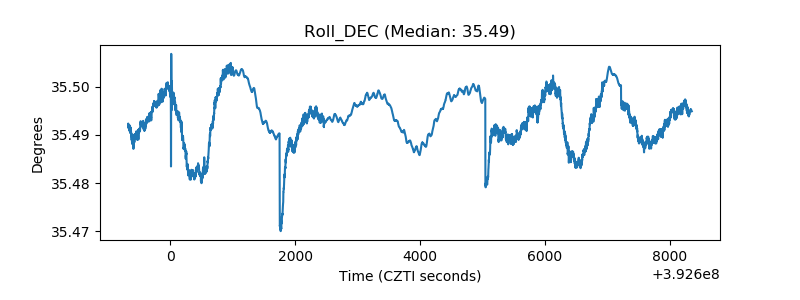 |
| _Roll_RA | 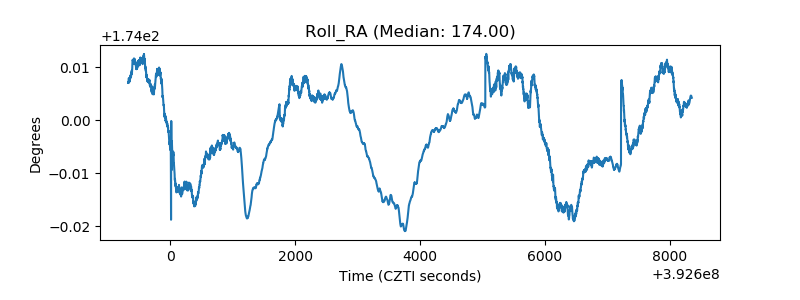 |
| Veto Counter | 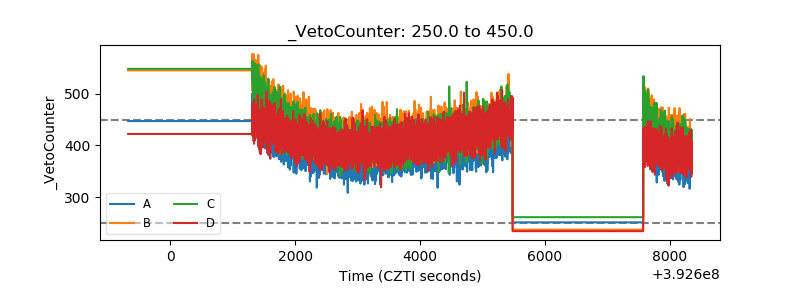 |