| Param | Original file | Final file |
|---|---|---|
| Filename | modeM0/AS1A11_080T02_9000005176_36233cztM0_level2.evt | modeM0/AS1A11_080T02_9000005176_36233cztM0_level2_quad_clean.evt |
| Size (bytes) | 487,232,640 | 53,311,680 |
| Size | 464.7 MB | 50.8 MB |
| Events in quadrant A | 2,606,252 | 330,680 |
| Events in quadrant B | 4,095,110 | 324,273 |
| Events in quadrant C | 2,736,879 | 323,397 |
| Events in quadrant D | 4,986,193 | 292,194 |
| Mode M9 | |||
|---|---|---|---|
| Quadrant | BADHDUFLAG | Total packets | Discarded packets |
| A | 0 | 33 | 0 |
| B | 0 | 33 | 0 |
| C | 0 | 33 | 0 |
| D | 0 | 34 | 0 |
| Mode M0 | |||
|---|---|---|---|
| Quadrant | BADHDUFLAG | Total packets | Discarded packets |
| A | 0 | 10674 | 3 |
| B | 0 | 15386 | 2 |
| C | 0 | 10862 | 2 |
| D | 0 | 18184 | 2 |
| Mode SS | |||
|---|---|---|---|
| Quadrant | BADHDUFLAG | Total packets | Discarded packets |
| A | 0 | 100 | 0 |
| B | 0 | 100 | 0 |
| C | 0 | 100 | 0 |
| D | 0 | 100 | 0 |
| Quadrant | Total seconds | Saturated seconds | Saturation percentage |
|---|---|---|---|
| A | 4889 | 30 | 0.613622% |
| B | 4889 | 472 | 9.654326% |
| C | 4889 | 106 | 2.168133% |
| D | 4889 | 479 | 9.797505% |
Noise dominated data is calculated using 1-second bins in cleaned event files. If a bin has >2000 counts, and if more than 50% of those come from <1% of pixels, then it is considered to be noise-dominated and hence unusable.
| Quadrant | # 1 sec bins | Bins with >0 counts | Bins with >2000 counts | High rate bins dominated by noise | Noise dominated (total time) | Noise dominated (detector-on time) | Marked lightcurve |
|---|---|---|---|---|---|---|---|
| A | 7042 | 4890 | 19 | 19 | 0.27% | 0.39% | 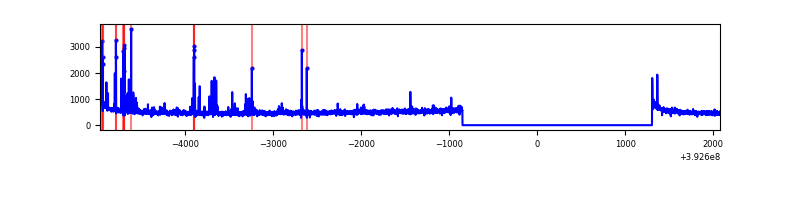 |
| B | 7042 | 4890 | 311 | 311 | 4.42% | 6.36% | 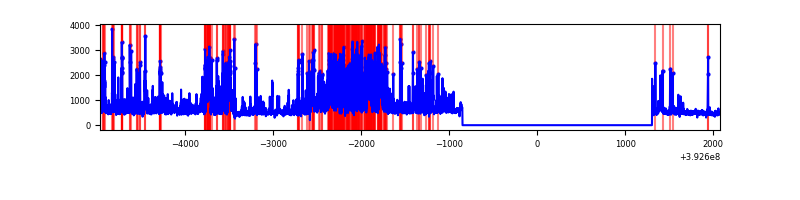 |
| C | 7042 | 4890 | 75 | 75 | 1.07% | 1.53% | 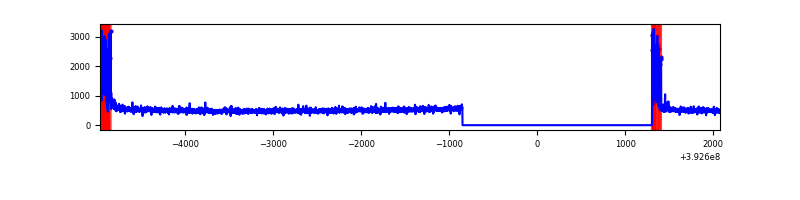 |
| D | 7042 | 4890 | 506 | 506 | 7.19% | 10.35% |  |
Top three noisy pixels from each quadrant. If the there are fewer than three noisy pixels in the level2.evt file, extra rows are filled as -1
| Pixel properties | Quadrant properties | ||||||
|---|---|---|---|---|---|---|---|
| Quadrant | DetID | PixID | Counts | Sigma | Mean | Median | Sigma |
| A | 10 | 83 | 165256 | 1395.39 | 585 | 574 | 118.0 |
| A | 7 | 16 | 135098 | 1139.86 | 585 | 574 | 118.0 |
| A | 9 | 143 | 33920 | 282.55 | 585 | 574 | 118.0 |
| B | 5 | 236 | 954484 | 8877.08 | 570 | 555 | 107.5 |
| B | 5 | 172 | 555581 | 5164.97 | 570 | 555 | 107.5 |
| B | 0 | 213 | 150236 | 1392.9 | 570 | 555 | 107.5 |
| C | 0 | 10 | 310327 | 2344.72 | 569 | 573 | 132.1 |
| C | 15 | 214 | 204410 | 1542.97 | 569 | 573 | 132.1 |
| C | 13 | 61 | 3808 | 24.49 | 569 | 573 | 132.1 |
| D | 12 | 227 | 1242103 | 9229.17 | 546 | 529 | 134.5 |
| D | 12 | 6 | 464863 | 3451.6 | 546 | 529 | 134.5 |
| D | 2 | 250 | 357220 | 2651.44 | 546 | 529 | 134.5 |
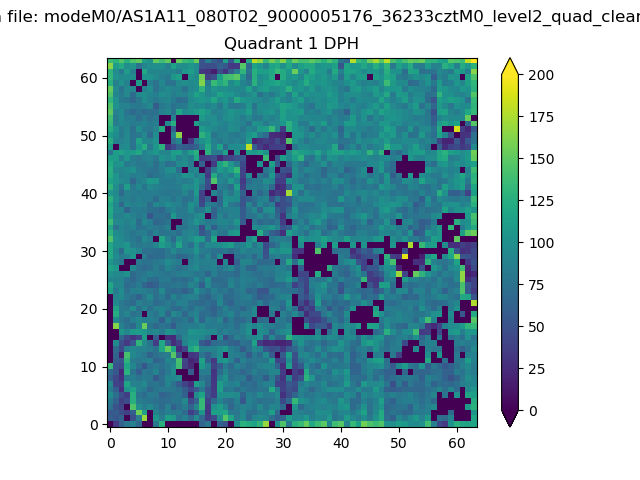
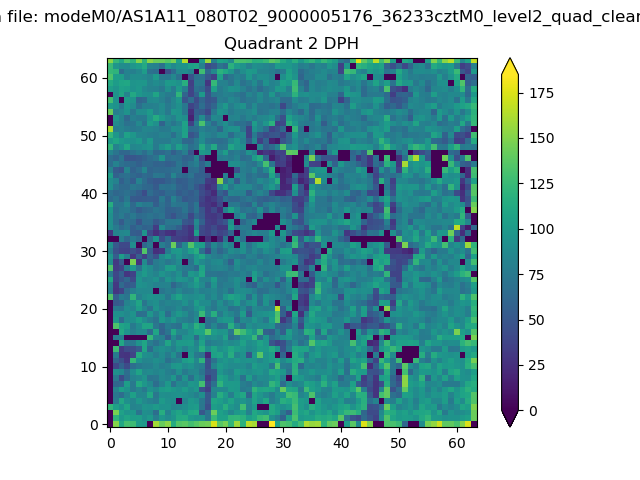
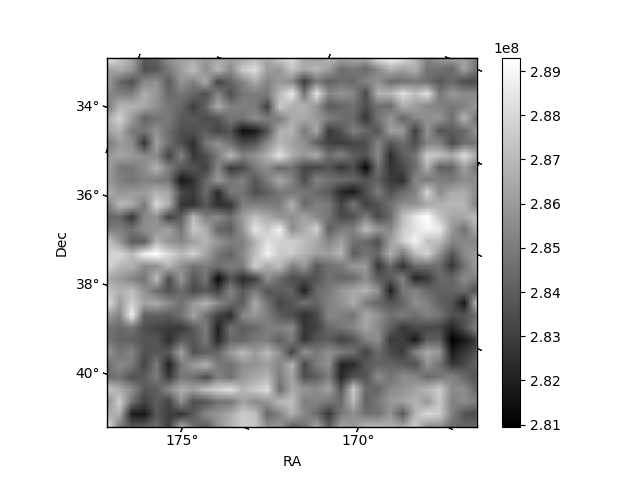
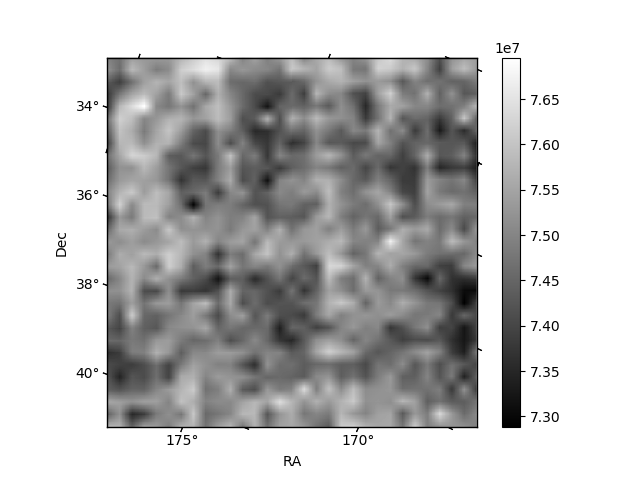
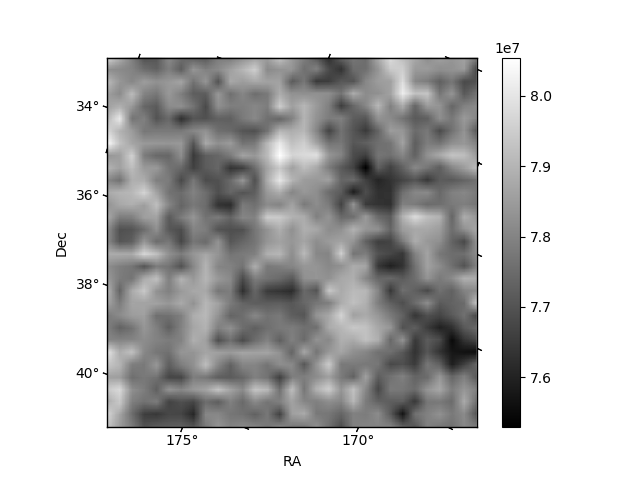
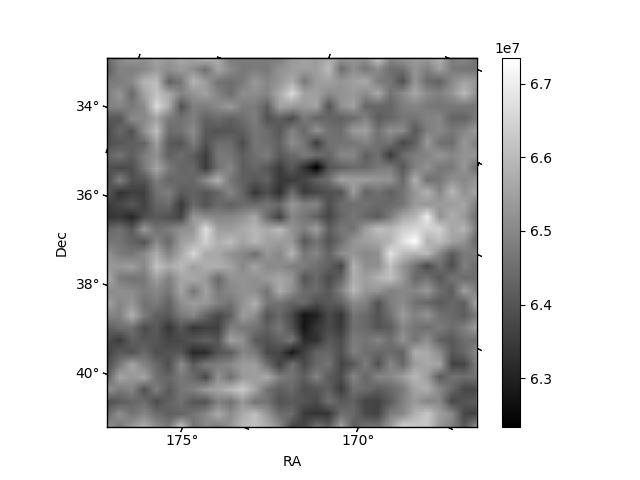
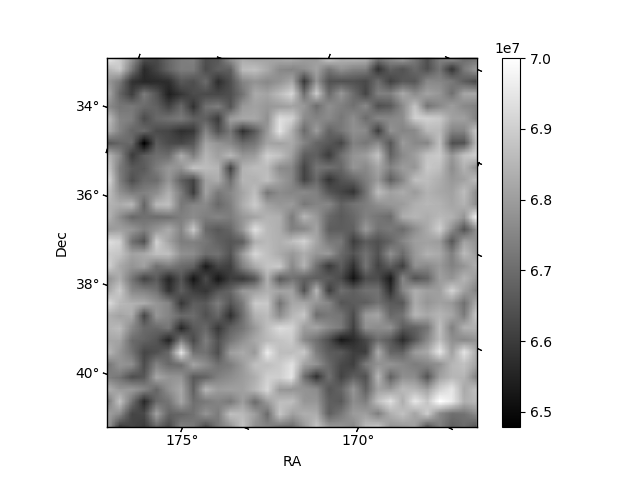
Histogram calculated using DETX and DETY for each event in the final _common_clean file
| Quadrant A | 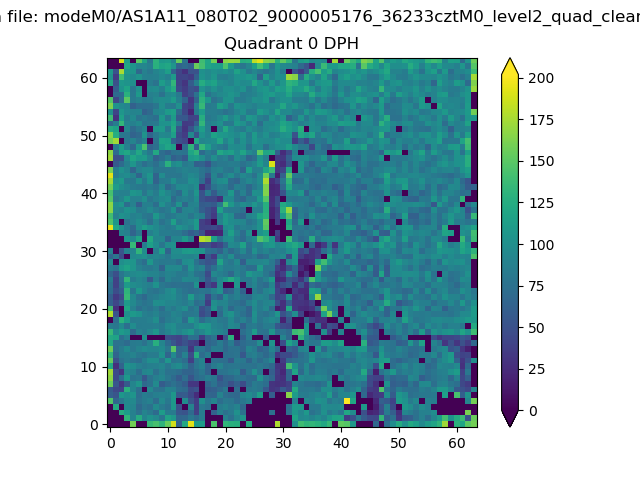 |
 |
Quadrant B |
|---|---|---|---|
| Quadrant D | 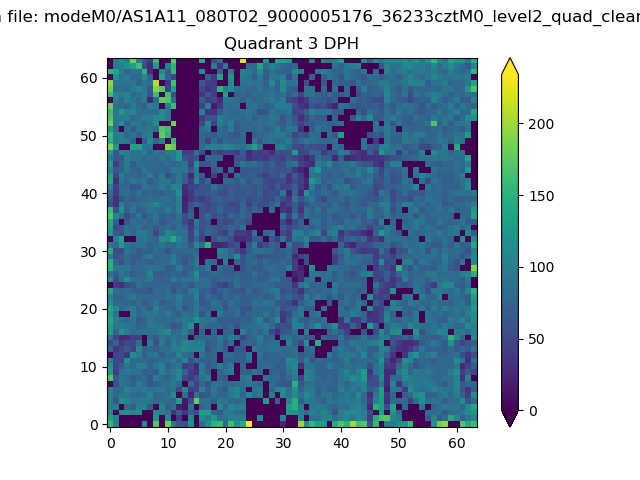 |
 |
Quadrant C |
| Plot type | Count rate plots | Images |
|---|---|---|
| Comparison with Poisson distribution Blue bars denote a histogram of data divided into 1 sec bins. Red curve is a Poisson curve with rate = median count rate of data. |
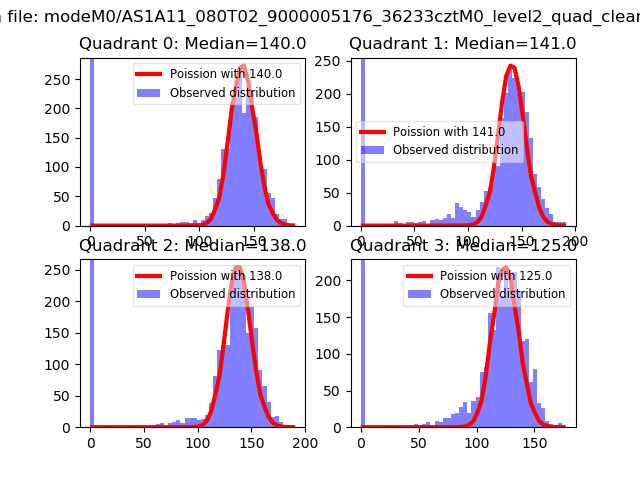 |
 |
| Quadrant-wise count rates Data is divided into 100 sec bins |
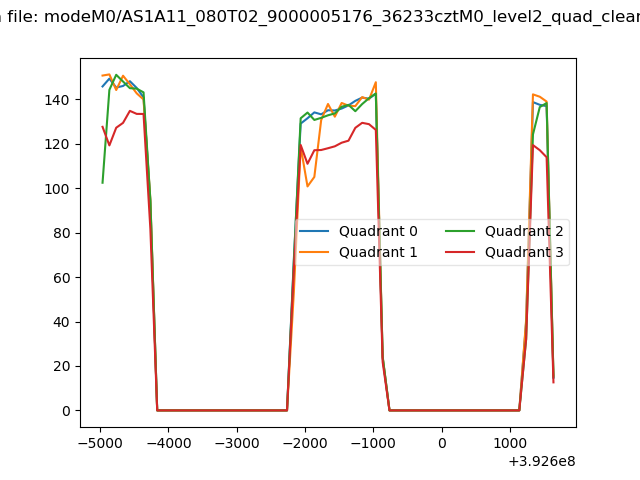 |
|
| Module-wise count rates for Quadrant A Data is divided into 100 sec bins |
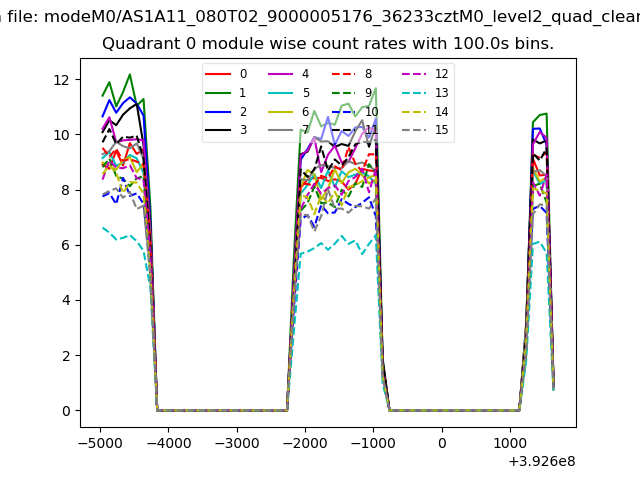 |
 |
| Module-wise count rates for Quadrant B Data is divided into 100 sec bins |
 |
 |
| Module-wise count rates for Quadrant C Data is divided into 100 sec bins |
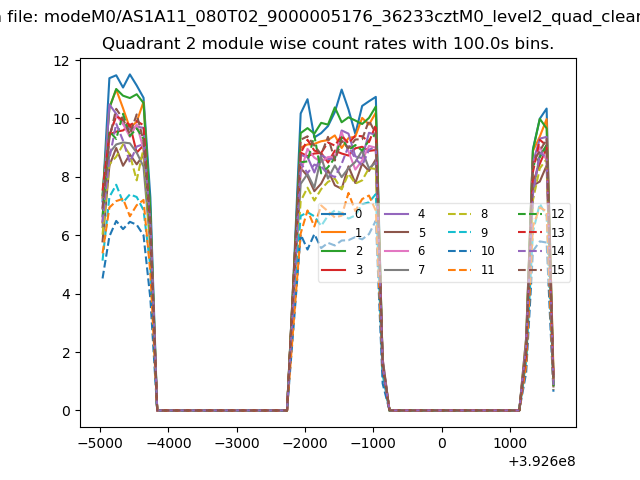 |
 |
| Module-wise count rates for Quadrant D Data is divided into 100 sec bins |
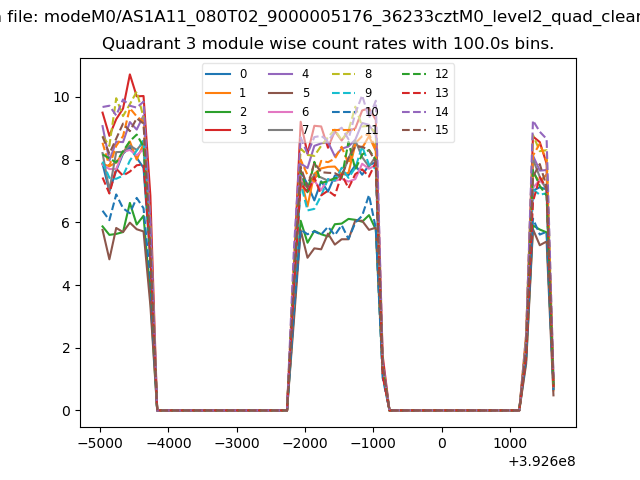 |
 |
| Parameter | Plot |
|---|---|
| CZT HV Monitor | 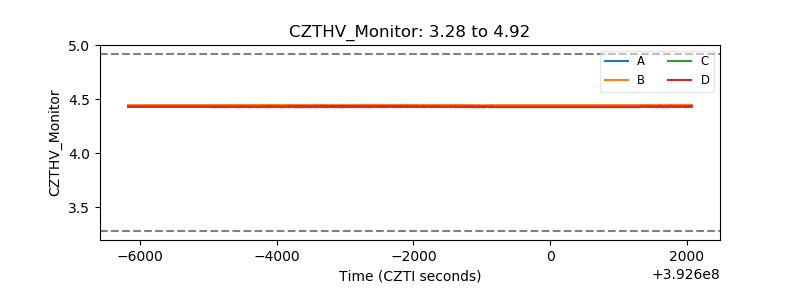 |
| D_VDD | 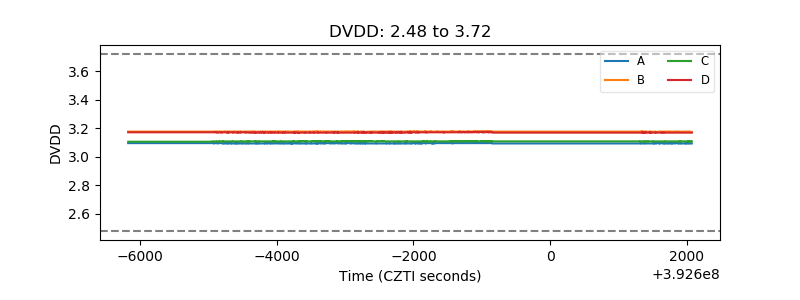 |
| Temperature 1 | 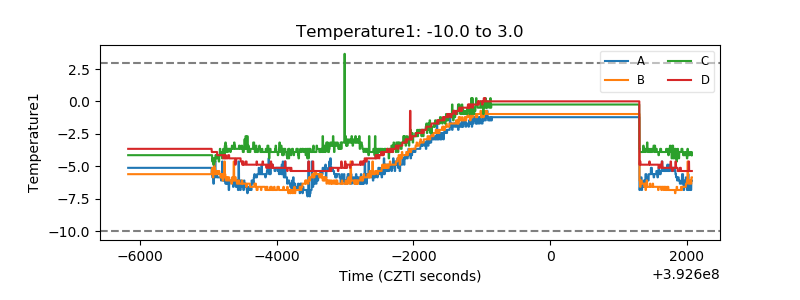 |
| Veto HV Monitor |  |
| Veto LLD | 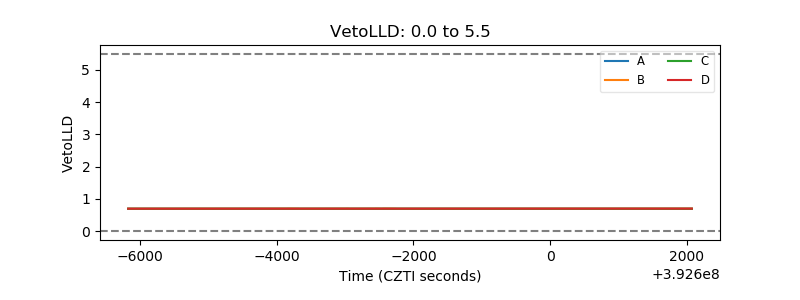 |
| Alpha Counter | 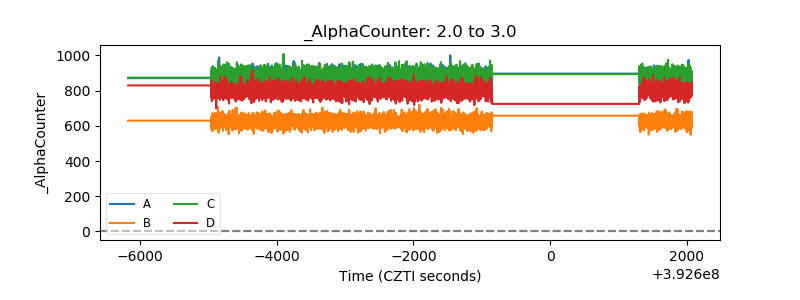 |
| _CPM_Rate | 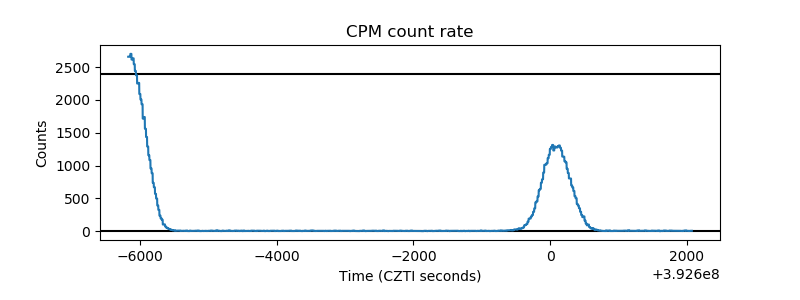 |
| CZT Counter | 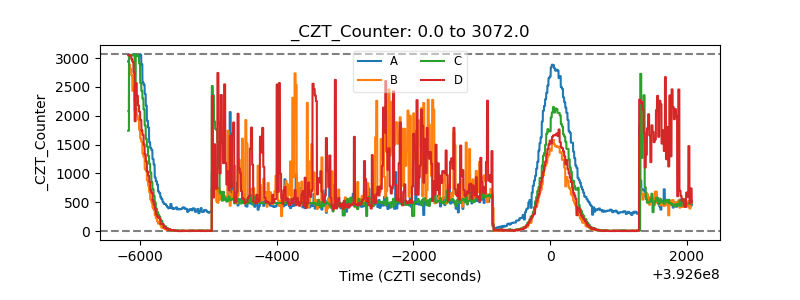 |
| +2.5 Volts monitor | 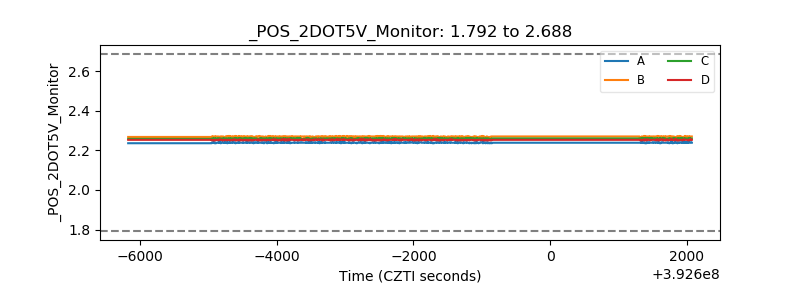 |
| +5 Volts monitor | 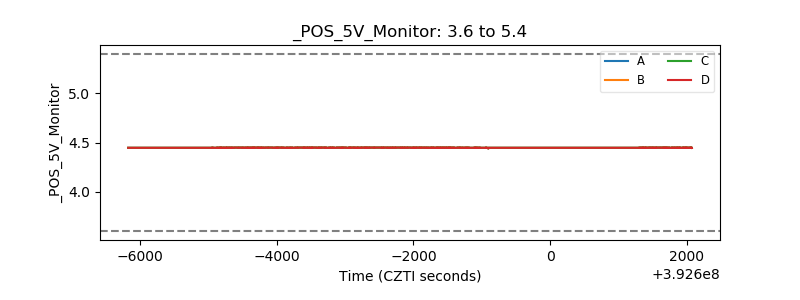 |
| _ROLL_ROT | 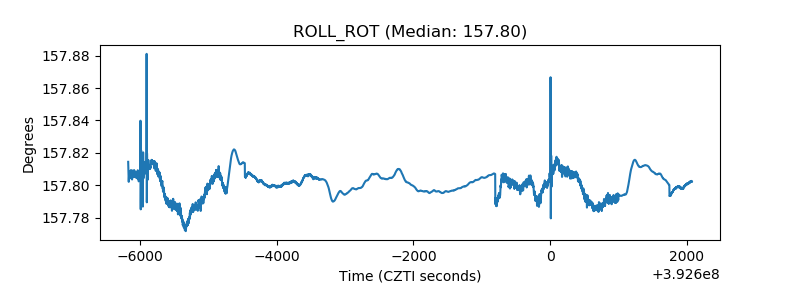 |
| _Roll_DEC | 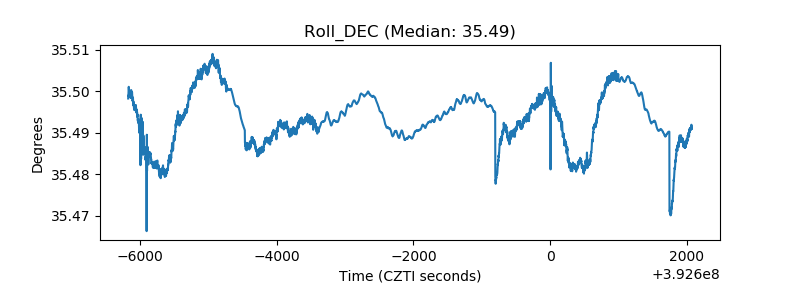 |
| _Roll_RA | 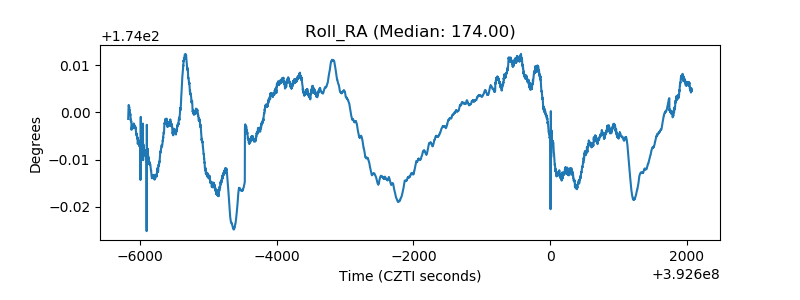 |
| Veto Counter | 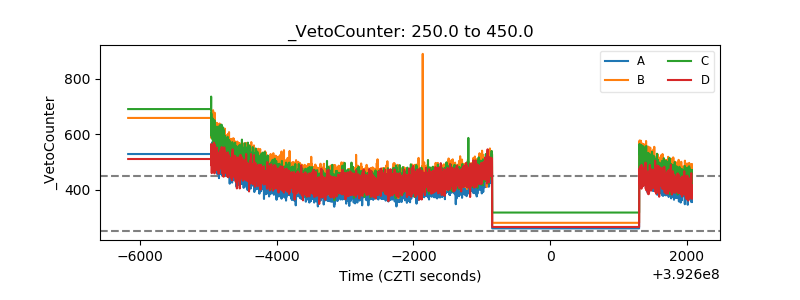 |