| Param | Original file | Final file |
|---|---|---|
| Filename | modeM0/AS1A11_080T02_9000005176_36232cztM0_level2.evt | modeM0/AS1A11_080T02_9000005176_36232cztM0_level2_quad_clean.evt |
| Size (bytes) | 482,227,200 | 63,547,200 |
| Size | 459.9 MB | 60.6 MB |
| Events in quadrant A | 2,653,269 | 409,210 |
| Events in quadrant B | 3,463,471 | 415,800 |
| Events in quadrant C | 2,809,578 | 404,066 |
| Events in quadrant D | 5,342,634 | 347,992 |
| Mode M9 | |||
|---|---|---|---|
| Quadrant | BADHDUFLAG | Total packets | Discarded packets |
| A | 0 | 29 | 0 |
| B | 0 | 29 | 0 |
| C | 0 | 29 | 0 |
| D | 0 | 30 | 0 |
| Mode M0 | |||
|---|---|---|---|
| Quadrant | BADHDUFLAG | Total packets | Discarded packets |
| A | 0 | 10892 | 3 |
| B | 0 | 13489 | 2 |
| C | 0 | 11123 | 2 |
| D | 0 | 19194 | 2 |
| Mode SS | |||
|---|---|---|---|
| Quadrant | BADHDUFLAG | Total packets | Discarded packets |
| A | 0 | 100 | 0 |
| B | 0 | 100 | 0 |
| C | 0 | 100 | 0 |
| D | 0 | 100 | 0 |
| Quadrant | Total seconds | Saturated seconds | Saturation percentage |
|---|---|---|---|
| A | 4948 | 28 | 0.565885% |
| B | 4948 | 236 | 4.769604% |
| C | 4948 | 109 | 2.202910% |
| D | 4948 | 703 | 14.207761% |
Noise dominated data is calculated using 1-second bins in cleaned event files. If a bin has >2000 counts, and if more than 50% of those come from <1% of pixels, then it is considered to be noise-dominated and hence unusable.
| Quadrant | # 1 sec bins | Bins with >0 counts | Bins with >2000 counts | High rate bins dominated by noise | Noise dominated (total time) | Noise dominated (detector-on time) | Marked lightcurve |
|---|---|---|---|---|---|---|---|
| A | 7071 | 4949 | 16 | 16 | 0.23% | 0.32% | 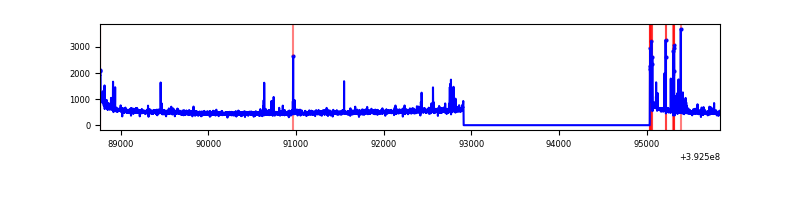 |
| B | 7071 | 4949 | 164 | 164 | 2.32% | 3.31% | 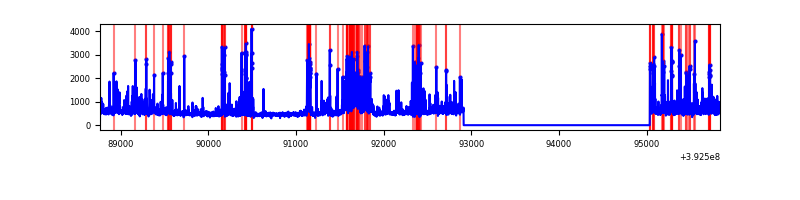 |
| C | 7071 | 4949 | 79 | 79 | 1.12% | 1.60% | 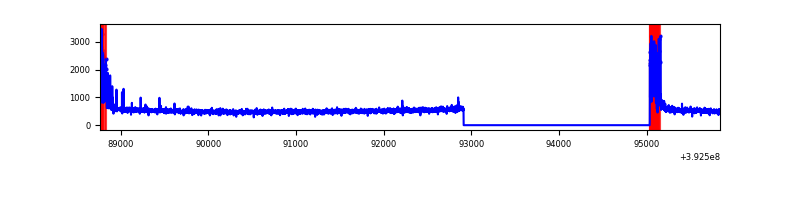 |
| D | 7071 | 4949 | 719 | 719 | 10.17% | 14.53% | 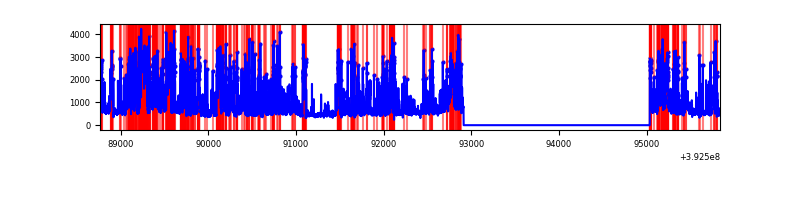 |
Top three noisy pixels from each quadrant. If the there are fewer than three noisy pixels in the level2.evt file, extra rows are filled as -1
| Pixel properties | Quadrant properties | ||||||
|---|---|---|---|---|---|---|---|
| Quadrant | DetID | PixID | Counts | Sigma | Mean | Median | Sigma |
| A | 10 | 83 | 171523 | 1411.28 | 603 | 591 | 121.1 |
| A | 7 | 16 | 106156 | 871.58 | 603 | 591 | 121.1 |
| A | 9 | 143 | 29263 | 236.73 | 603 | 591 | 121.1 |
| B | 5 | 172 | 729448 | 6422.88 | 598 | 583 | 113.5 |
| B | 0 | 213 | 127787 | 1120.94 | 598 | 583 | 113.5 |
| B | 5 | 255 | 97429 | 853.42 | 598 | 583 | 113.5 |
| C | 0 | 10 | 313801 | 2308.72 | 586 | 592 | 135.7 |
| C | 15 | 214 | 205915 | 1513.47 | 586 | 592 | 135.7 |
| C | 13 | 61 | 3946 | 24.72 | 586 | 592 | 135.7 |
| D | 12 | 227 | 1779370 | 13198.19 | 550 | 533 | 134.8 |
| D | 12 | 6 | 710799 | 5269.86 | 550 | 533 | 134.8 |
| D | 2 | 250 | 202591 | 1499.18 | 550 | 533 | 134.8 |
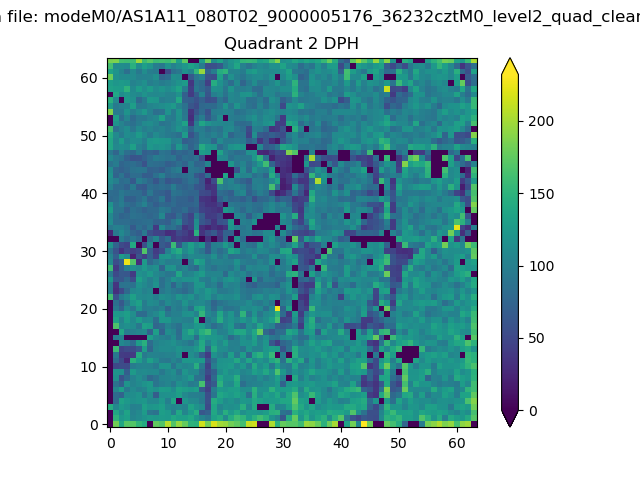
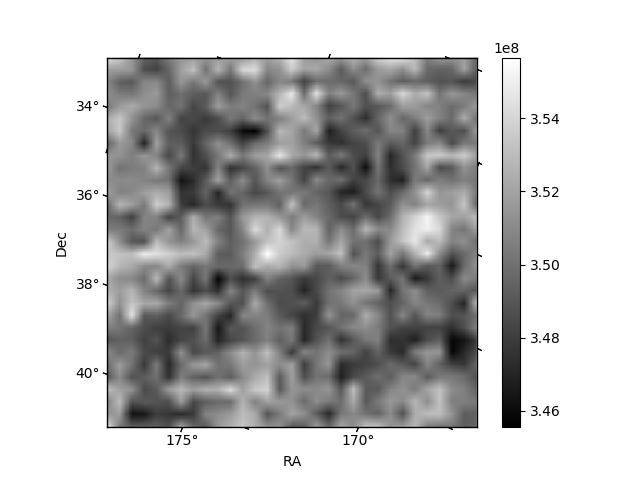
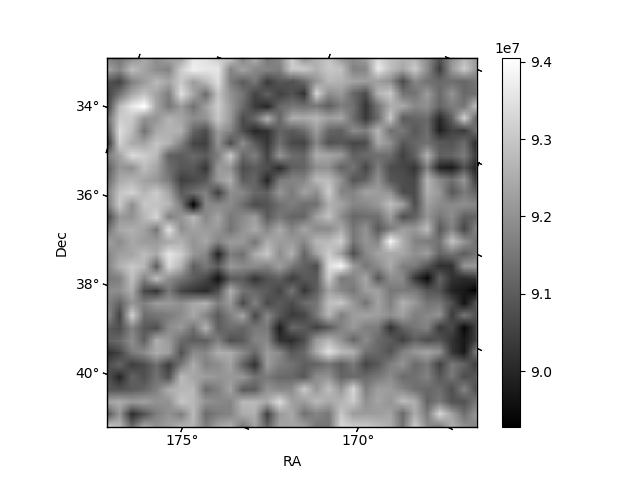
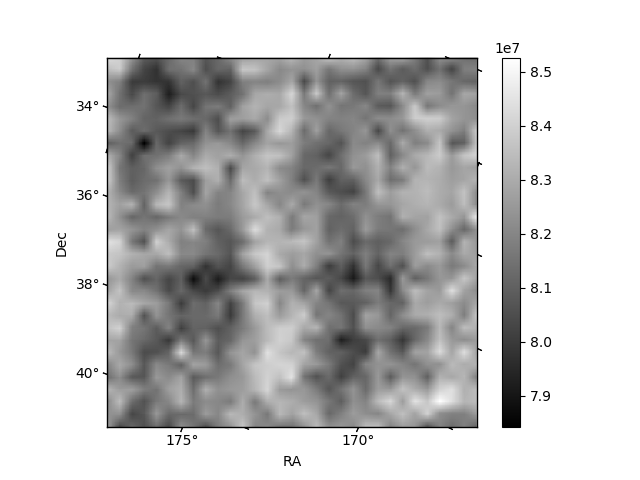
Histogram calculated using DETX and DETY for each event in the final _common_clean file
| Quadrant A | 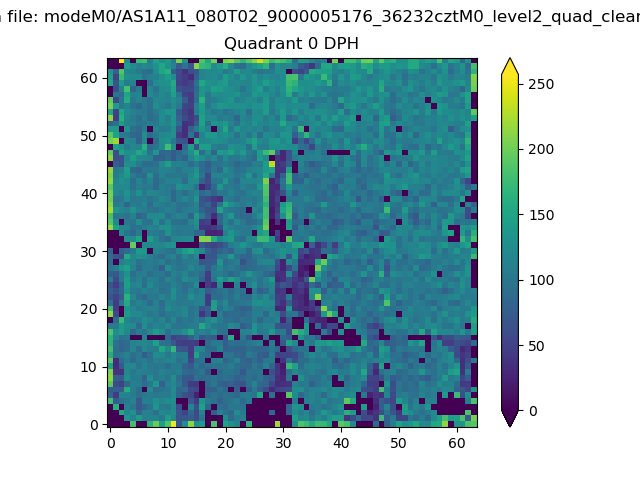 |
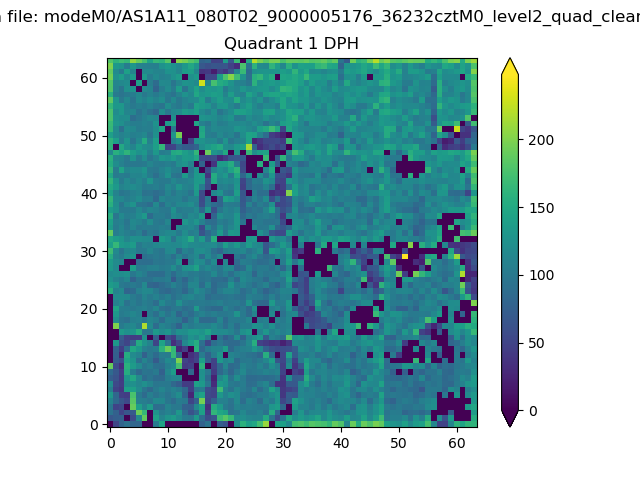 |
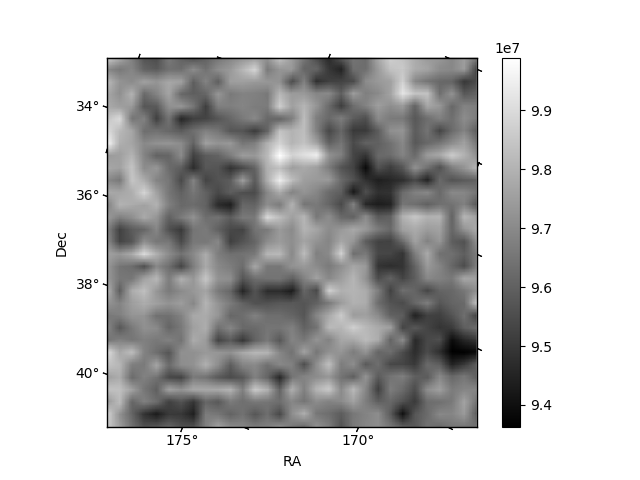
Quadrant B |
|---|---|---|---|
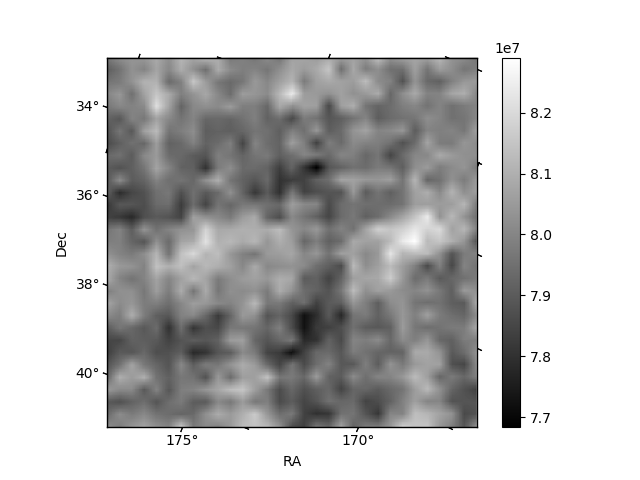
| Quadrant D | 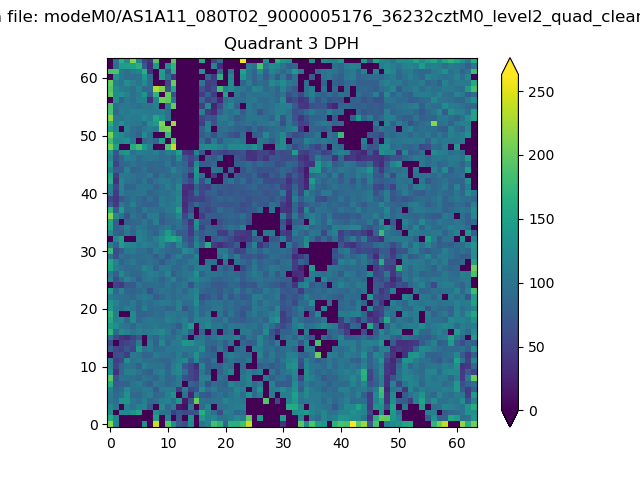 |
 |
Quadrant C |
| Plot type | Count rate plots | Images |
|---|---|---|
| Comparison with Poisson distribution Blue bars denote a histogram of data divided into 1 sec bins. Red curve is a Poisson curve with rate = median count rate of data. |
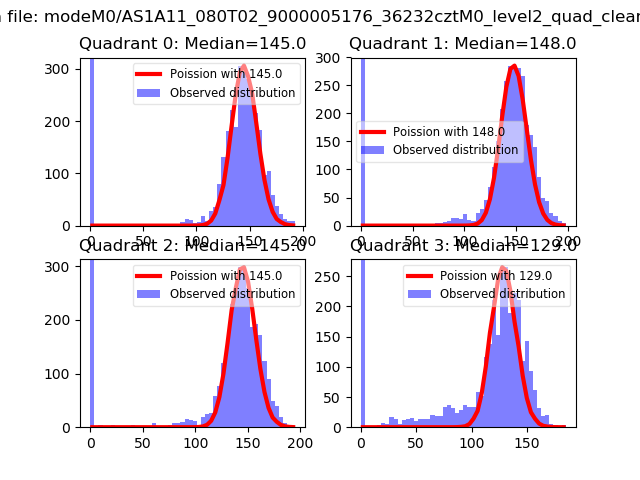 |
 |
| Quadrant-wise count rates Data is divided into 100 sec bins |
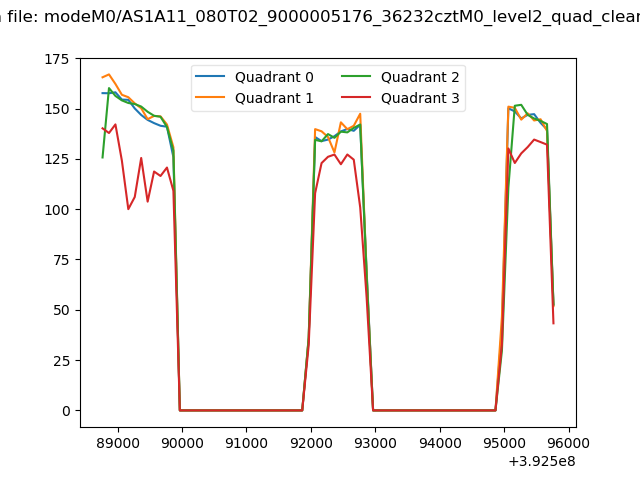 |
|
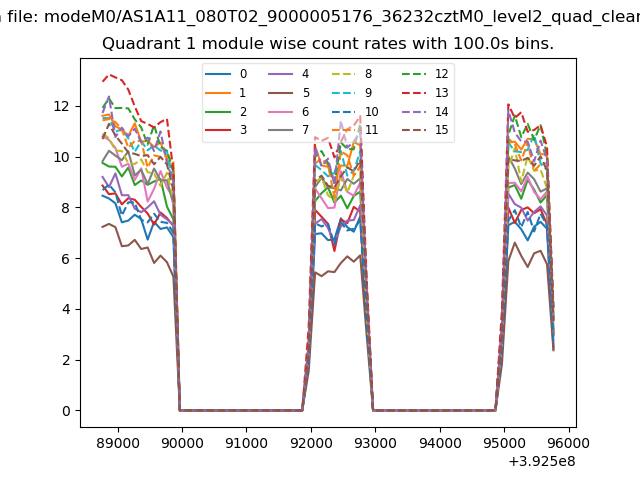
| Module-wise count rates for Quadrant A Data is divided into 100 sec bins |
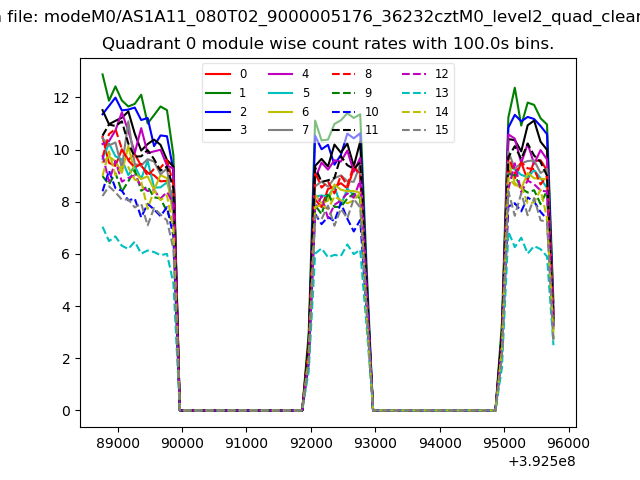 |
 |
| Module-wise count rates for Quadrant B Data is divided into 100 sec bins |
 |
 |
| Module-wise count rates for Quadrant C Data is divided into 100 sec bins |
 |
 |
| Module-wise count rates for Quadrant D Data is divided into 100 sec bins |
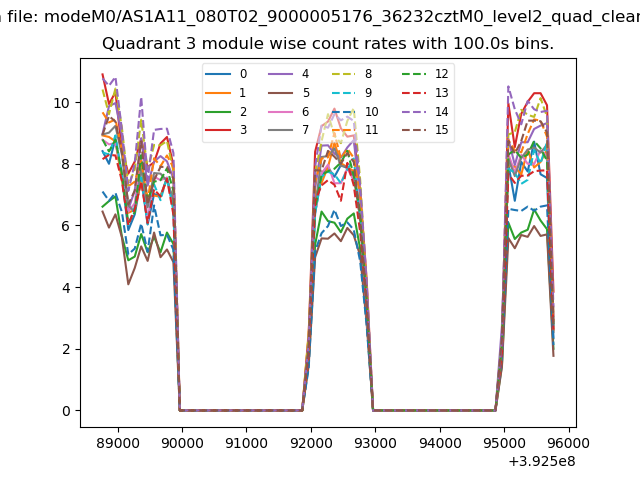 |
 |
| Parameter | Plot |
|---|---|
| CZT HV Monitor | 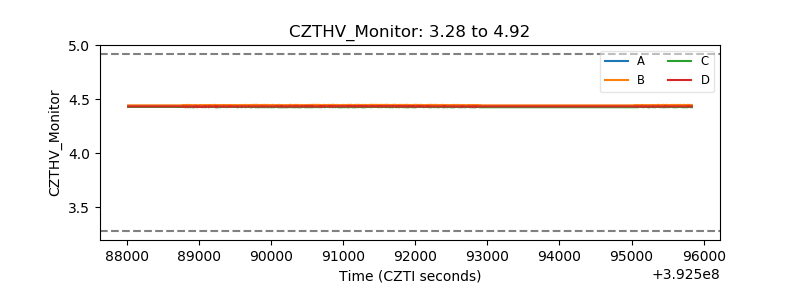 |
| D_VDD | 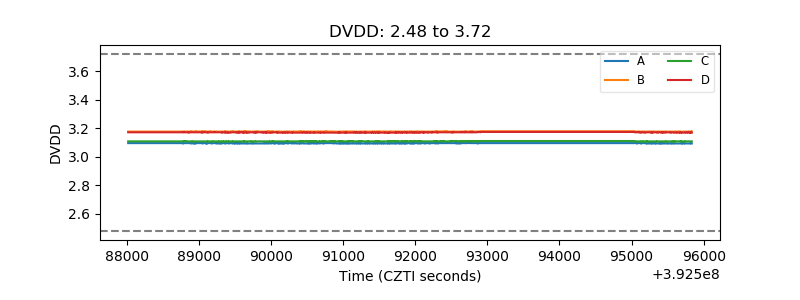 |
| Temperature 1 | 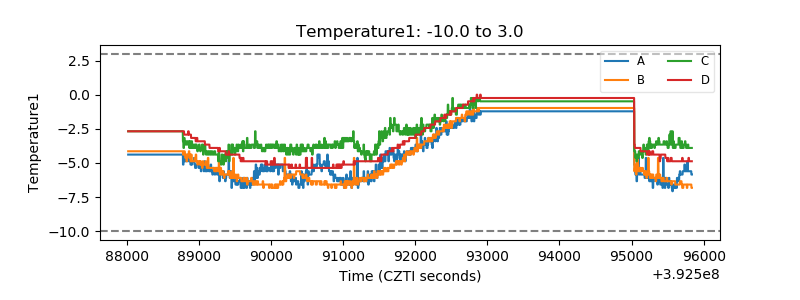 |
| Veto HV Monitor | 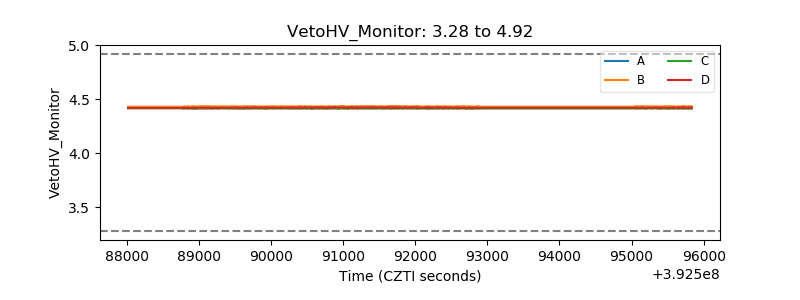 |
| Veto LLD | 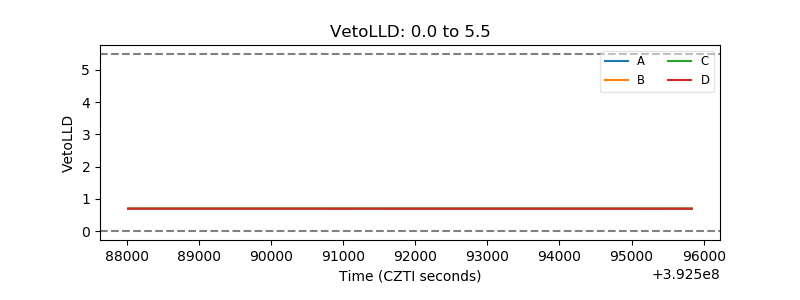 |
| Alpha Counter | 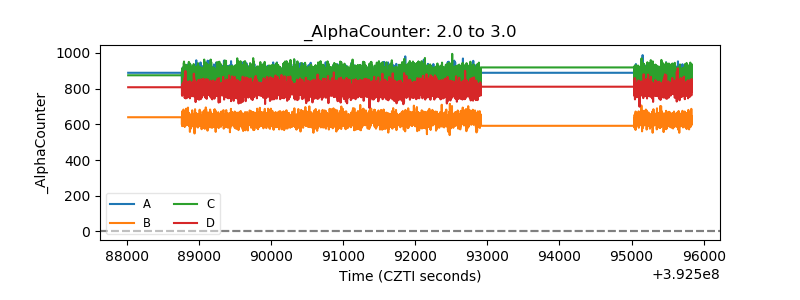 |
| _CPM_Rate | 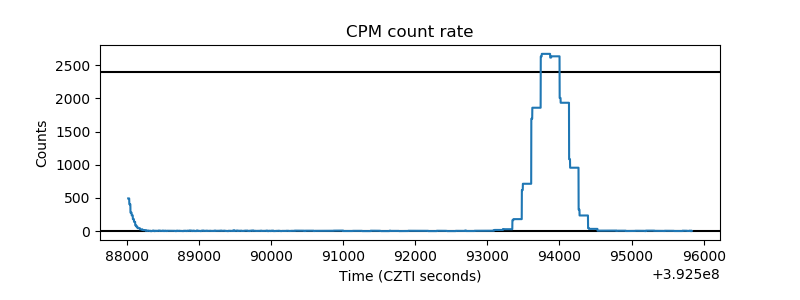 |
| CZT Counter | 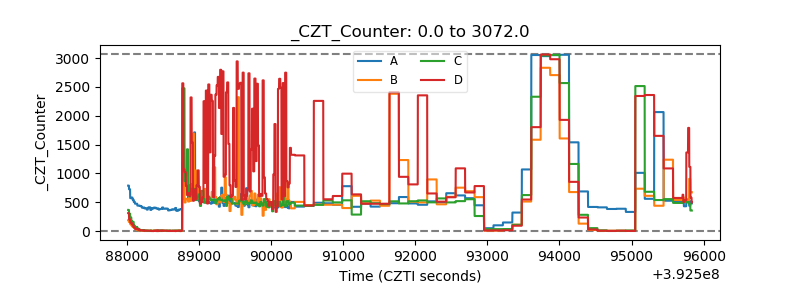 |
| +2.5 Volts monitor | 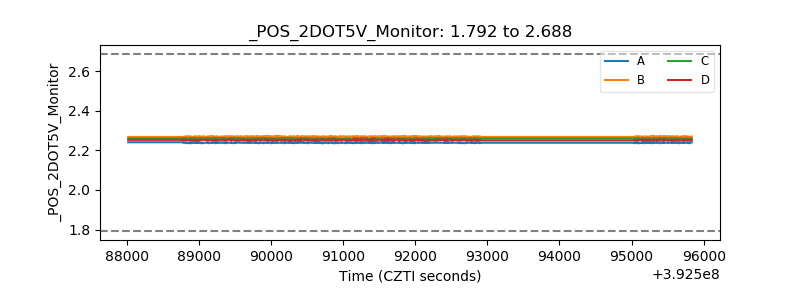 |
| +5 Volts monitor | 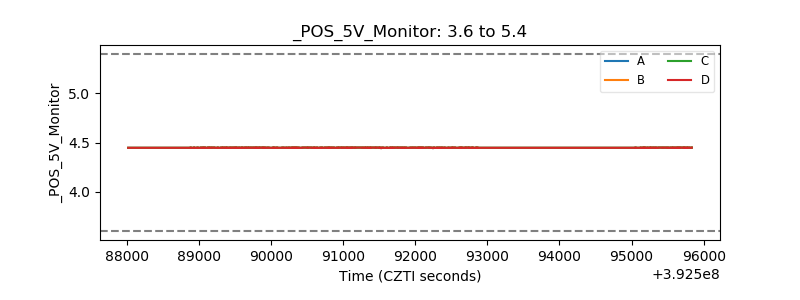 |
| _ROLL_ROT | 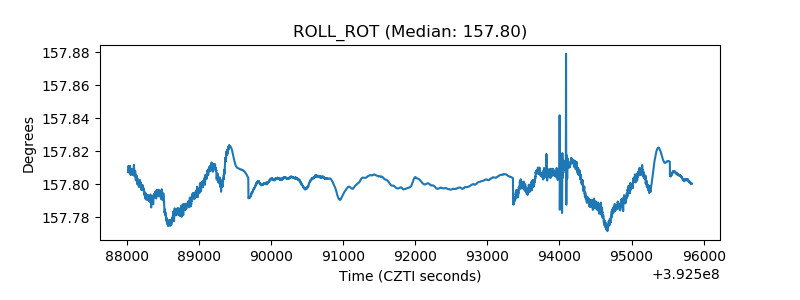 |
| _Roll_DEC | 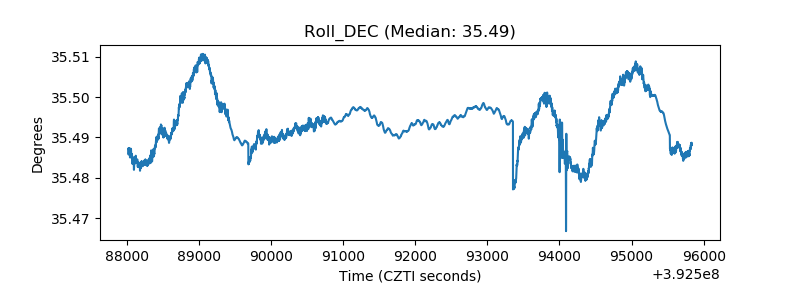 |
| _Roll_RA | 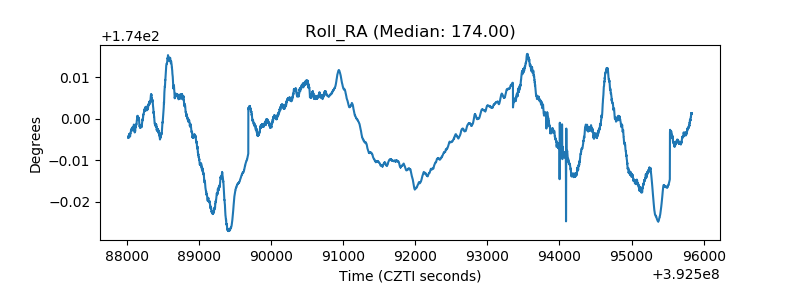 |
| Veto Counter | 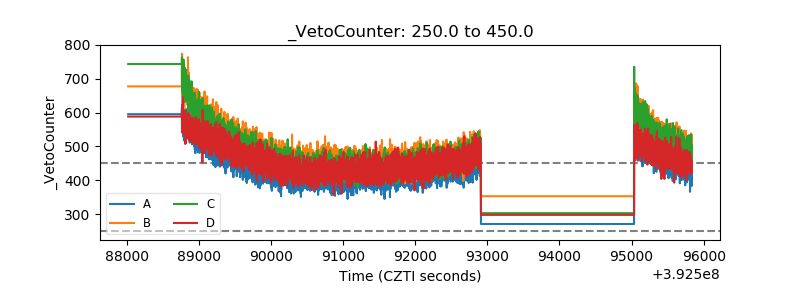 |