| Param | Original file | Final file |
|---|---|---|
| Filename | modeM0/AS1A11_080T02_9000005176_36227cztM0_level2.evt | modeM0/AS1A11_080T02_9000005176_36227cztM0_level2_quad_clean.evt |
| Size (bytes) | 578,868,480 | 70,513,920 |
| Size | 552.1 MB | 67.2 MB |
| Events in quadrant A | 2,750,566 | 474,146 |
| Events in quadrant B | 4,845,128 | 444,220 |
| Events in quadrant C | 3,078,332 | 461,746 |
| Events in quadrant D | 6,484,295 | 369,042 |
| Mode M9 | |||
|---|---|---|---|
| Quadrant | BADHDUFLAG | Total packets | Discarded packets |
| A | 0 | 17 | 0 |
| B | 0 | 17 | 0 |
| C | 0 | 17 | 0 |
| D | 0 | 18 | 0 |
| Mode M0 | |||
|---|---|---|---|
| Quadrant | BADHDUFLAG | Total packets | Discarded packets |
| A | 0 | 11834 | 3 |
| B | 0 | 18044 | 2 |
| C | 0 | 12533 | 2 |
| D | 0 | 22976 | 2 |
| Mode SS | |||
|---|---|---|---|
| Quadrant | BADHDUFLAG | Total packets | Discarded packets |
| A | 0 | 112 | 0 |
| B | 0 | 112 | 0 |
| C | 0 | 112 | 0 |
| D | 0 | 112 | 0 |
| Quadrant | Total seconds | Saturated seconds | Saturation percentage |
|---|---|---|---|
| A | 5505 | 18 | 0.326975% |
| B | 5505 | 591 | 10.735695% |
| C | 5505 | 98 | 1.780200% |
| D | 5505 | 1319 | 23.960036% |
Noise dominated data is calculated using 1-second bins in cleaned event files. If a bin has >2000 counts, and if more than 50% of those come from <1% of pixels, then it is considered to be noise-dominated and hence unusable.
| Quadrant | # 1 sec bins | Bins with >0 counts | Bins with >2000 counts | High rate bins dominated by noise | Noise dominated (total time) | Noise dominated (detector-on time) | Marked lightcurve |
|---|---|---|---|---|---|---|---|
| A | 7147 | 5506 | 6 | 6 | 0.08% | 0.11% | 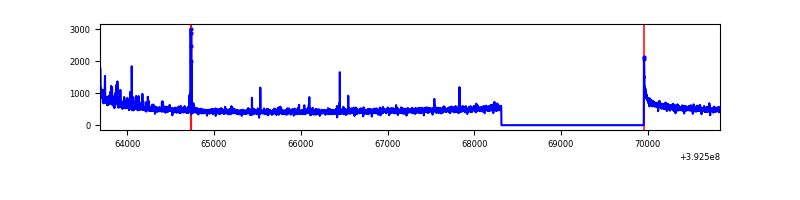 |
| B | 7147 | 5506 | 449 | 449 | 6.28% | 8.15% | 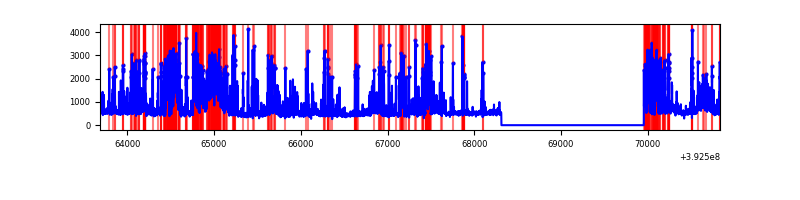 |
| C | 7147 | 5506 | 65 | 65 | 0.91% | 1.18% | 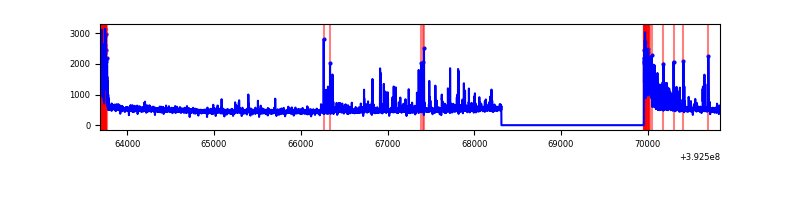 |
| D | 7147 | 5506 | 1196 | 1196 | 16.73% | 21.72% | 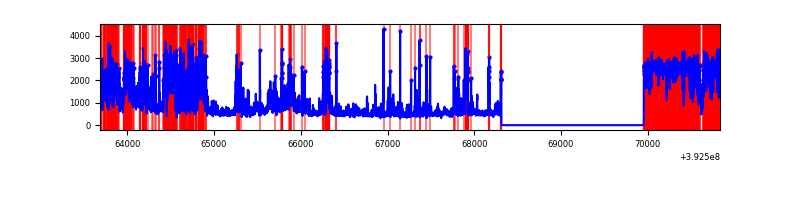 |
Top three noisy pixels from each quadrant. If the there are fewer than three noisy pixels in the level2.evt file, extra rows are filled as -1
| Pixel properties | Quadrant properties | ||||||
|---|---|---|---|---|---|---|---|
| Quadrant | DetID | PixID | Counts | Sigma | Mean | Median | Sigma |
| A | 10 | 83 | 200476 | 1567.14 | 628 | 616 | 127.5 |
| A | 15 | 223 | 56714 | 439.87 | 628 | 616 | 127.5 |
| A | 9 | 143 | 32695 | 251.54 | 628 | 616 | 127.5 |
| B | 5 | 236 | 1080875 | 9374.75 | 603 | 587 | 115.2 |
| B | 5 | 255 | 552909 | 4793.05 | 603 | 587 | 115.2 |
| B | 0 | 213 | 364147 | 3154.98 | 603 | 587 | 115.2 |
| C | 0 | 10 | 442945 | 3078.73 | 613 | 616 | 143.7 |
| C | 15 | 214 | 232849 | 1616.4 | 613 | 616 | 143.7 |
| C | 12 | 250 | 8312 | 53.57 | 613 | 616 | 143.7 |
| D | 12 | 227 | 3185026 | 23373.81 | 555 | 537 | 136.2 |
| D | 12 | 235 | 558321 | 4094.08 | 555 | 537 | 136.2 |
| D | 12 | 6 | 223783 | 1638.6 | 555 | 537 | 136.2 |
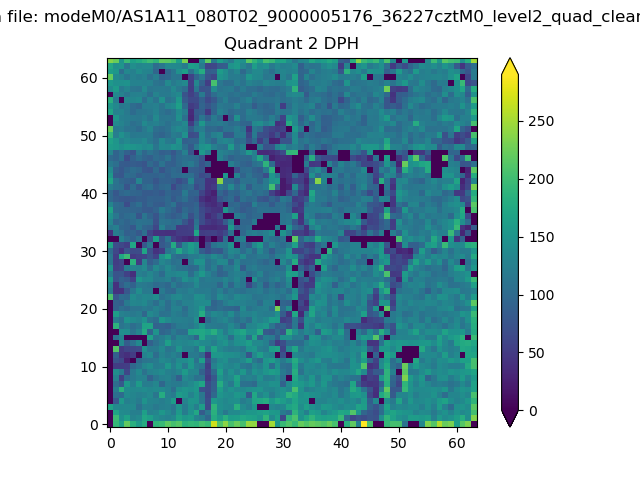
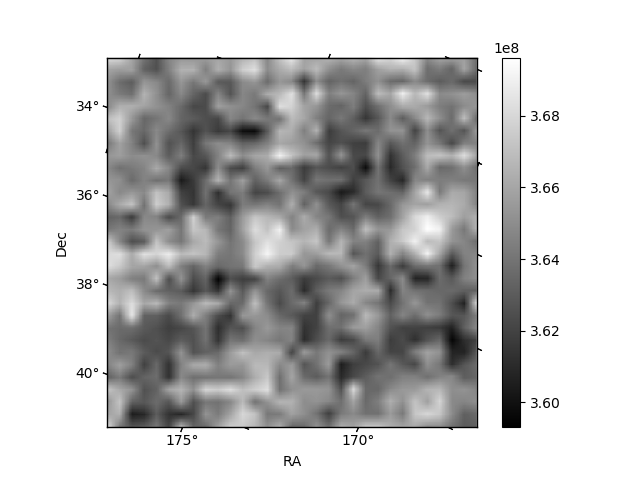
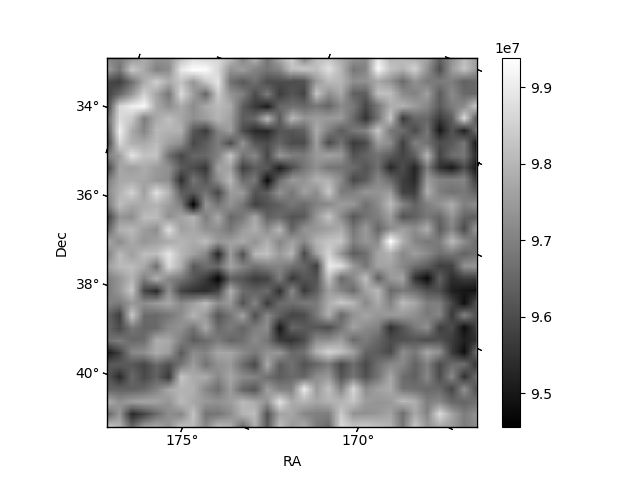
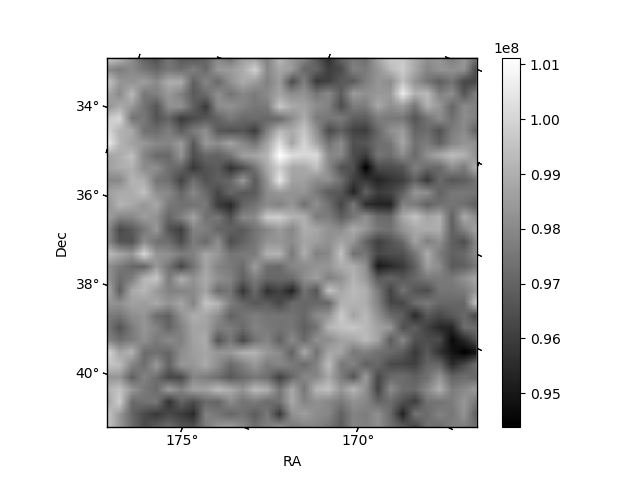
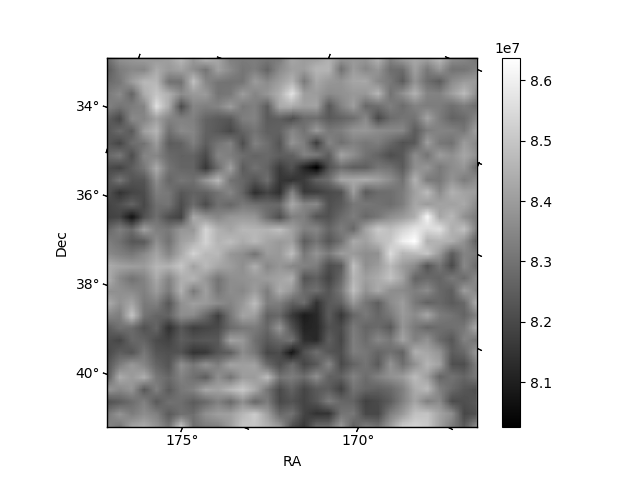
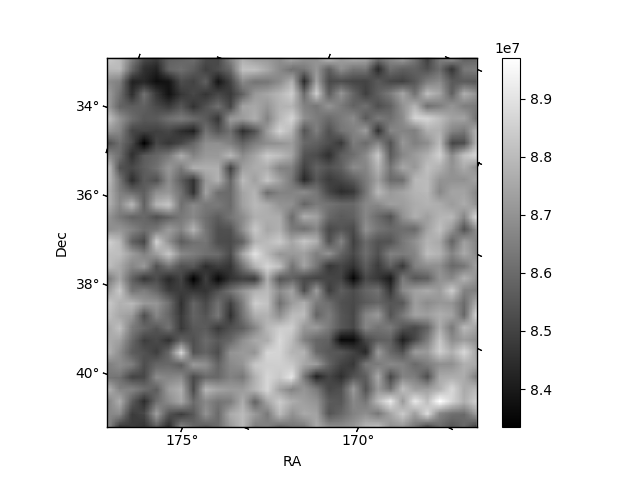
Histogram calculated using DETX and DETY for each event in the final _common_clean file
| Quadrant A | 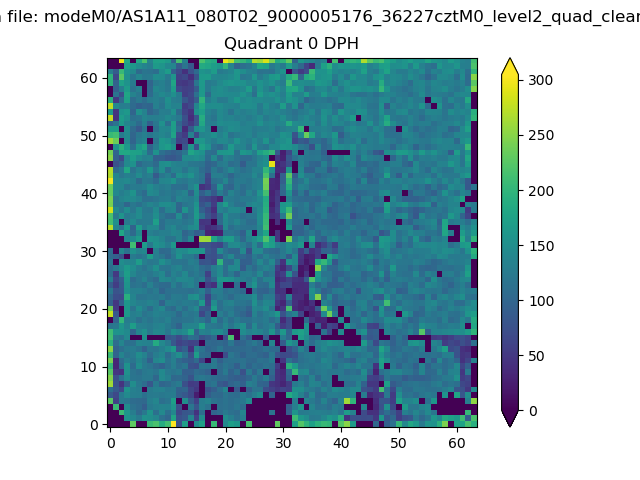 |
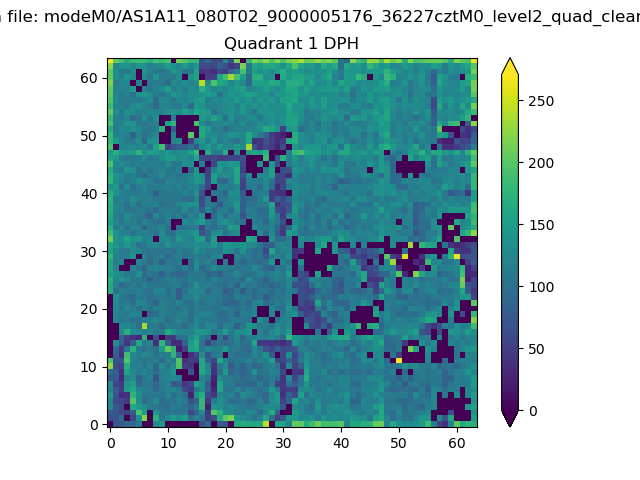 |
Quadrant B |
|---|---|---|---|
| Quadrant D | 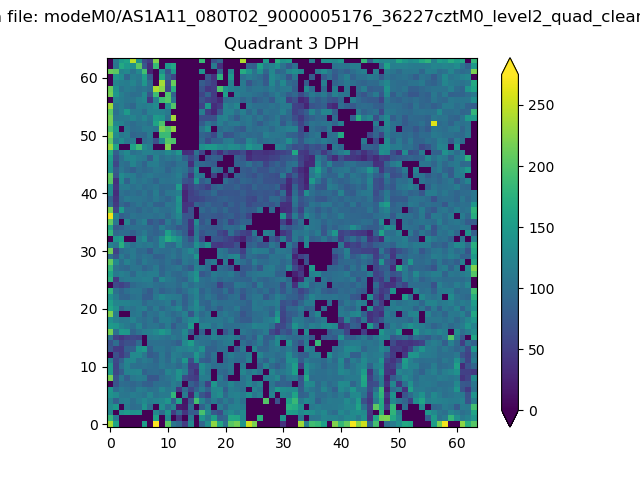 |
 |
Quadrant C |
| Plot type | Count rate plots | Images |
|---|---|---|
| Comparison with Poisson distribution Blue bars denote a histogram of data divided into 1 sec bins. Red curve is a Poisson curve with rate = median count rate of data. |
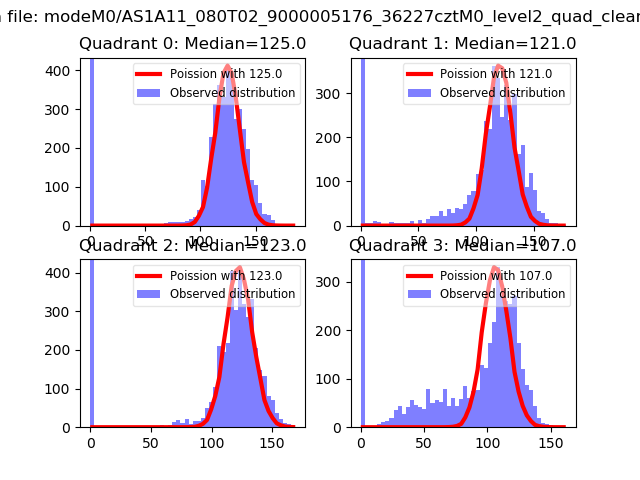 |
 |
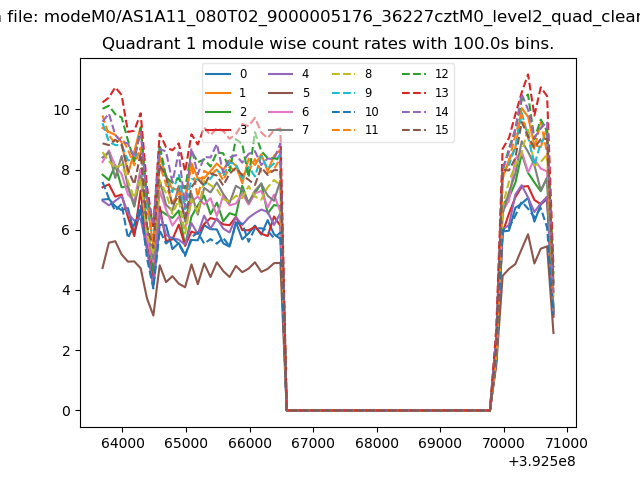
| Quadrant-wise count rates Data is divided into 100 sec bins |
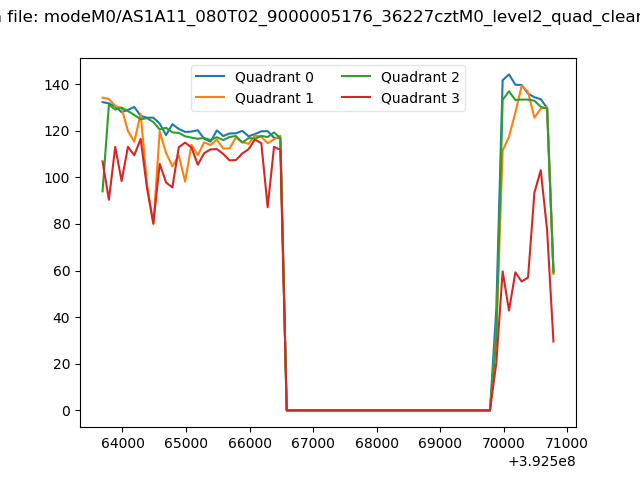 |
|
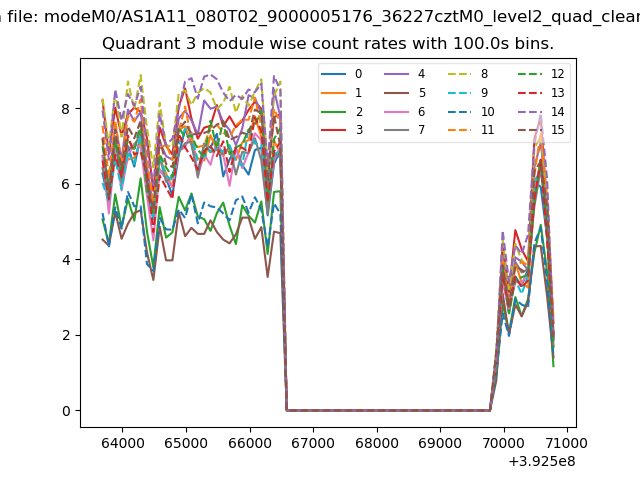
| Module-wise count rates for Quadrant A Data is divided into 100 sec bins |
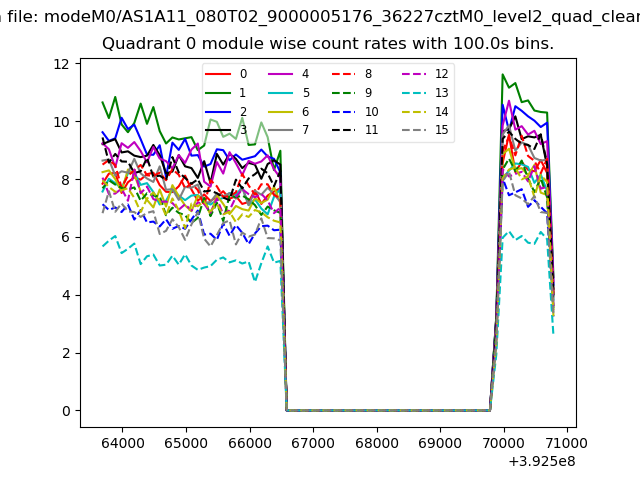 |
 |
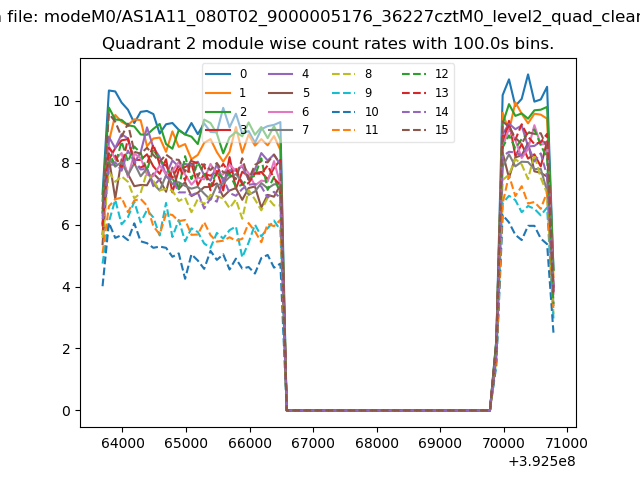
| Module-wise count rates for Quadrant B Data is divided into 100 sec bins |
 |
 |
| Module-wise count rates for Quadrant C Data is divided into 100 sec bins |
 |
 |
| Module-wise count rates for Quadrant D Data is divided into 100 sec bins |
 |
 |
| Parameter | Plot |
|---|---|
| CZT HV Monitor | 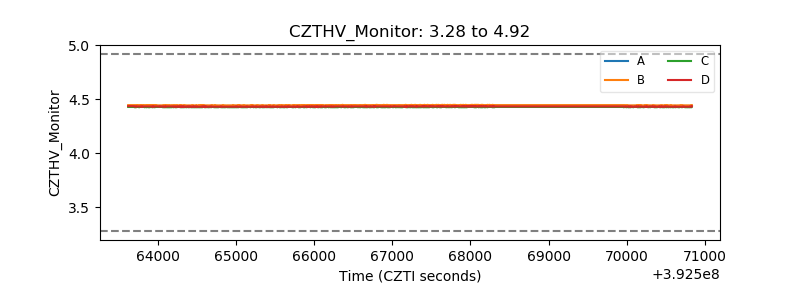 |
| D_VDD | 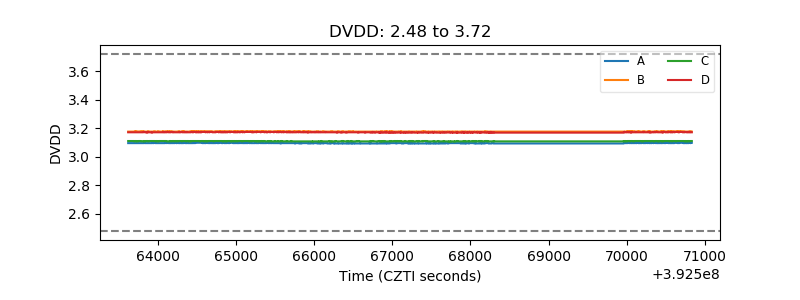 |
| Temperature 1 | 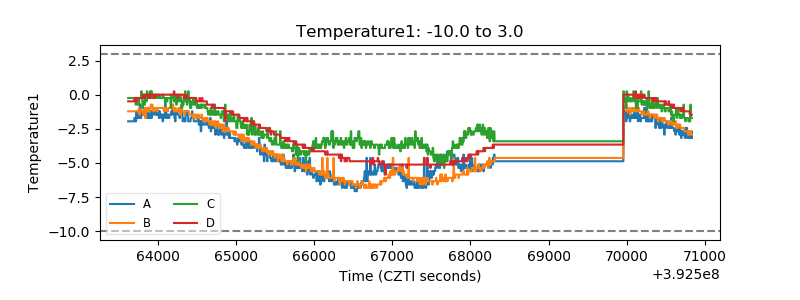 |
| Veto HV Monitor | 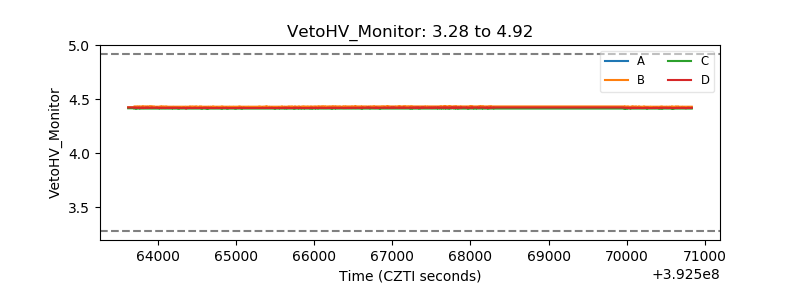 |
| Veto LLD | 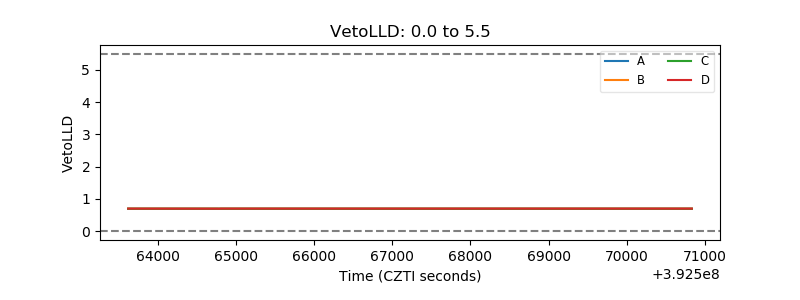 |
| Alpha Counter | 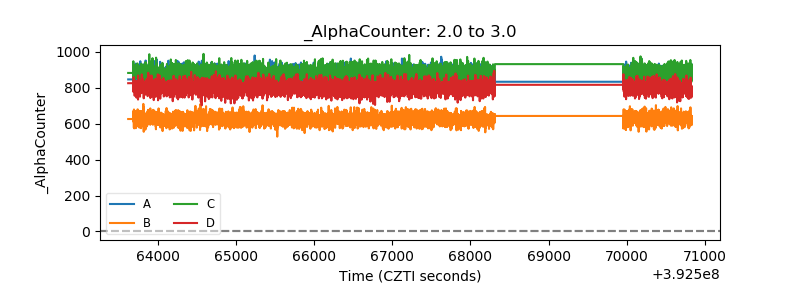 |
| _CPM_Rate | 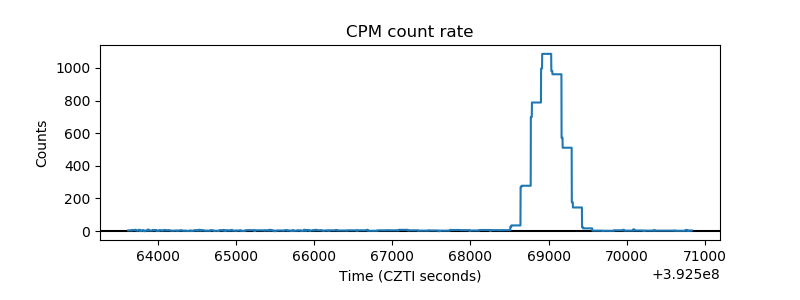 |
| CZT Counter | 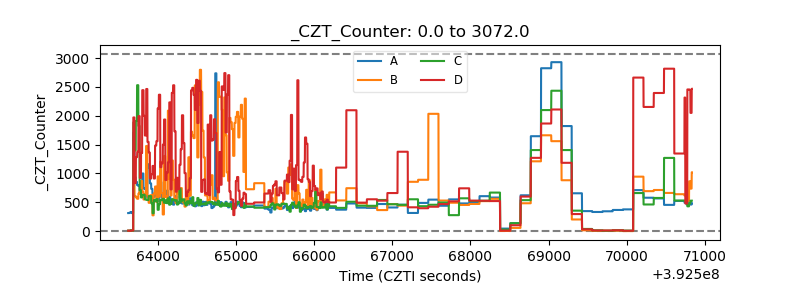 |
| +2.5 Volts monitor | 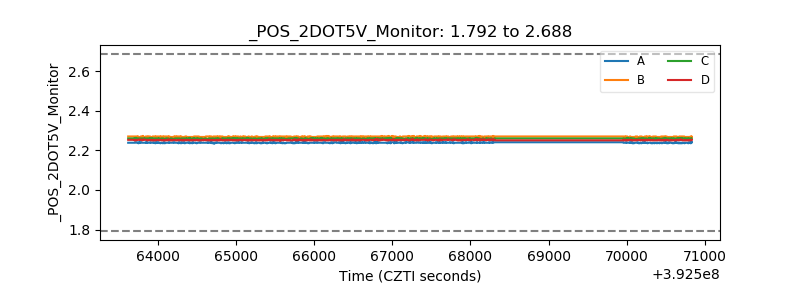 |
| +5 Volts monitor | 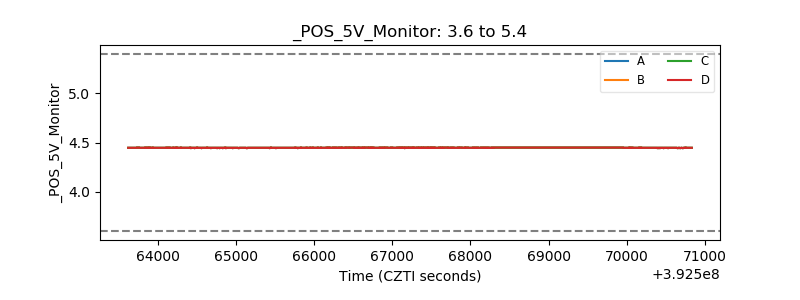 |
| _ROLL_ROT | 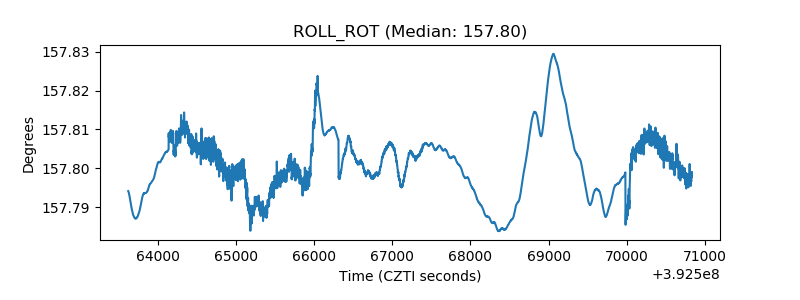 |
| _Roll_DEC |  |
| _Roll_RA | 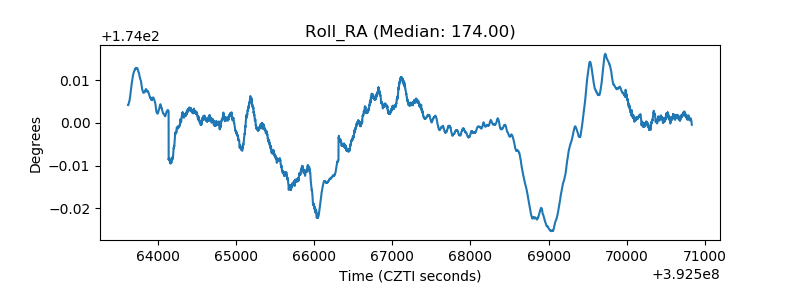 |
| Veto Counter | 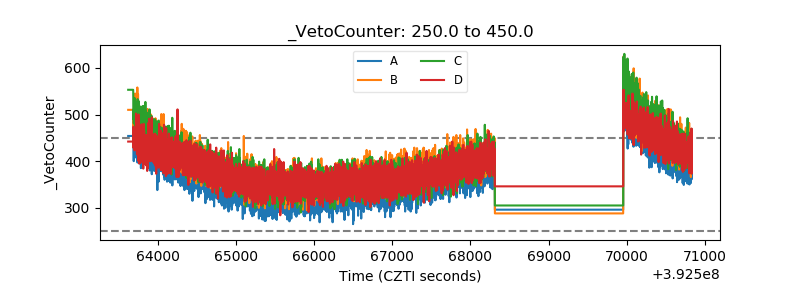 |