| Param | Original file | Final file |
|---|---|---|
| Filename | modeM0/AS1A11_080T02_9000005176_36223cztM0_level2.evt | modeM0/AS1A11_080T02_9000005176_36223cztM0_level2_quad_clean.evt |
| Size (bytes) | 619,804,800 | 79,548,480 |
| Size | 591.1 MB | 75.9 MB |
| Events in quadrant A | 3,915,245 | 517,880 |
| Events in quadrant B | 4,395,261 | 509,247 |
| Events in quadrant C | 3,133,904 | 521,886 |
| Events in quadrant D | 6,926,881 | 446,257 |
| Mode M9 | |||
|---|---|---|---|
| Quadrant | BADHDUFLAG | Total packets | Discarded packets |
| A | 0 | 19 | 0 |
| B | 0 | 19 | 0 |
| C | 0 | 19 | 0 |
| D | 0 | 20 | 0 |
| Mode M0 | |||
|---|---|---|---|
| Quadrant | BADHDUFLAG | Total packets | Discarded packets |
| A | 0 | 15415 | 3 |
| B | 0 | 16789 | 2 |
| C | 0 | 12746 | 2 |
| D | 0 | 24585 | 2 |
| Mode SS | |||
|---|---|---|---|
| Quadrant | BADHDUFLAG | Total packets | Discarded packets |
| A | 0 | 122 | 0 |
| B | 0 | 122 | 0 |
| C | 0 | 122 | 0 |
| D | 0 | 122 | 0 |
| Quadrant | Total seconds | Saturated seconds | Saturation percentage |
|---|---|---|---|
| A | 5903 | 53 | 0.897849% |
| B | 5903 | 458 | 7.758767% |
| C | 5903 | 41 | 0.694562% |
| D | 5903 | 1086 | 18.397425% |
Noise dominated data is calculated using 1-second bins in cleaned event files. If a bin has >2000 counts, and if more than 50% of those come from <1% of pixels, then it is considered to be noise-dominated and hence unusable.
| Quadrant | # 1 sec bins | Bins with >0 counts | Bins with >2000 counts | High rate bins dominated by noise | Noise dominated (total time) | Noise dominated (detector-on time) | Marked lightcurve |
|---|---|---|---|---|---|---|---|
| A | 7216 | 5904 | 27 | 27 | 0.37% | 0.46% | 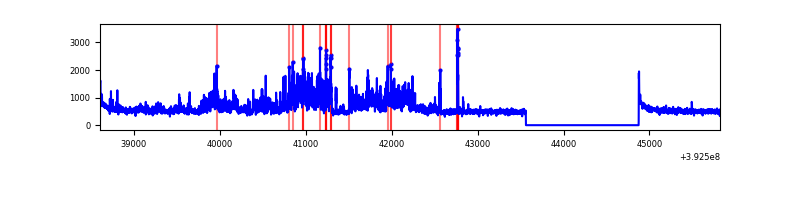 |
| B | 7216 | 5904 | 319 | 319 | 4.42% | 5.40% | 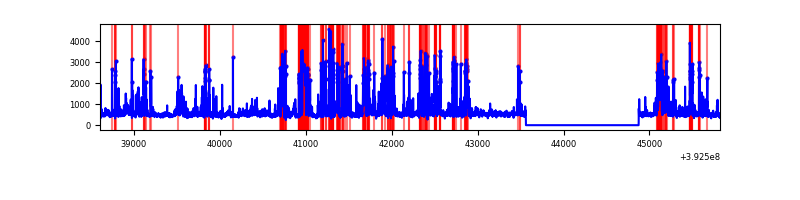 |
| C | 7216 | 5904 | 34 | 34 | 0.47% | 0.58% | 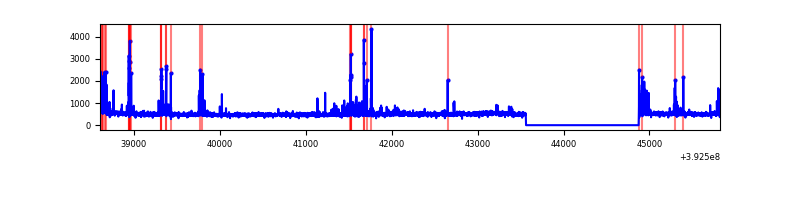 |
| D | 7216 | 5904 | 1034 | 1034 | 14.33% | 17.51% | 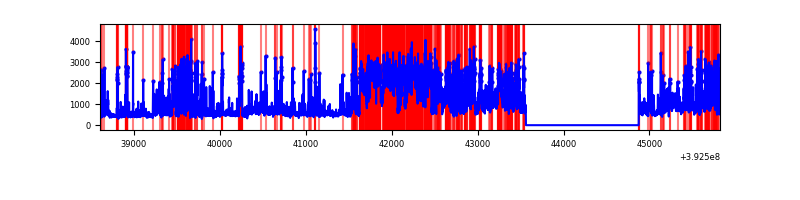 |
Top three noisy pixels from each quadrant. If the there are fewer than three noisy pixels in the level2.evt file, extra rows are filled as -1
| Pixel properties | Quadrant properties | ||||||
|---|---|---|---|---|---|---|---|
| Quadrant | DetID | PixID | Counts | Sigma | Mean | Median | Sigma |
| A | 15 | 223 | 984525 | 7145.8 | 681 | 665 | 137.7 |
| A | 10 | 83 | 199655 | 1445.27 | 681 | 665 | 137.7 |
| A | 9 | 143 | 60199 | 432.39 | 681 | 665 | 137.7 |
| B | 5 | 236 | 754290 | 5883.59 | 660 | 644 | 128.1 |
| B | 5 | 172 | 750262 | 5852.15 | 660 | 644 | 128.1 |
| B | 0 | 213 | 141753 | 1101.62 | 660 | 644 | 128.1 |
| C | 15 | 214 | 252159 | 1610.58 | 663 | 666 | 156.2 |
| C | 0 | 207 | 168331 | 1073.74 | 663 | 666 | 156.2 |
| C | 0 | 10 | 122037 | 777.27 | 663 | 666 | 156.2 |
| D | 12 | 227 | 2811720 | 18428.01 | 624 | 606 | 152.5 |
| D | 12 | 6 | 613052 | 4014.84 | 624 | 606 | 152.5 |
| D | 12 | 235 | 415830 | 2721.96 | 624 | 606 | 152.5 |
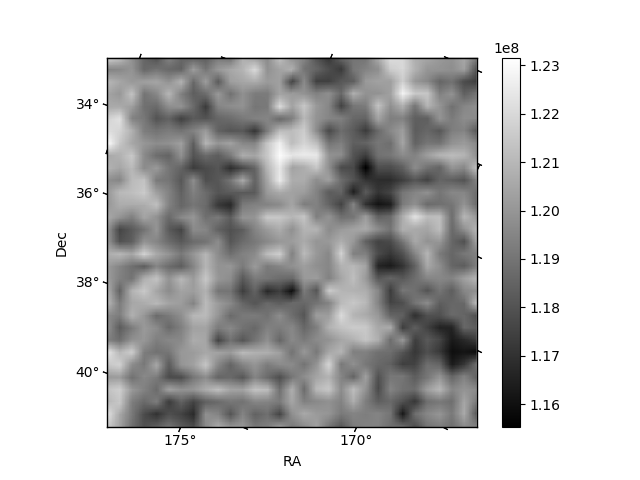
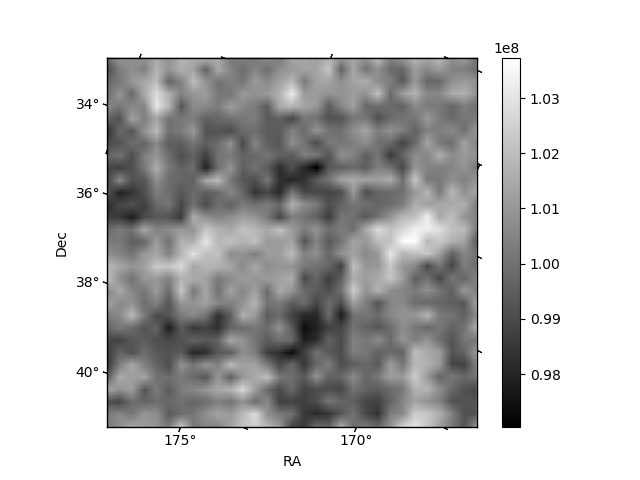
Histogram calculated using DETX and DETY for each event in the final _common_clean file
| Quadrant A | 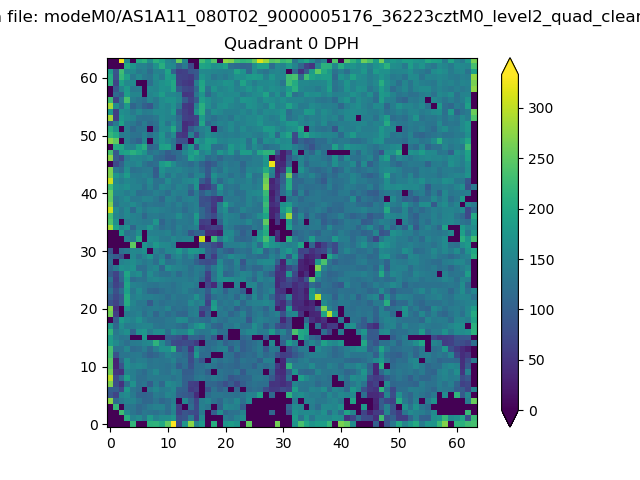 |
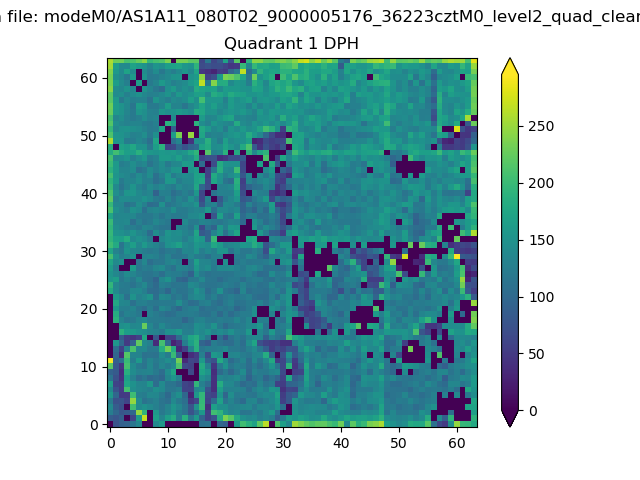 |
Quadrant B |
|---|---|---|---|
| Quadrant D | 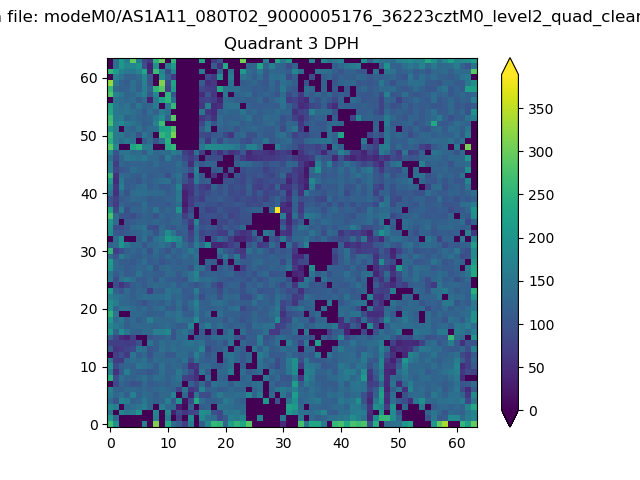 |
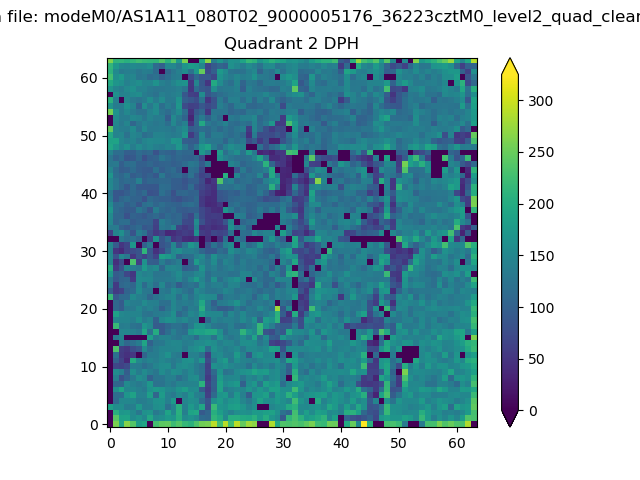 |
Quadrant C |
| Plot type | Count rate plots | Images |
|---|---|---|
| Comparison with Poisson distribution Blue bars denote a histogram of data divided into 1 sec bins. Red curve is a Poisson curve with rate = median count rate of data. |
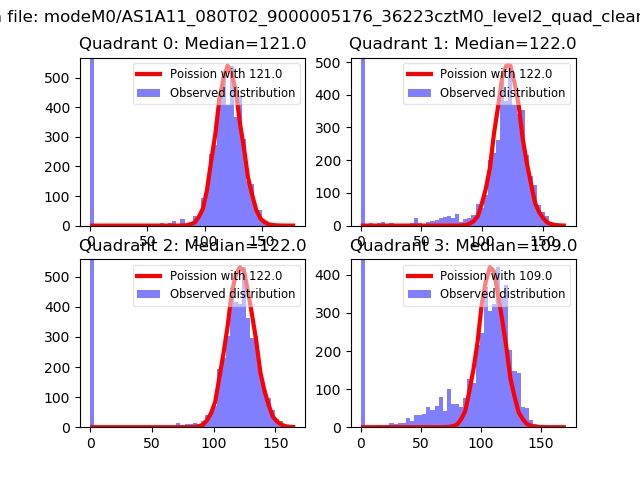 |
 |
| Quadrant-wise count rates Data is divided into 100 sec bins |
 |
|
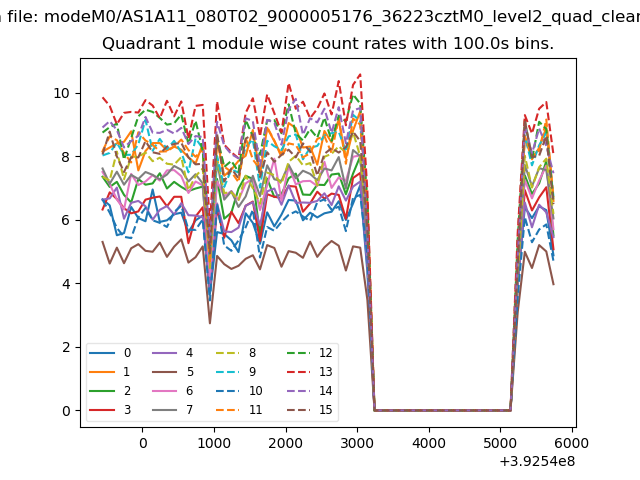
| Module-wise count rates for Quadrant A Data is divided into 100 sec bins |
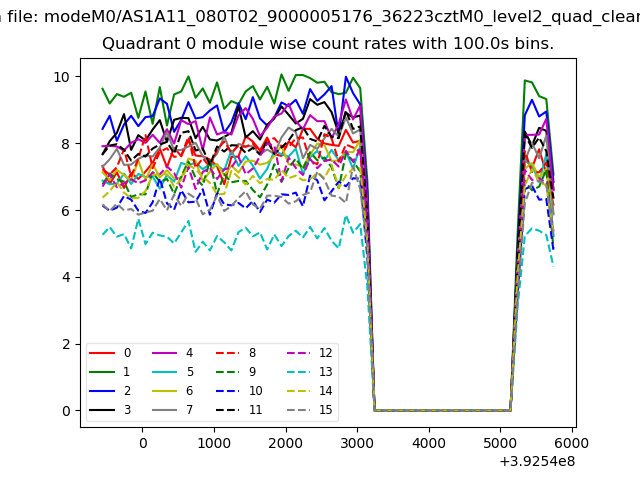 |
 |
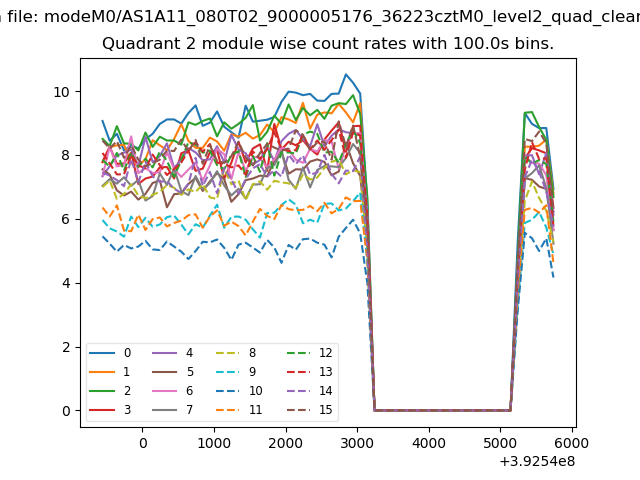
| Module-wise count rates for Quadrant B Data is divided into 100 sec bins |
 |
 |
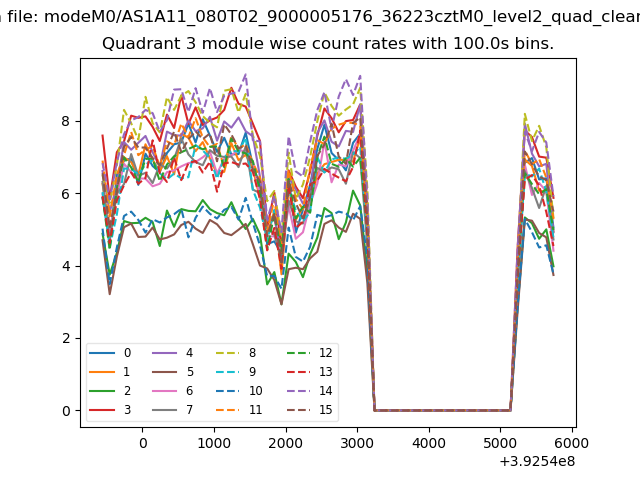
| Module-wise count rates for Quadrant C Data is divided into 100 sec bins |
 |
 |
| Module-wise count rates for Quadrant D Data is divided into 100 sec bins |
 |
 |
| Parameter | Plot |
|---|---|
| CZT HV Monitor | 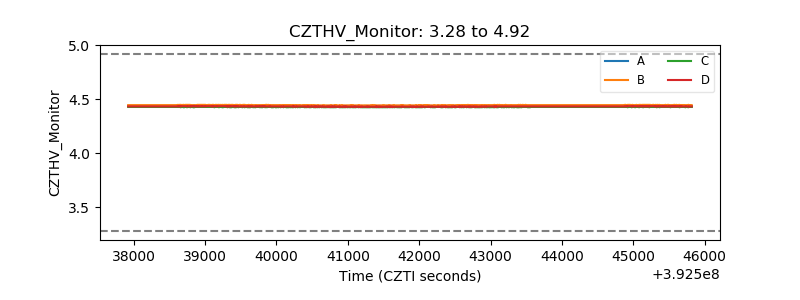 |
| D_VDD | 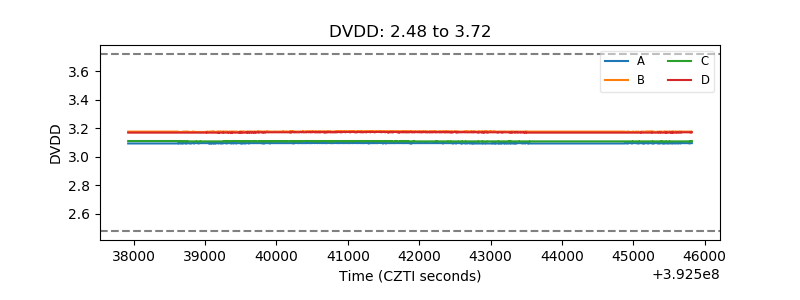 |
| Temperature 1 | 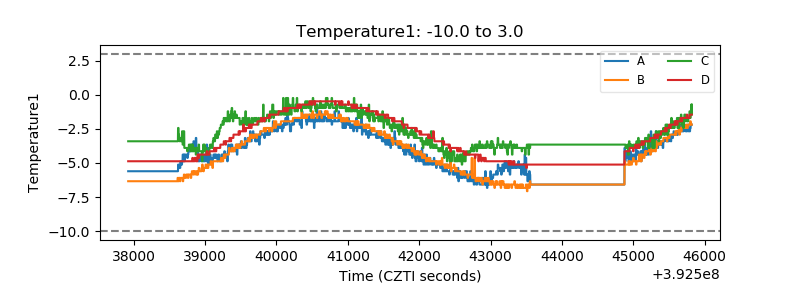 |
| Veto HV Monitor | 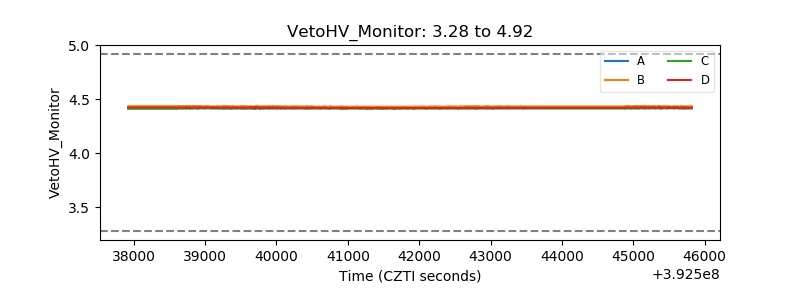 |
| Veto LLD | 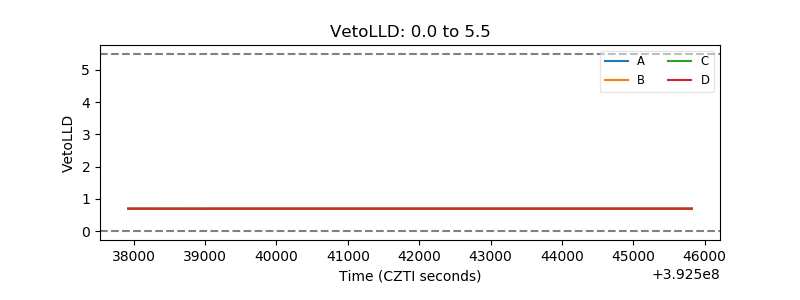 |
| Alpha Counter | 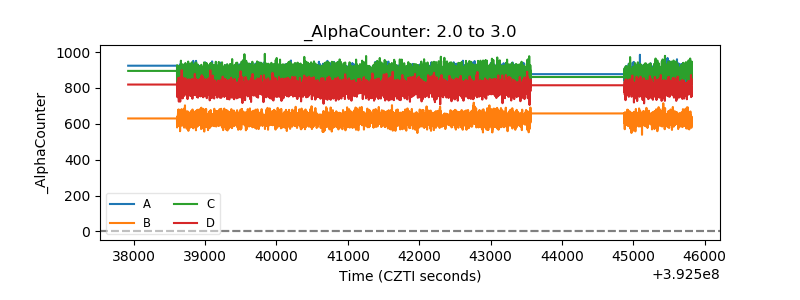 |
| _CPM_Rate | 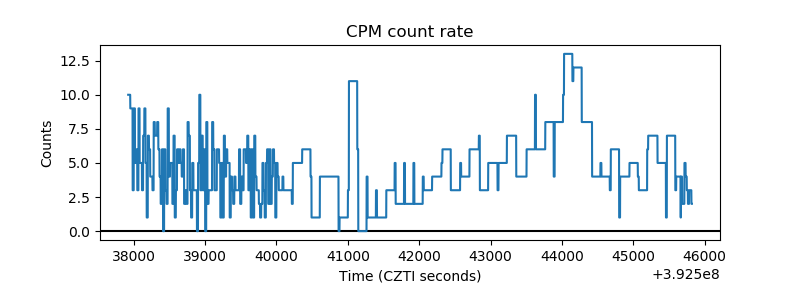 |
| CZT Counter | 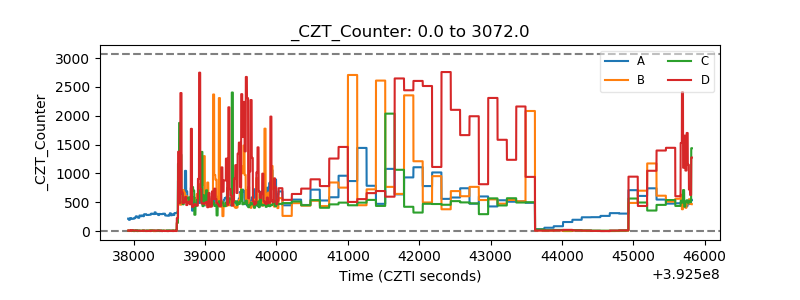 |
| +2.5 Volts monitor | 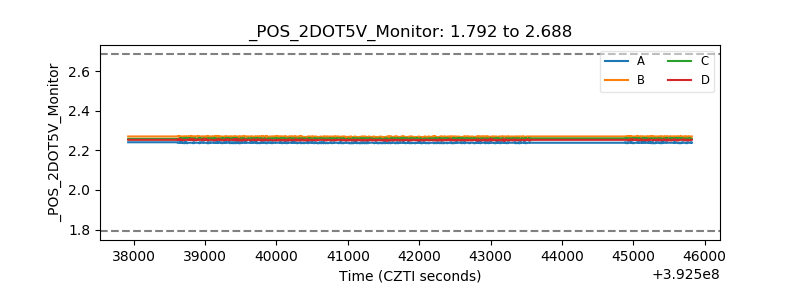 |
| +5 Volts monitor | 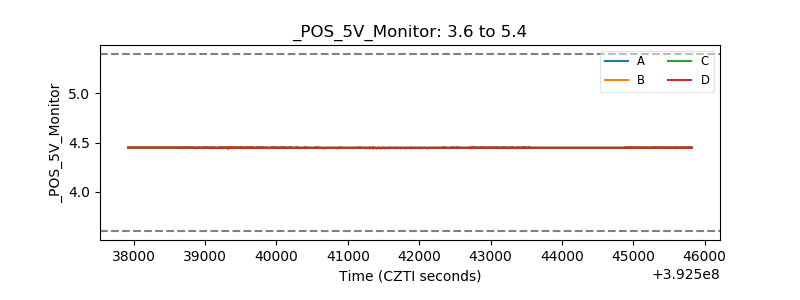 |
| _ROLL_ROT | 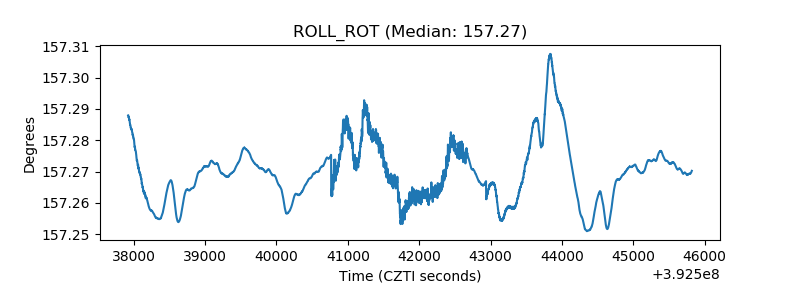 |
| _Roll_DEC | 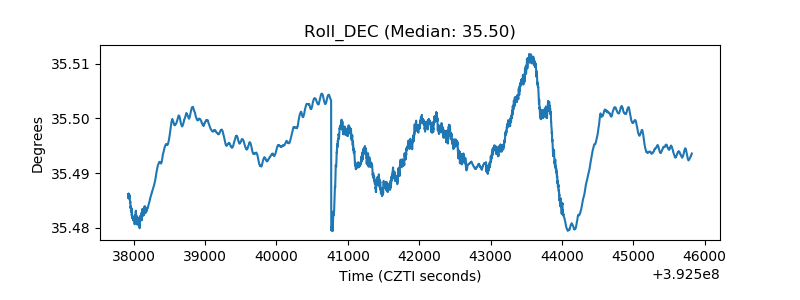 |
| _Roll_RA | 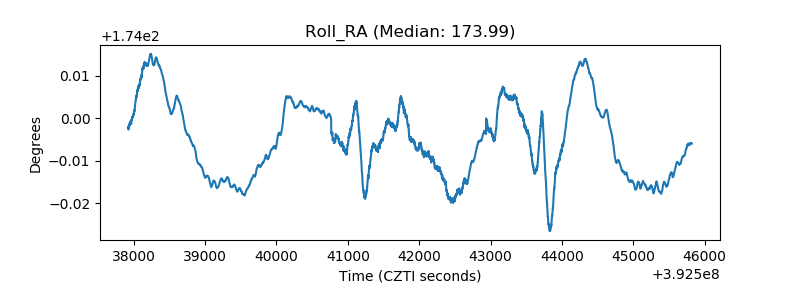 |
| Veto Counter | 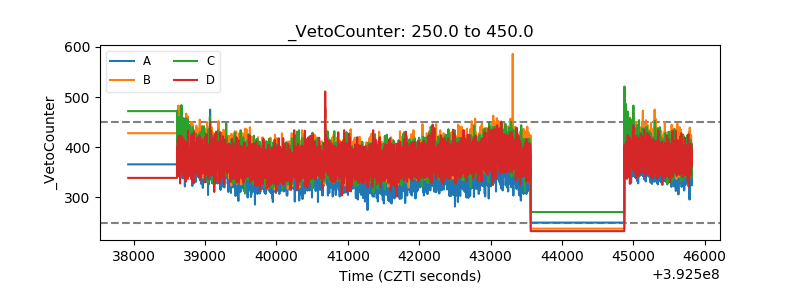 |