| Param | Original file | Final file |
|---|---|---|
| Filename | modeM0/AS1A11_080T02_9000005176_36220cztM0_level2.evt | modeM0/AS1A11_080T02_9000005176_36220cztM0_level2_quad_clean.evt |
| Size (bytes) | 475,185,600 | 49,400,640 |
| Size | 453.2 MB | 47.1 MB |
| Events in quadrant A | 2,804,263 | 288,101 |
| Events in quadrant B | 3,311,044 | 290,336 |
| Events in quadrant C | 2,818,438 | 284,494 |
| Events in quadrant D | 5,098,435 | 262,031 |
| Mode M9 | |||
|---|---|---|---|
| Quadrant | BADHDUFLAG | Total packets | Discarded packets |
| A | 0 | 40 | 0 |
| B | 0 | 40 | 0 |
| C | 0 | 40 | 0 |
| D | 0 | 40 | 0 |
| Mode M0 | |||
|---|---|---|---|
| Quadrant | BADHDUFLAG | Total packets | Discarded packets |
| A | 0 | 11603 | 3 |
| B | 0 | 13156 | 2 |
| C | 0 | 11443 | 2 |
| D | 0 | 18887 | 2 |
| Mode SS | |||
|---|---|---|---|
| Quadrant | BADHDUFLAG | Total packets | Discarded packets |
| A | 0 | 108 | 0 |
| B | 0 | 108 | 0 |
| C | 0 | 108 | 0 |
| D | 0 | 108 | 0 |
| Quadrant | Total seconds | Saturated seconds | Saturation percentage |
|---|---|---|---|
| A | 5288 | 13 | 0.245840% |
| B | 5288 | 159 | 3.006808% |
| C | 5288 | 61 | 1.153555% |
| D | 5288 | 602 | 11.384266% |
Noise dominated data is calculated using 1-second bins in cleaned event files. If a bin has >2000 counts, and if more than 50% of those come from <1% of pixels, then it is considered to be noise-dominated and hence unusable.
| Quadrant | # 1 sec bins | Bins with >0 counts | Bins with >2000 counts | High rate bins dominated by noise | Noise dominated (total time) | Noise dominated (detector-on time) | Marked lightcurve |
|---|---|---|---|---|---|---|---|
| A | 7261 | 5289 | 4 | 4 | 0.06% | 0.08% | 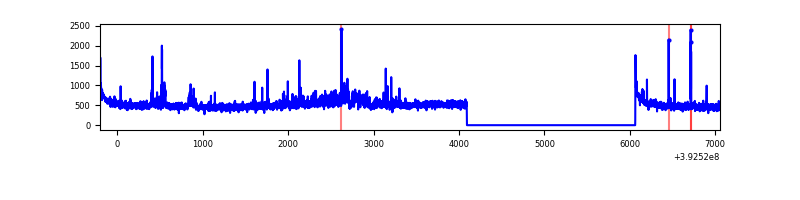 |
| B | 7261 | 5289 | 92 | 92 | 1.27% | 1.74% | 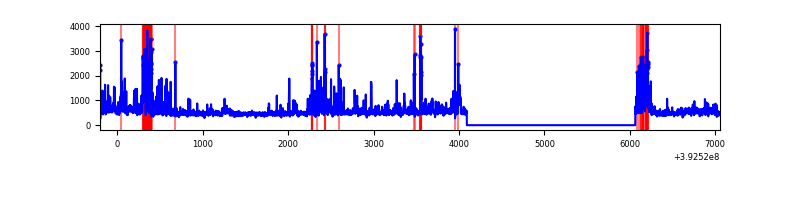 |
| C | 7261 | 5289 | 52 | 52 | 0.72% | 0.98% | 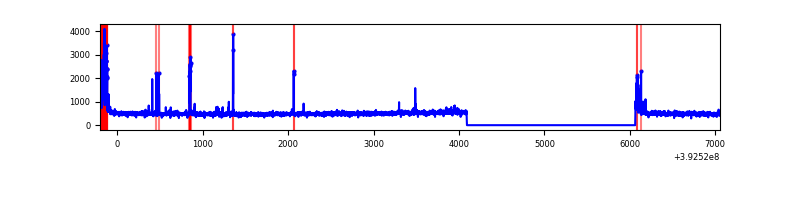 |
| D | 7261 | 5289 | 586 | 586 | 8.07% | 11.08% |  |
Top three noisy pixels from each quadrant. If the there are fewer than three noisy pixels in the level2.evt file, extra rows are filled as -1
| Pixel properties | Quadrant properties | ||||||
|---|---|---|---|---|---|---|---|
| Quadrant | DetID | PixID | Counts | Sigma | Mean | Median | Sigma |
| A | 10 | 83 | 180452 | 1448.91 | 615 | 603 | 124.1 |
| A | 15 | 223 | 155308 | 1246.35 | 615 | 603 | 124.1 |
| A | 7 | 16 | 48569 | 386.43 | 615 | 603 | 124.1 |
| B | 5 | 172 | 405826 | 3458.8 | 609 | 593 | 117.2 |
| B | 5 | 236 | 194596 | 1655.88 | 609 | 593 | 117.2 |
| B | 0 | 213 | 120990 | 1027.63 | 609 | 593 | 117.2 |
| C | 15 | 214 | 221282 | 1588.5 | 595 | 598 | 138.9 |
| C | 0 | 10 | 196149 | 1407.59 | 595 | 598 | 138.9 |
| C | 0 | 207 | 71562 | 510.8 | 595 | 598 | 138.9 |
| D | 12 | 227 | 1191173 | 8494.55 | 569 | 553 | 140.2 |
| D | 12 | 6 | 1063414 | 7583.05 | 569 | 553 | 140.2 |
| D | 12 | 235 | 208839 | 1486.03 | 569 | 553 | 140.2 |
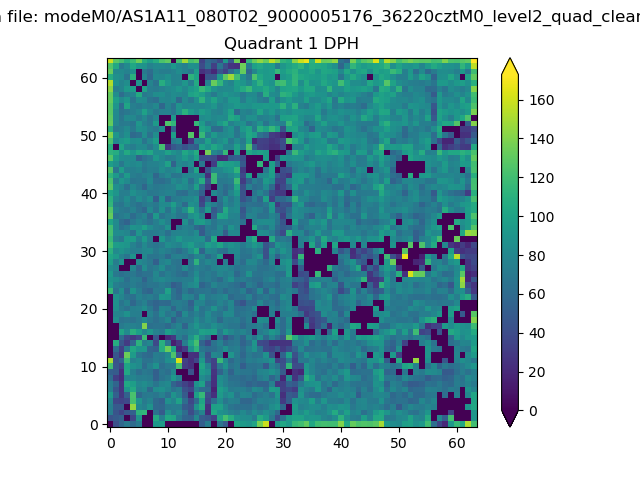
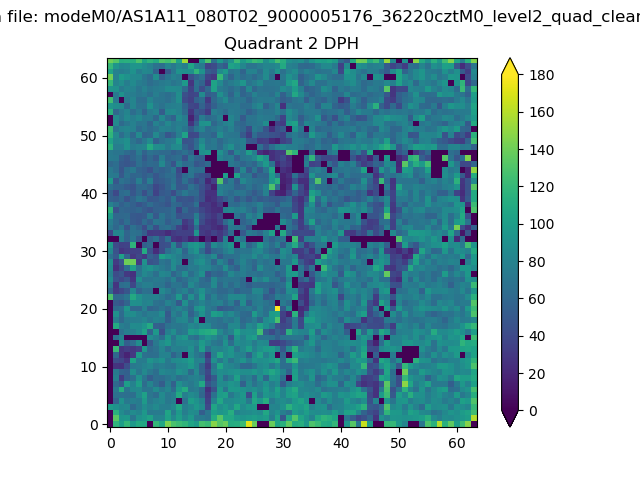
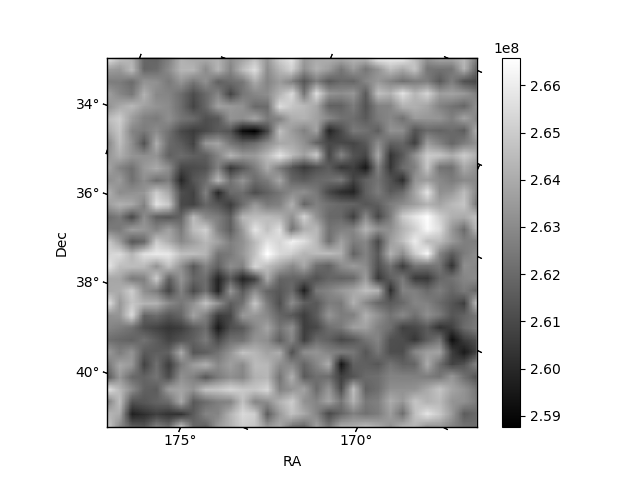
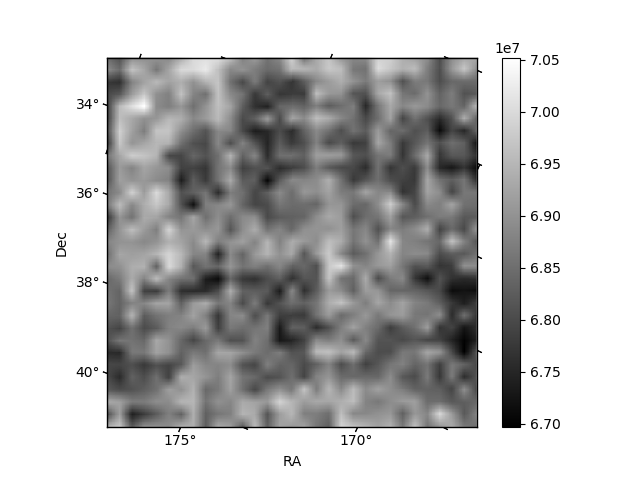
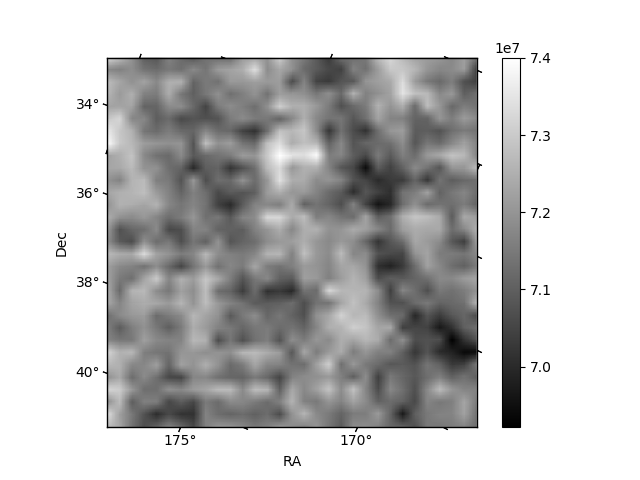
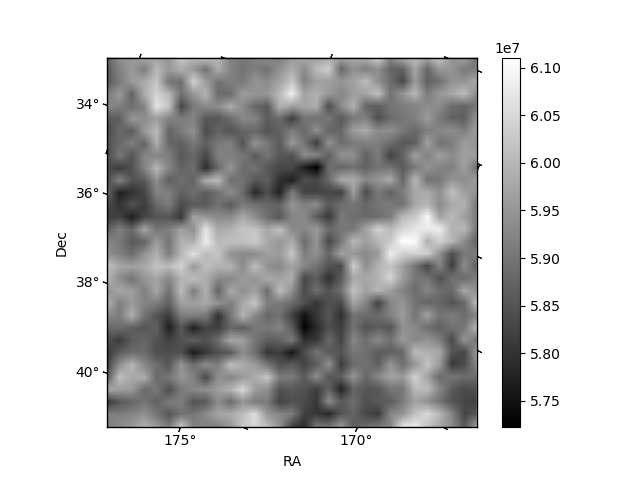
Histogram calculated using DETX and DETY for each event in the final _common_clean file
| Quadrant A | 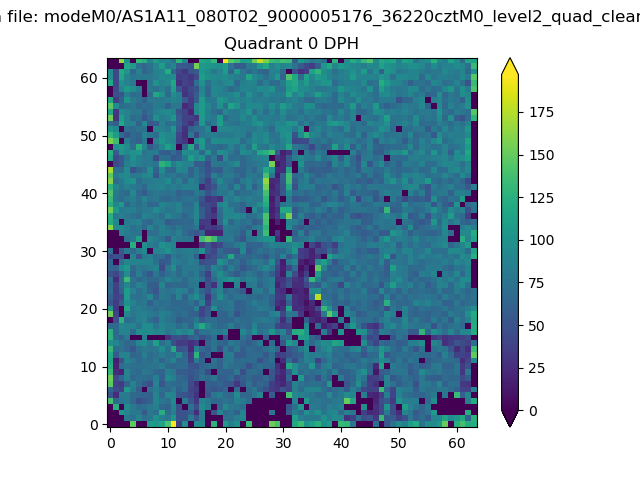 |
 |
Quadrant B |
|---|---|---|---|
| Quadrant D | 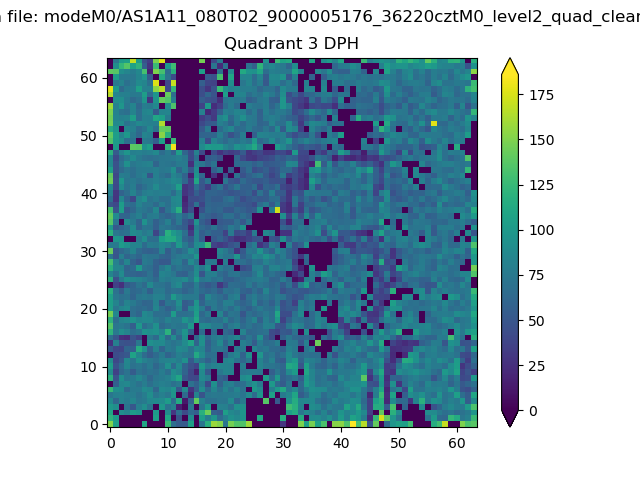 |
 |
Quadrant C |
| Plot type | Count rate plots | Images |
|---|---|---|
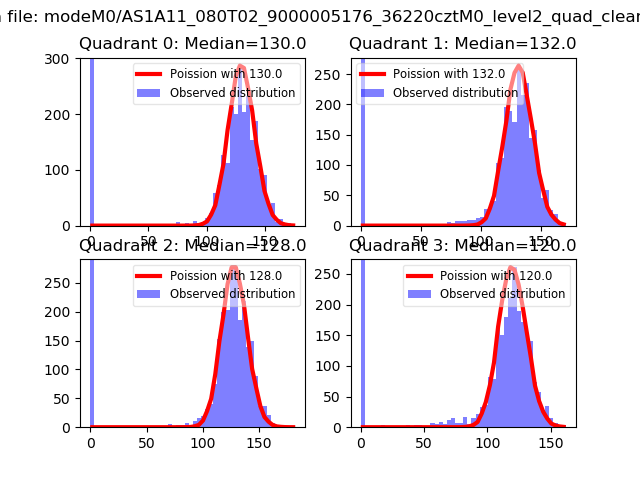
| Comparison with Poisson distribution Blue bars denote a histogram of data divided into 1 sec bins. Red curve is a Poisson curve with rate = median count rate of data. |
 |
 |
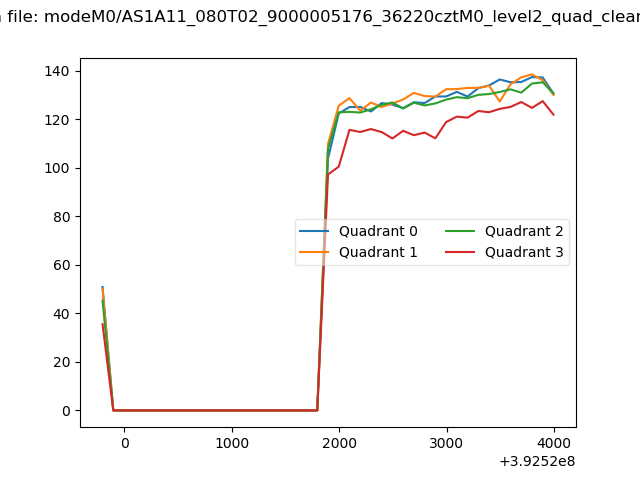
| Quadrant-wise count rates Data is divided into 100 sec bins |
 |
|
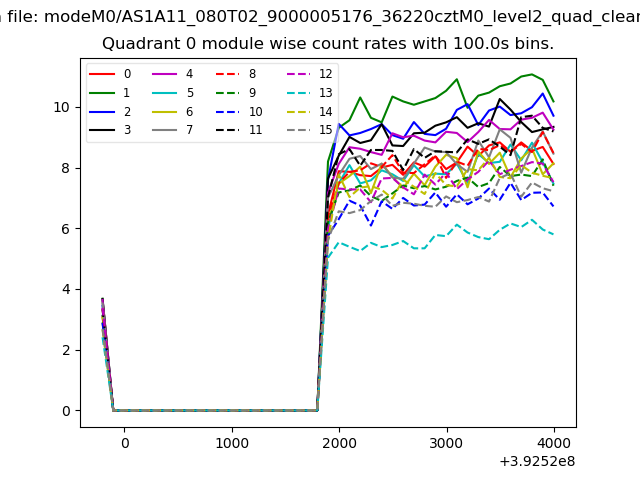
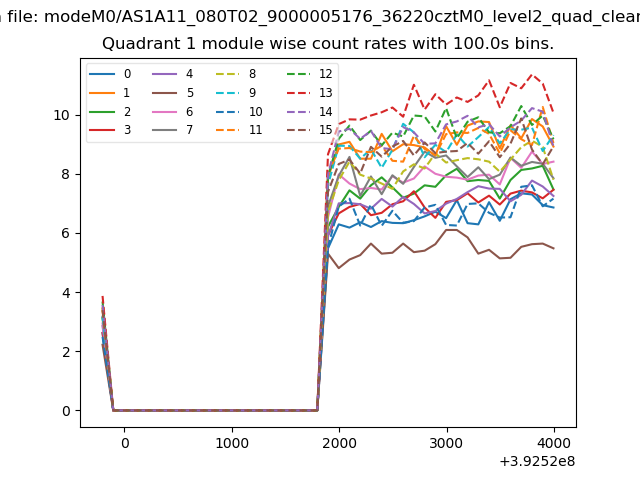
| Module-wise count rates for Quadrant A Data is divided into 100 sec bins |
 |
 |
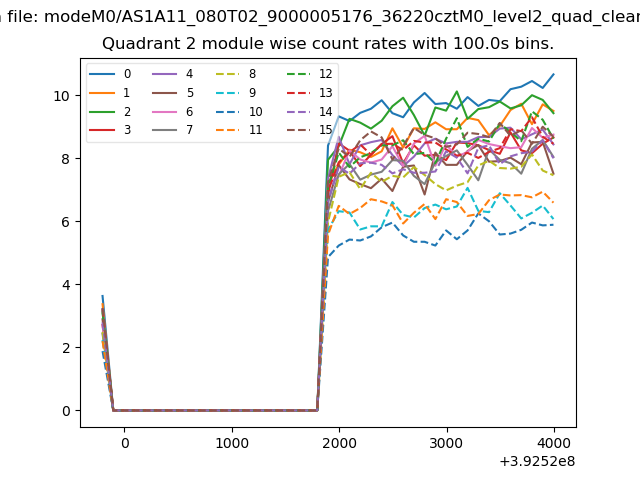
| Module-wise count rates for Quadrant B Data is divided into 100 sec bins |
 |
 |
| Module-wise count rates for Quadrant C Data is divided into 100 sec bins |
 |
 |
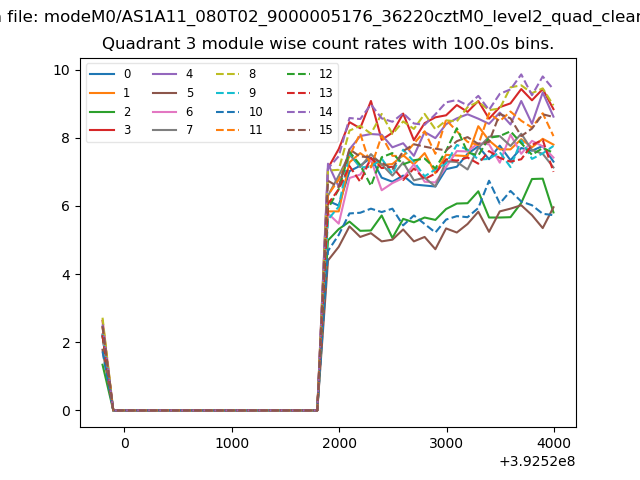
| Module-wise count rates for Quadrant D Data is divided into 100 sec bins |
 |
 |
| Parameter | Plot |
|---|---|
| CZT HV Monitor | 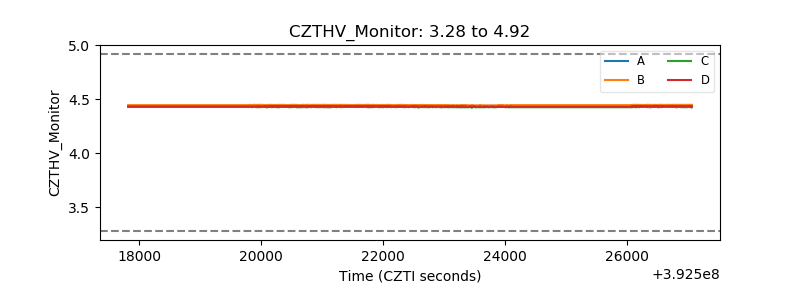 |
| D_VDD | 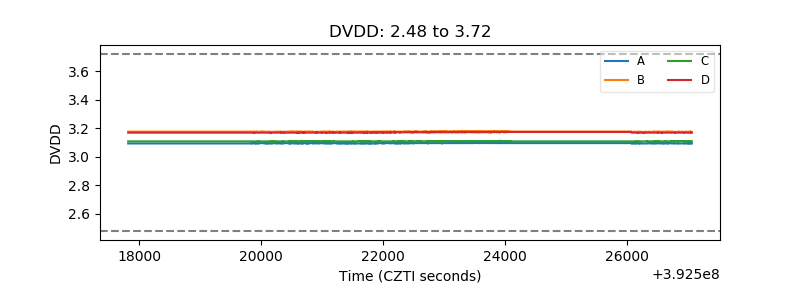 |
| Temperature 1 | 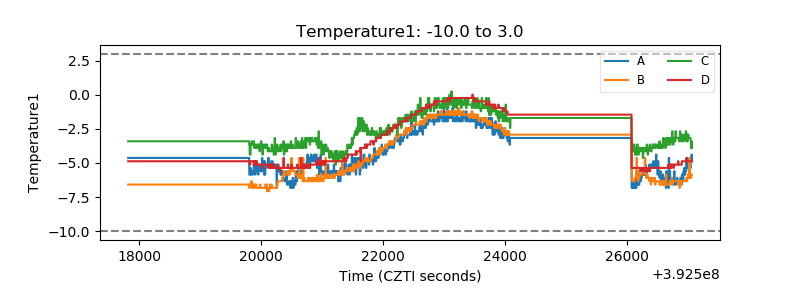 |
| Veto HV Monitor | 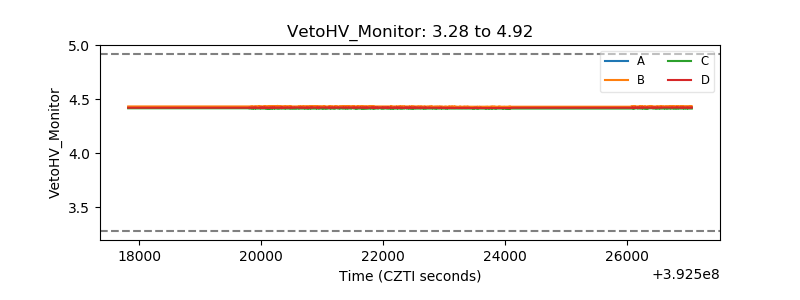 |
| Veto LLD | 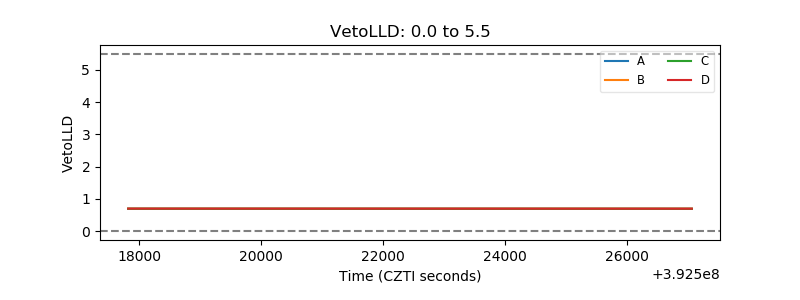 |
| Alpha Counter | 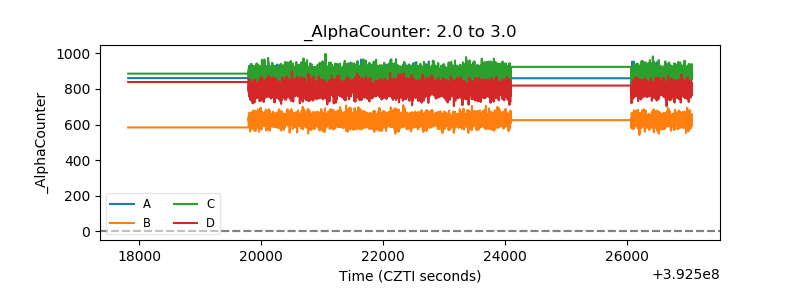 |
| _CPM_Rate | 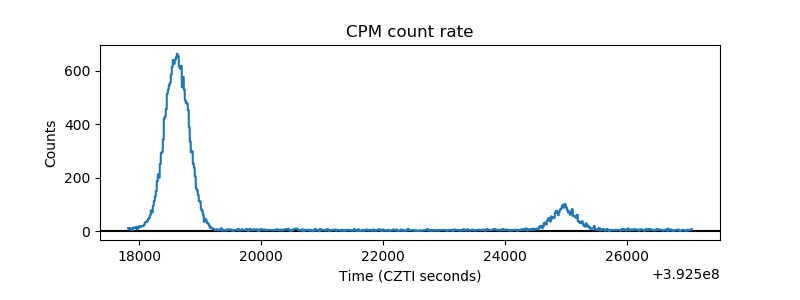 |
| CZT Counter | 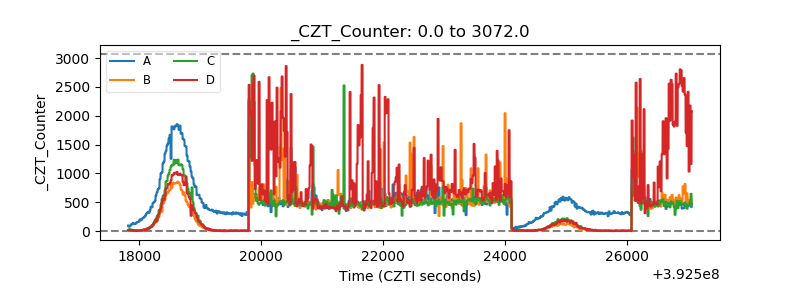 |
| +2.5 Volts monitor | 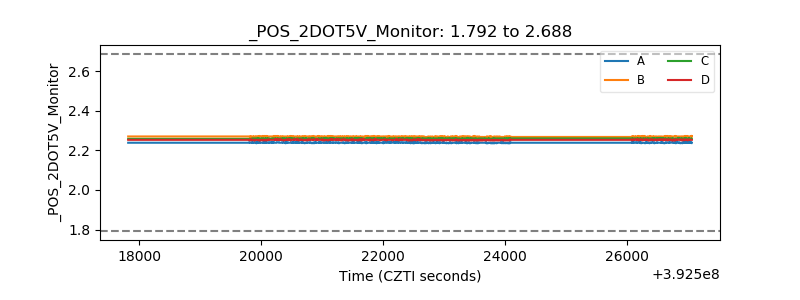 |
| +5 Volts monitor | 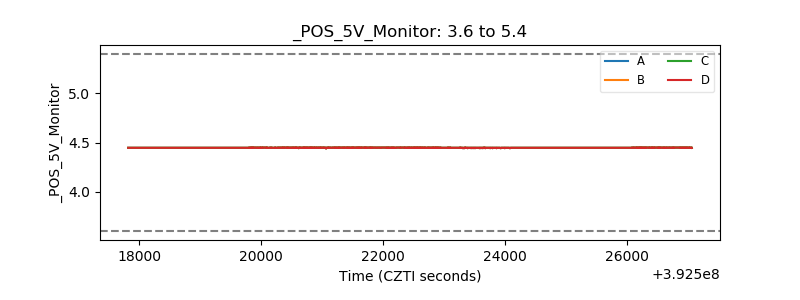 |
| _ROLL_ROT | 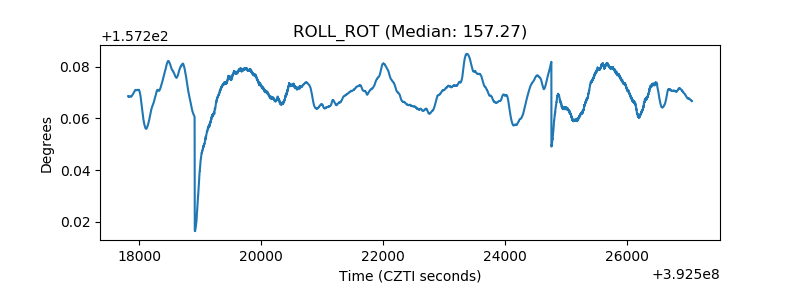 |
| _Roll_DEC | 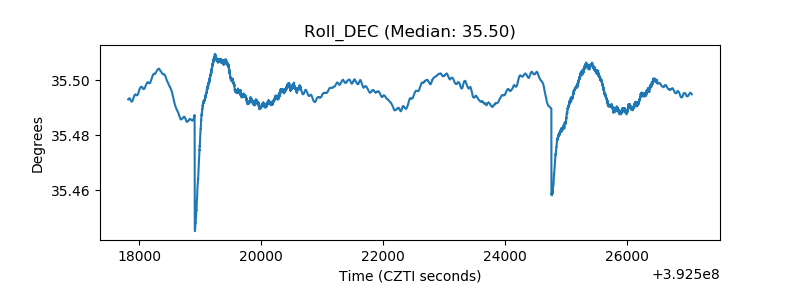 |
| _Roll_RA | 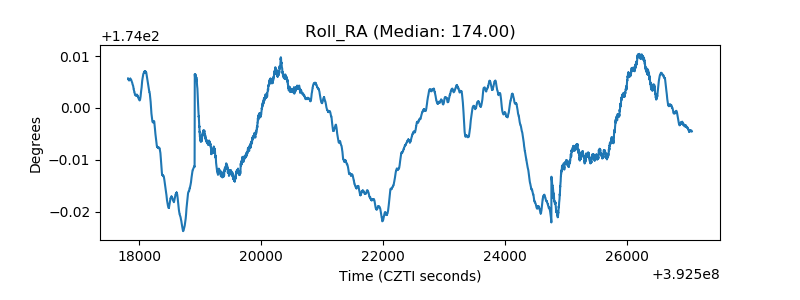 |
| Veto Counter | 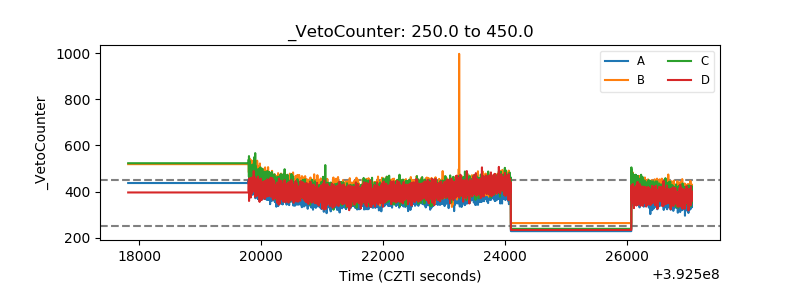 |