| Param | Original file | Final file |
|---|---|---|
| Filename | modeM0/AS1A11_080T02_9000005176_36219cztM0_level2.evt | modeM0/AS1A11_080T02_9000005176_36219cztM0_level2_quad_clean.evt |
| Size (bytes) | 543,997,440 | 47,727,360 |
| Size | 518.8 MB | 45.5 MB |
| Events in quadrant A | 2,652,996 | 286,380 |
| Events in quadrant B | 3,324,421 | 292,884 |
| Events in quadrant C | 3,063,229 | 279,484 |
| Events in quadrant D | 7,100,052 | 239,116 |
| Mode M9 | |||
|---|---|---|---|
| Quadrant | BADHDUFLAG | Total packets | Discarded packets |
| A | 0 | 32 | 0 |
| B | 0 | 32 | 0 |
| C | 0 | 32 | 0 |
| D | 0 | 33 | 0 |
| Mode M0 | |||
|---|---|---|---|
| Quadrant | BADHDUFLAG | Total packets | Discarded packets |
| A | 0 | 10927 | 3 |
| B | 0 | 13058 | 2 |
| C | 0 | 11993 | 2 |
| D | 0 | 24538 | 2 |
| Mode SS | |||
|---|---|---|---|
| Quadrant | BADHDUFLAG | Total packets | Discarded packets |
| A | 0 | 100 | 0 |
| B | 0 | 100 | 0 |
| C | 0 | 100 | 0 |
| D | 0 | 100 | 0 |
| Quadrant | Total seconds | Saturated seconds | Saturation percentage |
|---|---|---|---|
| A | 4945 | 14 | 0.283114% |
| B | 4945 | 148 | 2.992922% |
| C | 4945 | 130 | 2.628918% |
| D | 4945 | 1091 | 22.062690% |
Noise dominated data is calculated using 1-second bins in cleaned event files. If a bin has >2000 counts, and if more than 50% of those come from <1% of pixels, then it is considered to be noise-dominated and hence unusable.
| Quadrant | # 1 sec bins | Bins with >0 counts | Bins with >2000 counts | High rate bins dominated by noise | Noise dominated (total time) | Noise dominated (detector-on time) | Marked lightcurve |
|---|---|---|---|---|---|---|---|
| A | 7068 | 4946 | 4 | 4 | 0.06% | 0.08% | 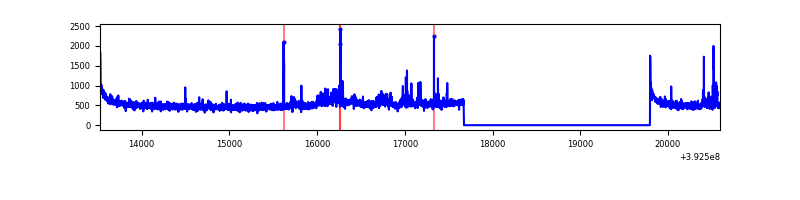 |
| B | 7068 | 4946 | 95 | 95 | 1.34% | 1.92% | 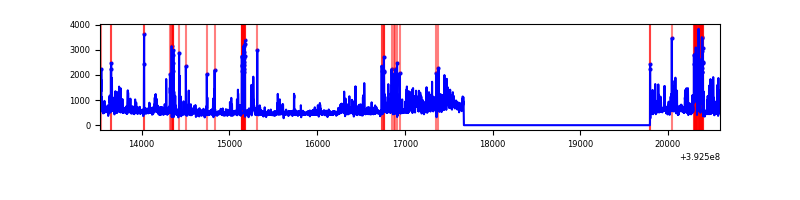 |
| C | 7068 | 4946 | 109 | 109 | 1.54% | 2.20% | 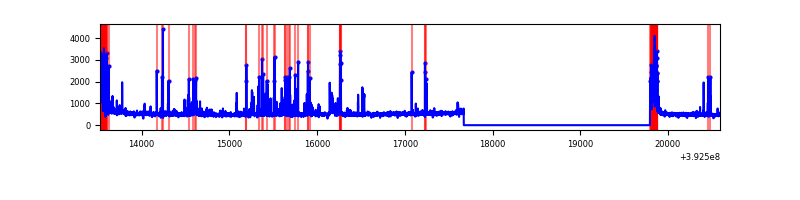 |
| D | 7068 | 4946 | 1053 | 1053 | 14.90% | 21.29% | 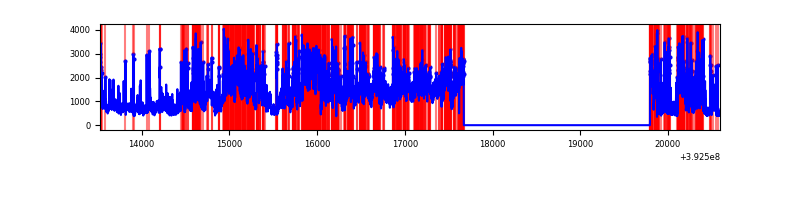 |
Top three noisy pixels from each quadrant. If the there are fewer than three noisy pixels in the level2.evt file, extra rows are filled as -1
| Pixel properties | Quadrant properties | ||||||
|---|---|---|---|---|---|---|---|
| Quadrant | DetID | PixID | Counts | Sigma | Mean | Median | Sigma |
| A | 10 | 83 | 173839 | 1473.95 | 587 | 576 | 117.6 |
| A | 15 | 223 | 140848 | 1193.3 | 587 | 576 | 117.6 |
| A | 7 | 16 | 32591 | 272.35 | 587 | 576 | 117.6 |
| B | 5 | 172 | 420638 | 3779.63 | 584 | 568 | 111.1 |
| B | 5 | 236 | 170567 | 1529.58 | 584 | 568 | 111.1 |
| B | 0 | 213 | 97727 | 874.2 | 584 | 568 | 111.1 |
| C | 0 | 10 | 409634 | 3078.19 | 568 | 572 | 132.9 |
| C | 15 | 214 | 204956 | 1537.99 | 568 | 572 | 132.9 |
| C | 0 | 207 | 193850 | 1454.41 | 568 | 572 | 132.9 |
| D | 12 | 227 | 3449108 | 26813.44 | 525 | 511 | 128.6 |
| D | 12 | 6 | 745749 | 5794.35 | 525 | 511 | 128.6 |
| D | 12 | 235 | 404227 | 3138.96 | 525 | 511 | 128.6 |
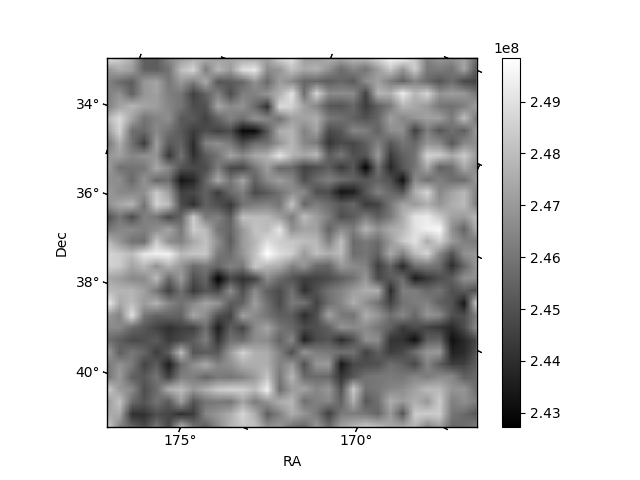
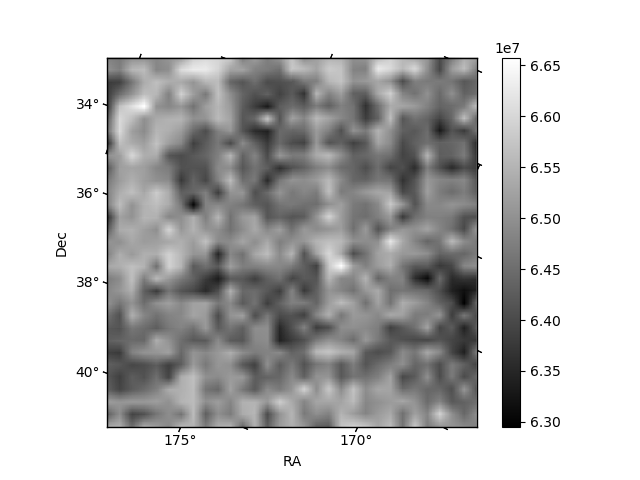
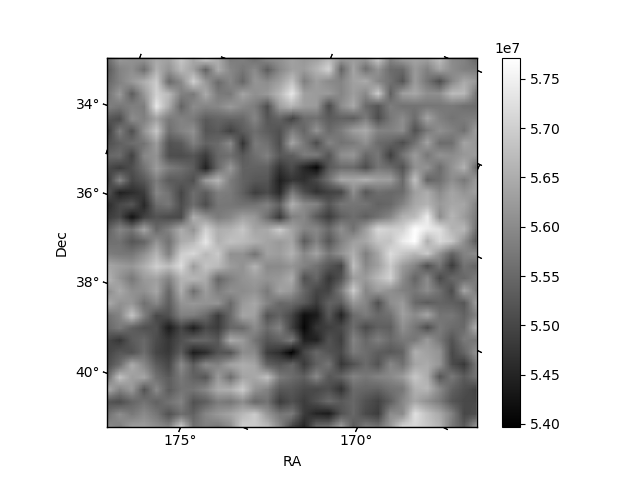
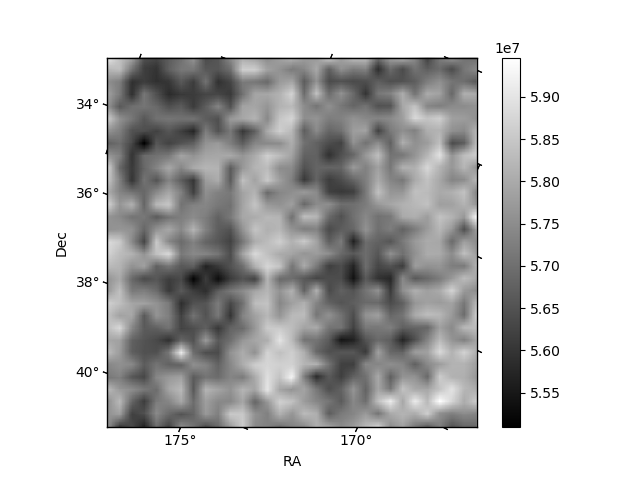
Histogram calculated using DETX and DETY for each event in the final _common_clean file
| Quadrant A | 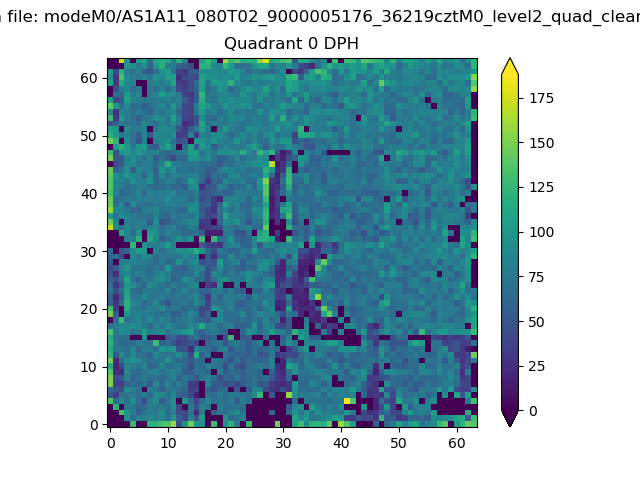 |
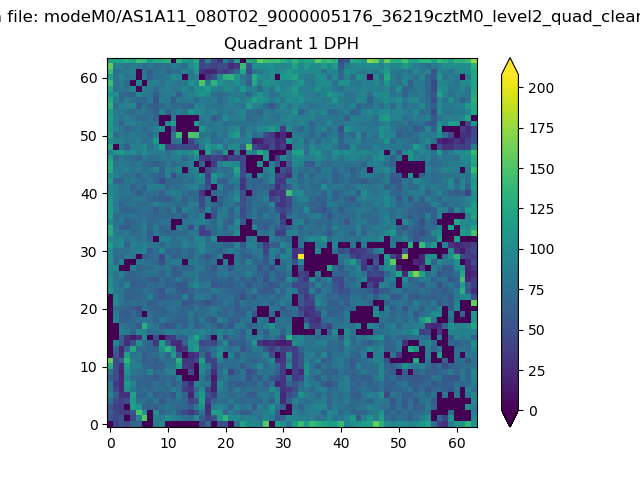 |
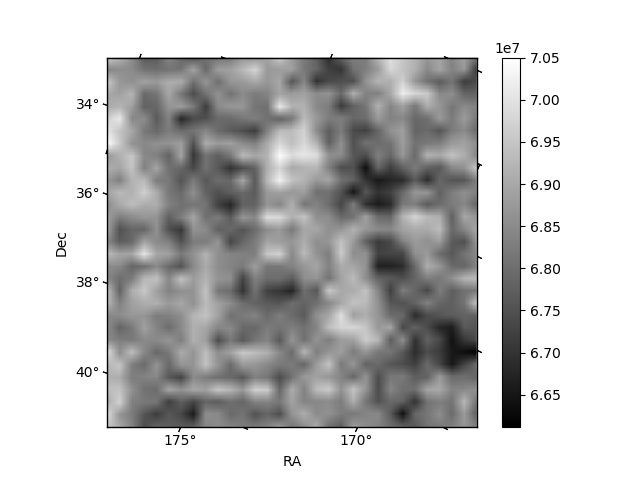
Quadrant B |
|---|---|---|---|
| Quadrant D | 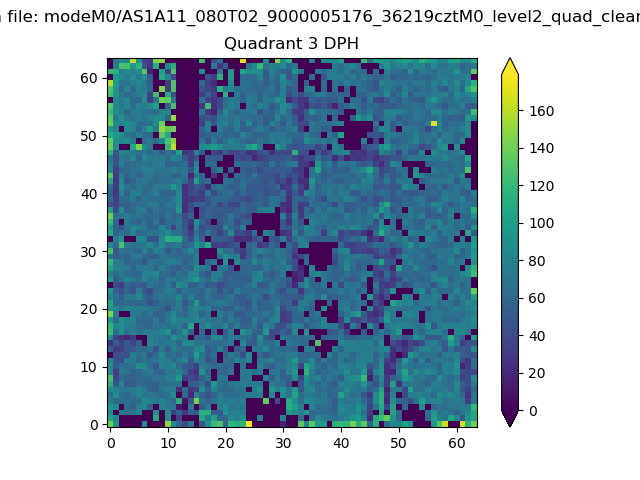 |
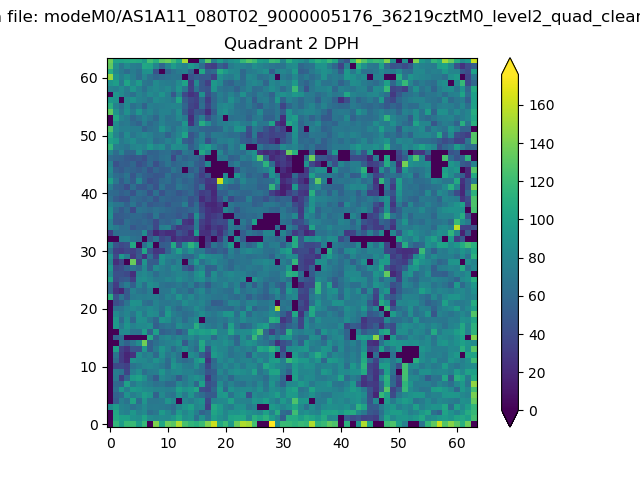 |
Quadrant C |
| Plot type | Count rate plots | Images |
|---|---|---|
| Comparison with Poisson distribution Blue bars denote a histogram of data divided into 1 sec bins. Red curve is a Poisson curve with rate = median count rate of data. |
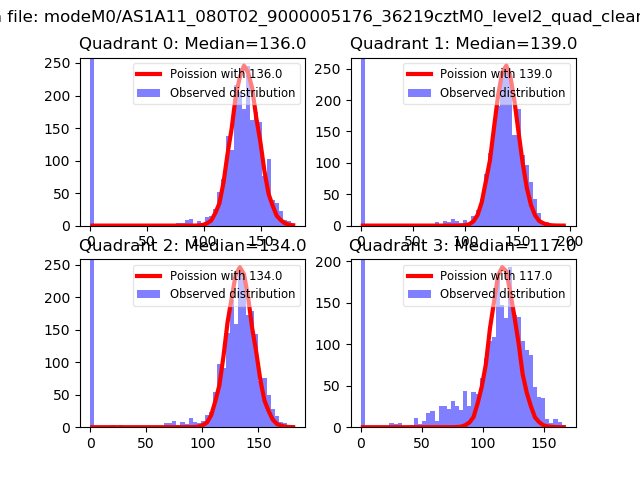 |
 |
| Quadrant-wise count rates Data is divided into 100 sec bins |
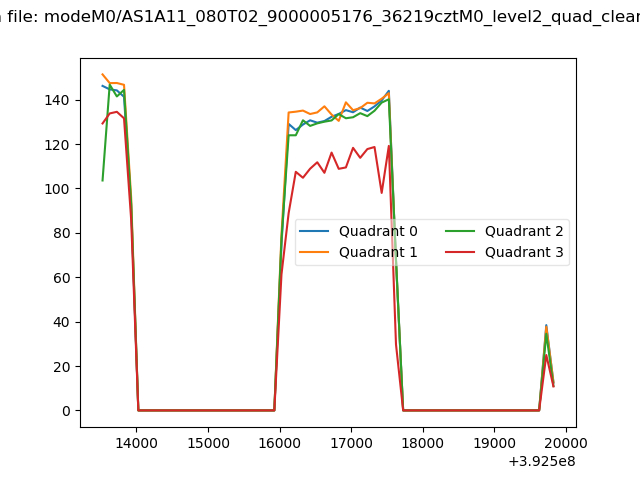 |
|
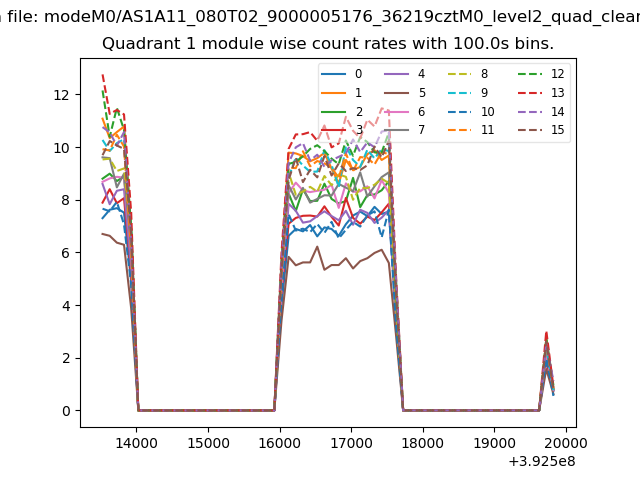
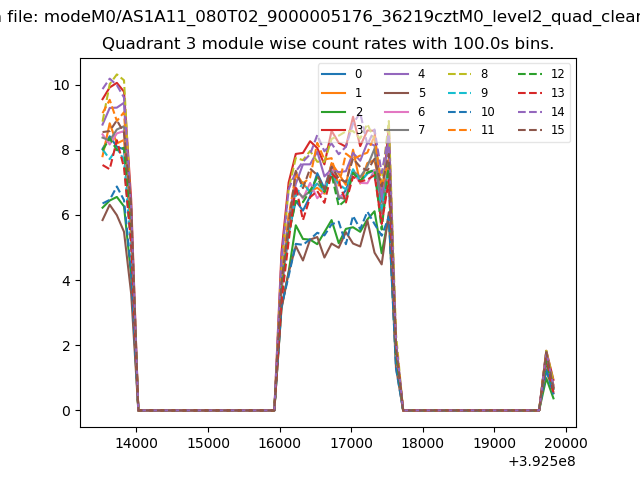
| Module-wise count rates for Quadrant A Data is divided into 100 sec bins |
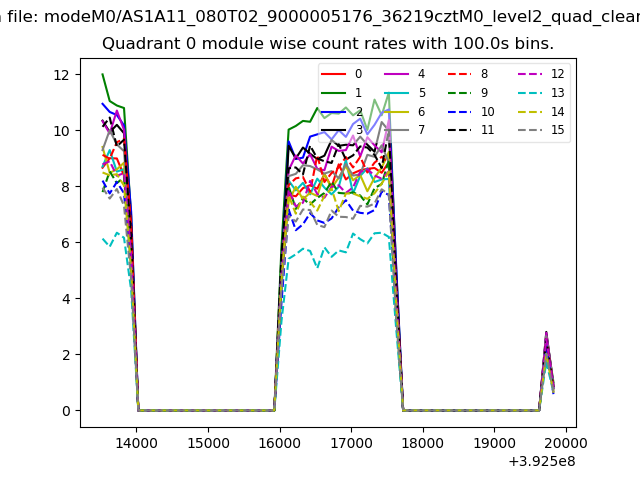 |
 |
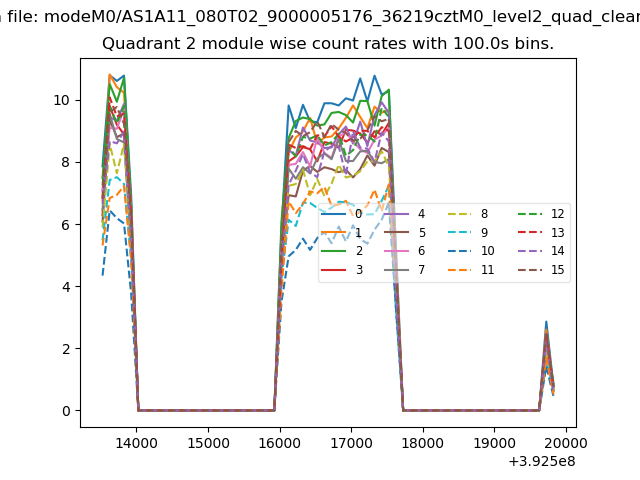
| Module-wise count rates for Quadrant B Data is divided into 100 sec bins |
 |
 |
| Module-wise count rates for Quadrant C Data is divided into 100 sec bins |
 |
 |
| Module-wise count rates for Quadrant D Data is divided into 100 sec bins |
 |
 |
| Parameter | Plot |
|---|---|
| CZT HV Monitor | 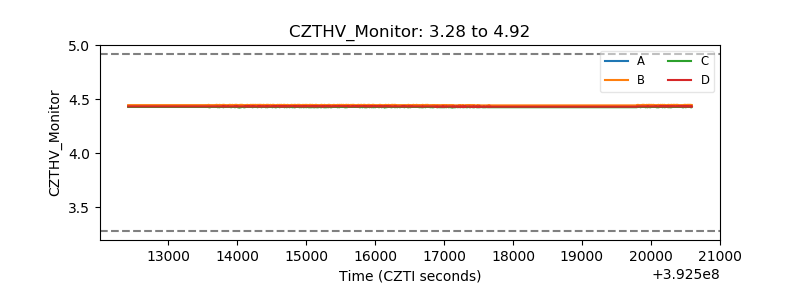 |
| D_VDD | 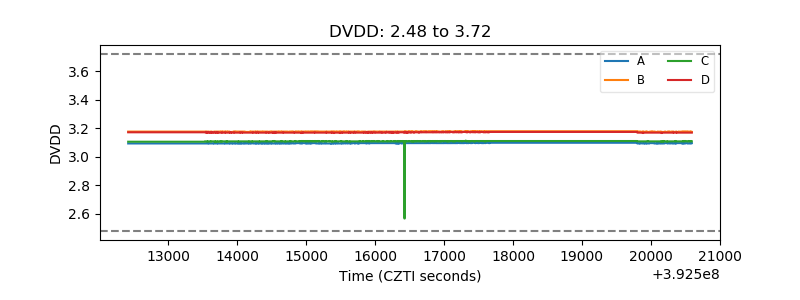 |
| Temperature 1 | 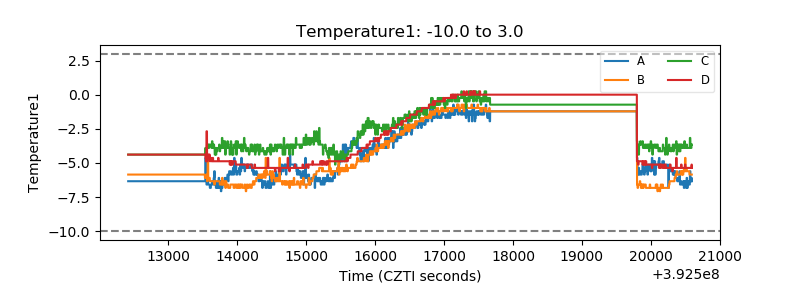 |
| Veto HV Monitor | 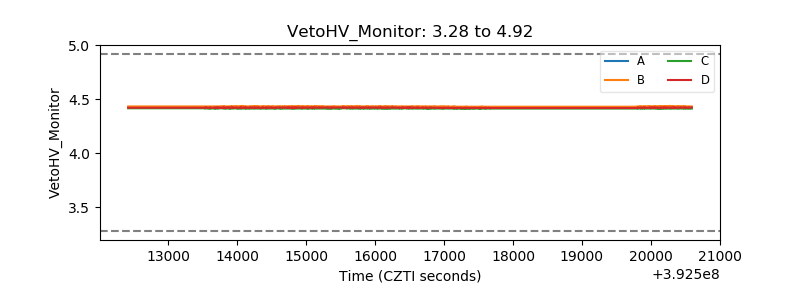 |
| Veto LLD | 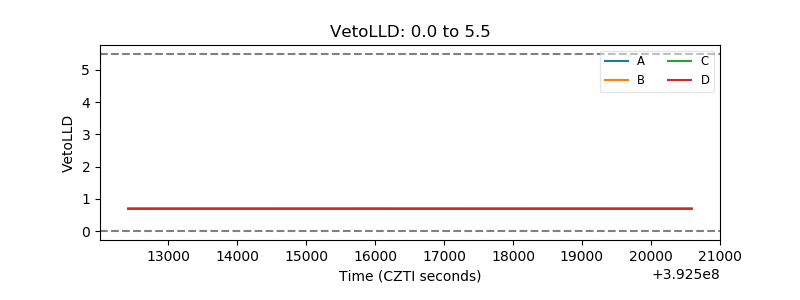 |
| Alpha Counter | 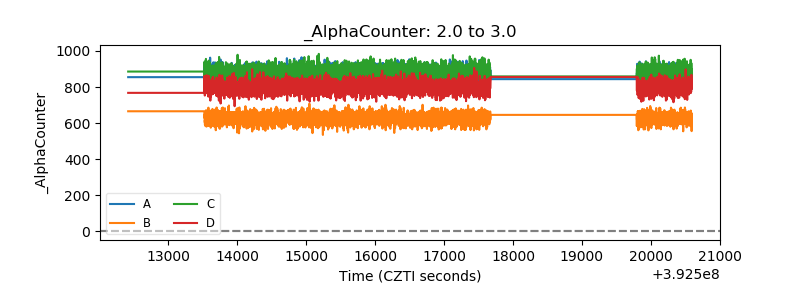 |
| _CPM_Rate | 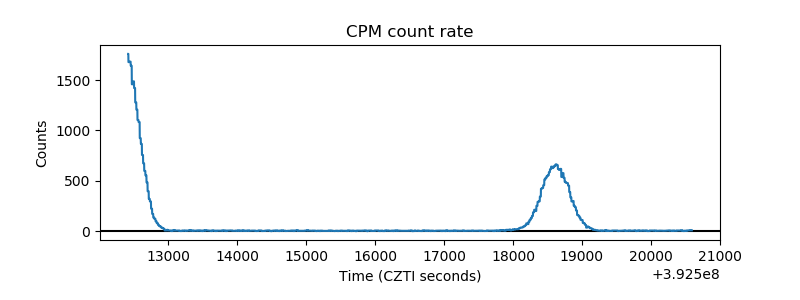 |
| CZT Counter | 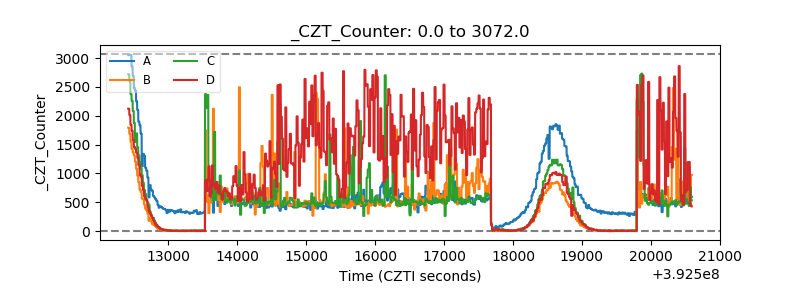 |
| +2.5 Volts monitor | 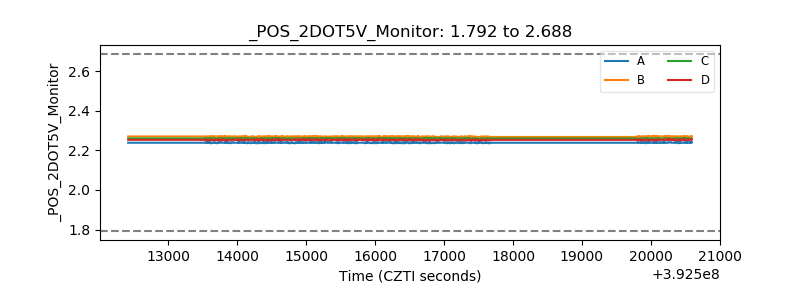 |
| +5 Volts monitor | 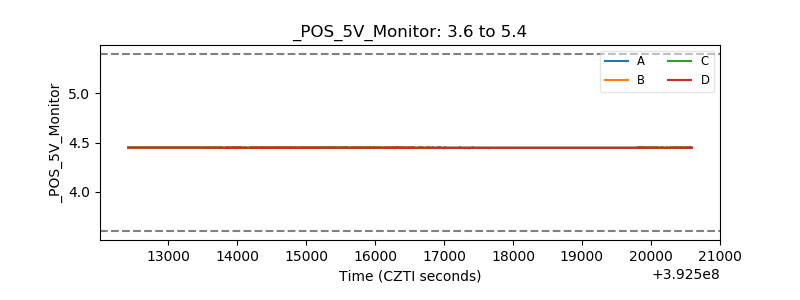 |
| _ROLL_ROT | 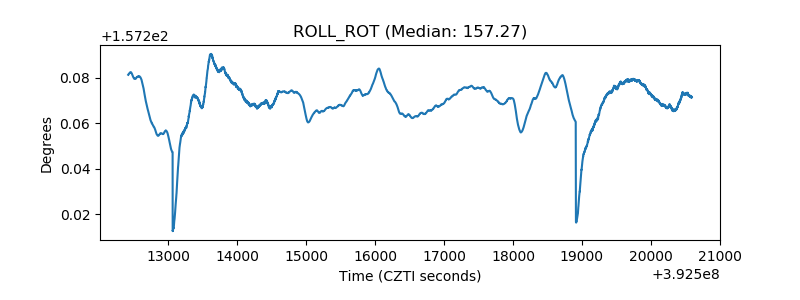 |
| _Roll_DEC | 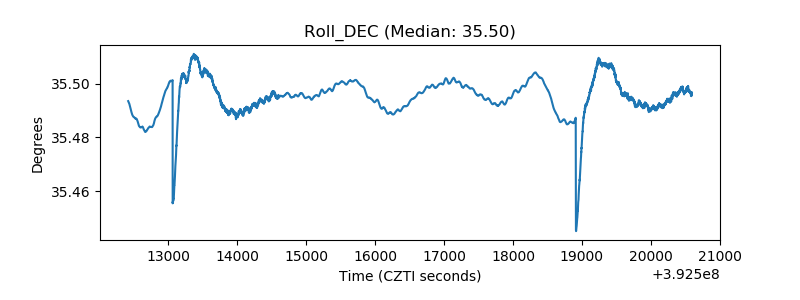 |
| _Roll_RA | 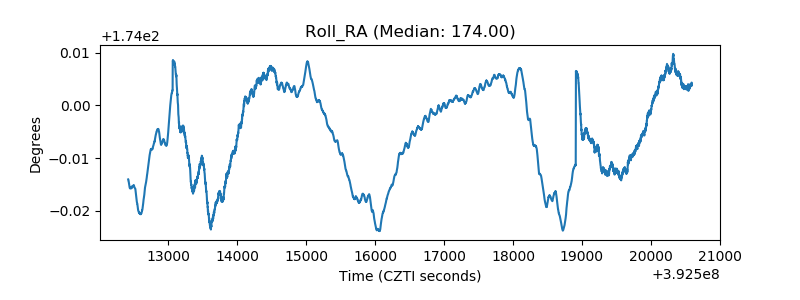 |
| Veto Counter | 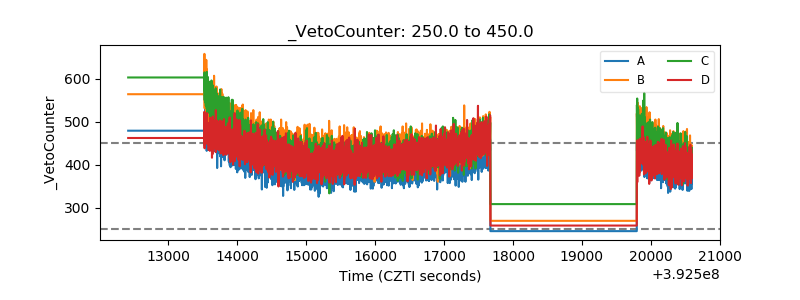 |