| Param | Original file | Final file |
|---|---|---|
| Filename | modeM0/AS1A11_080T02_9000005176_36218cztM0_level2.evt | modeM0/AS1A11_080T02_9000005176_36218cztM0_level2_quad_clean.evt |
| Size (bytes) | 480,006,720 | 57,631,680 |
| Size | 457.8 MB | 55.0 MB |
| Events in quadrant A | 2,769,493 | 360,071 |
| Events in quadrant B | 3,239,963 | 367,906 |
| Events in quadrant C | 3,724,532 | 352,763 |
| Events in quadrant D | 4,467,636 | 316,565 |
| Mode M9 | |||
|---|---|---|---|
| Quadrant | BADHDUFLAG | Total packets | Discarded packets |
| A | 0 | 36 | 0 |
| B | 0 | 36 | 0 |
| C | 0 | 36 | 0 |
| D | 0 | 37 | 0 |
| Mode M0 | |||
|---|---|---|---|
| Quadrant | BADHDUFLAG | Total packets | Discarded packets |
| A | 0 | 11304 | 3 |
| B | 0 | 12826 | 2 |
| C | 0 | 14349 | 2 |
| D | 0 | 16722 | 2 |
| Mode SS | |||
|---|---|---|---|
| Quadrant | BADHDUFLAG | Total packets | Discarded packets |
| A | 0 | 100 | 0 |
| B | 0 | 100 | 0 |
| C | 0 | 100 | 0 |
| D | 0 | 100 | 0 |
| Quadrant | Total seconds | Saturated seconds | Saturation percentage |
|---|---|---|---|
| A | 4956 | 16 | 0.322841% |
| B | 4956 | 99 | 1.997579% |
| C | 4956 | 132 | 2.663438% |
| D | 4956 | 396 | 7.990315% |
Noise dominated data is calculated using 1-second bins in cleaned event files. If a bin has >2000 counts, and if more than 50% of those come from <1% of pixels, then it is considered to be noise-dominated and hence unusable.
| Quadrant | # 1 sec bins | Bins with >0 counts | Bins with >2000 counts | High rate bins dominated by noise | Noise dominated (total time) | Noise dominated (detector-on time) | Marked lightcurve |
|---|---|---|---|---|---|---|---|
| A | 7080 | 4957 | 3 | 3 | 0.04% | 0.06% | 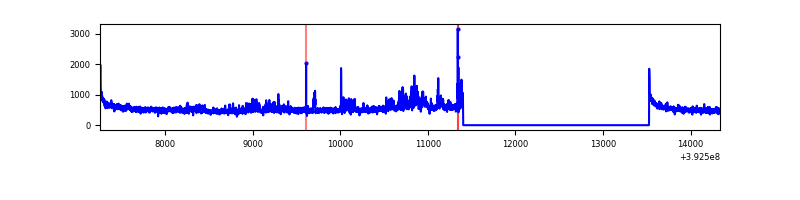 |
| B | 7080 | 4957 | 58 | 58 | 0.82% | 1.17% | 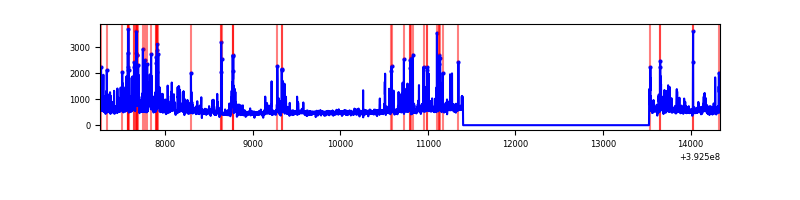 |
| C | 7080 | 4957 | 110 | 110 | 1.55% | 2.22% | 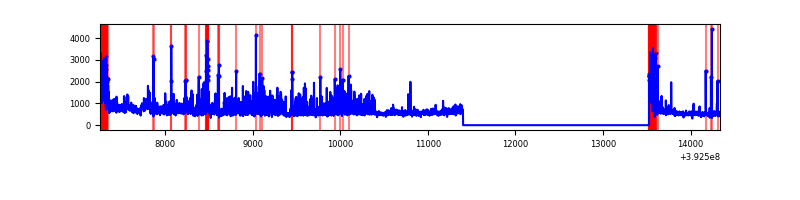 |
| D | 7080 | 4956 | 353 | 353 | 4.99% | 7.12% | 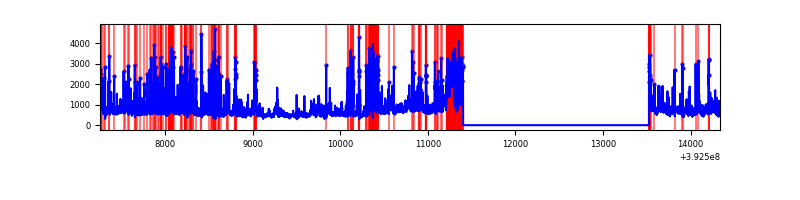 |
Top three noisy pixels from each quadrant. If the there are fewer than three noisy pixels in the level2.evt file, extra rows are filled as -1
| Pixel properties | Quadrant properties | ||||||
|---|---|---|---|---|---|---|---|
| Quadrant | DetID | PixID | Counts | Sigma | Mean | Median | Sigma |
| A | 15 | 223 | 211110 | 1756.55 | 599 | 589 | 119.8 |
| A | 10 | 83 | 168152 | 1398.12 | 599 | 589 | 119.8 |
| A | 9 | 143 | 26783 | 218.56 | 599 | 589 | 119.8 |
| B | 5 | 236 | 282324 | 2477.42 | 603 | 587 | 113.7 |
| B | 5 | 172 | 184179 | 1614.4 | 603 | 587 | 113.7 |
| B | 0 | 213 | 178971 | 1568.6 | 603 | 587 | 113.7 |
| C | 0 | 10 | 1014236 | 7474.77 | 580 | 585 | 135.6 |
| C | 15 | 214 | 205728 | 1512.75 | 580 | 585 | 135.6 |
| C | 0 | 207 | 139243 | 1022.48 | 580 | 585 | 135.6 |
| D | 12 | 6 | 727797 | 5296.18 | 560 | 546 | 137.3 |
| D | 12 | 227 | 644526 | 4689.76 | 560 | 546 | 137.3 |
| D | 12 | 235 | 559420 | 4069.98 | 560 | 546 | 137.3 |
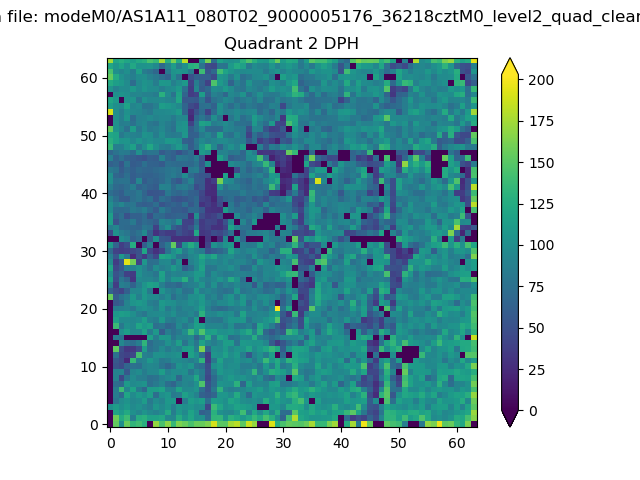
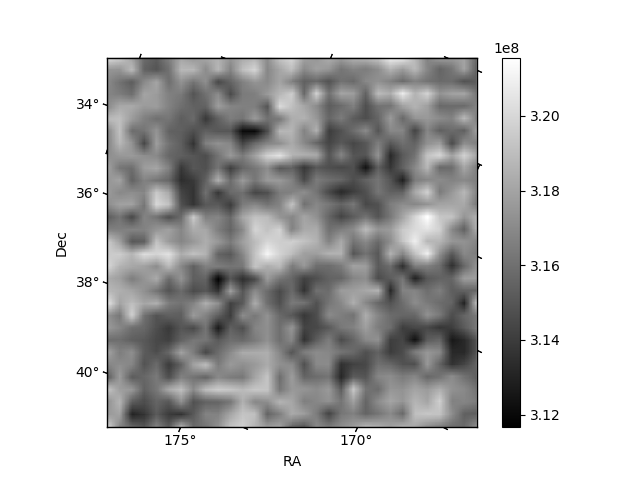
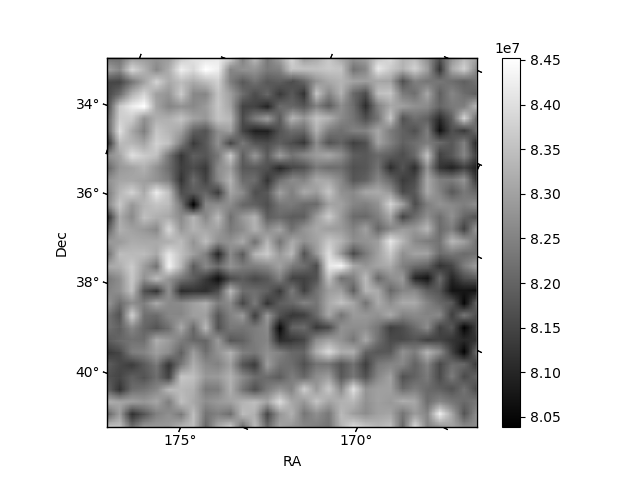
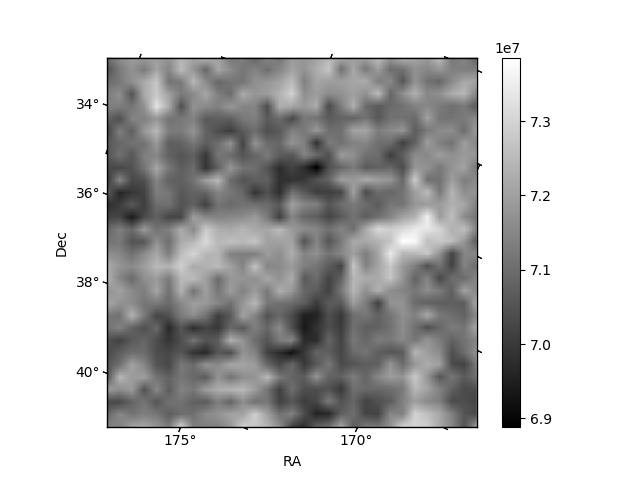
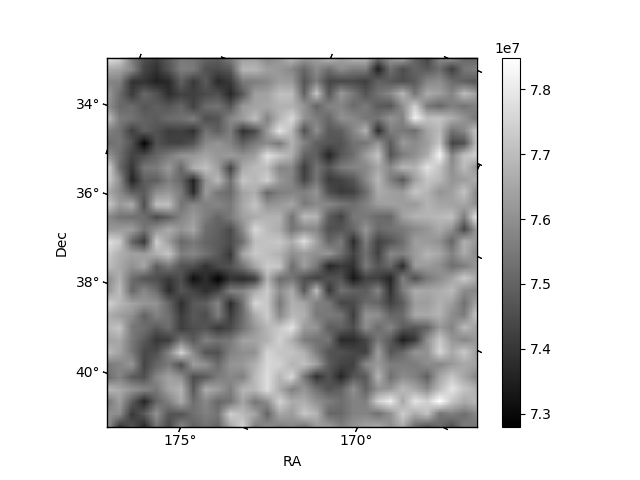
Histogram calculated using DETX and DETY for each event in the final _common_clean file
| Quadrant A | 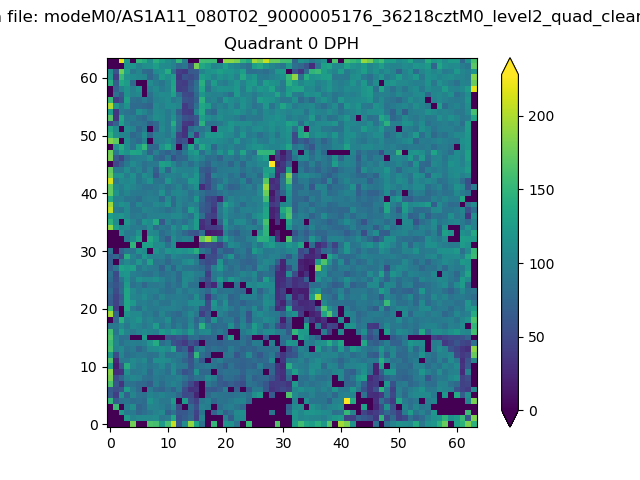 |
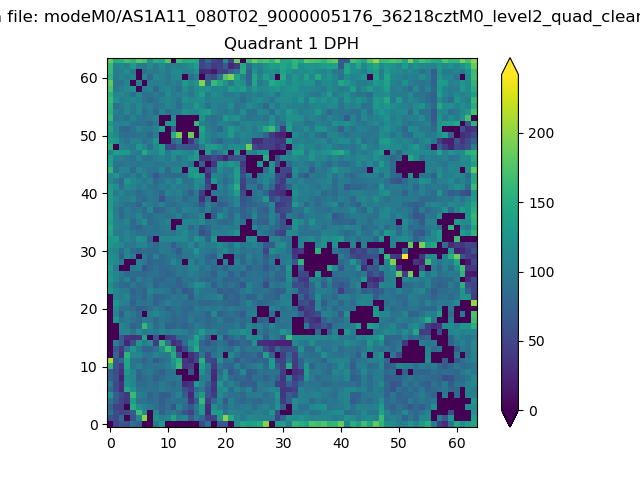 |
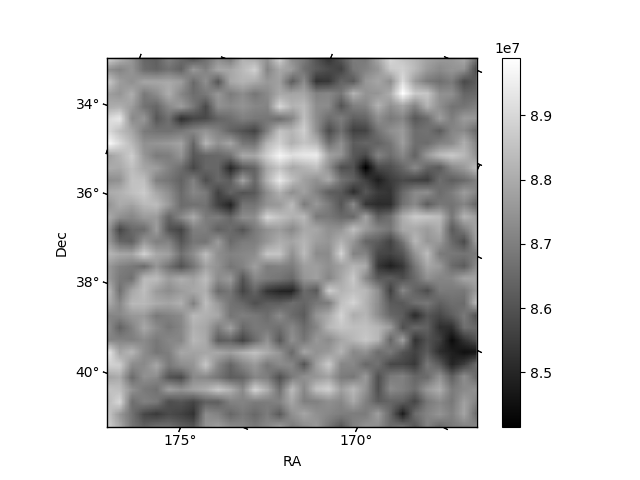
Quadrant B |
|---|---|---|---|
| Quadrant D | 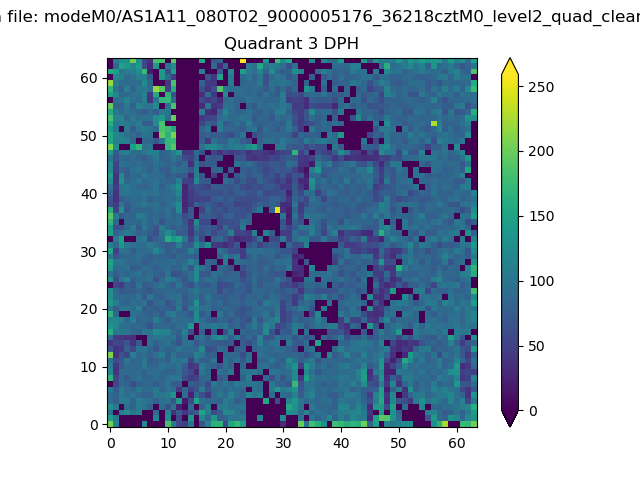 |
 |
Quadrant C |
| Plot type | Count rate plots | Images |
|---|---|---|
| Comparison with Poisson distribution Blue bars denote a histogram of data divided into 1 sec bins. Red curve is a Poisson curve with rate = median count rate of data. |
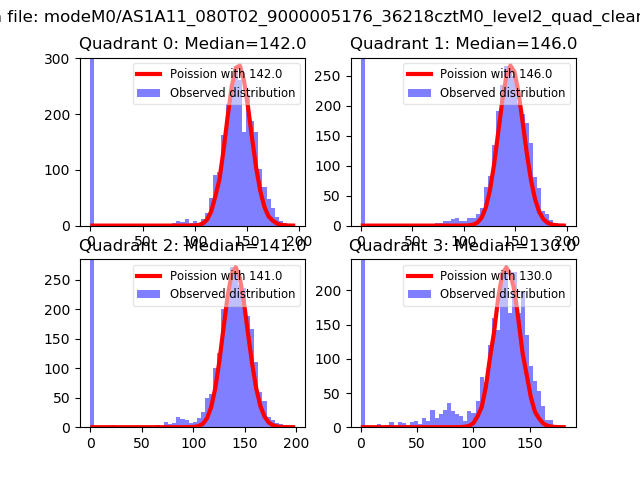 |
 |
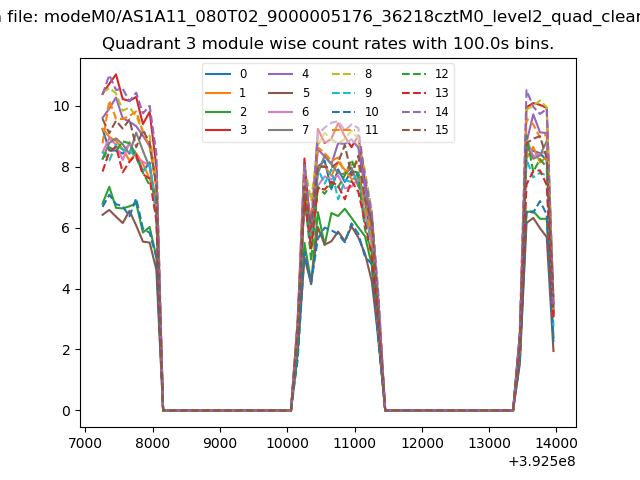
| Quadrant-wise count rates Data is divided into 100 sec bins |
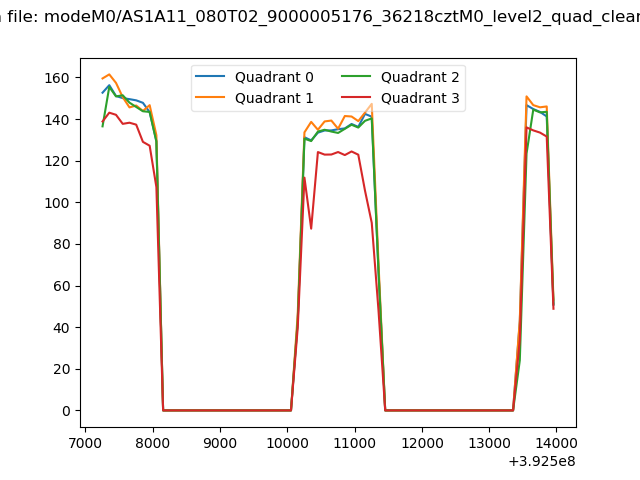 |
|
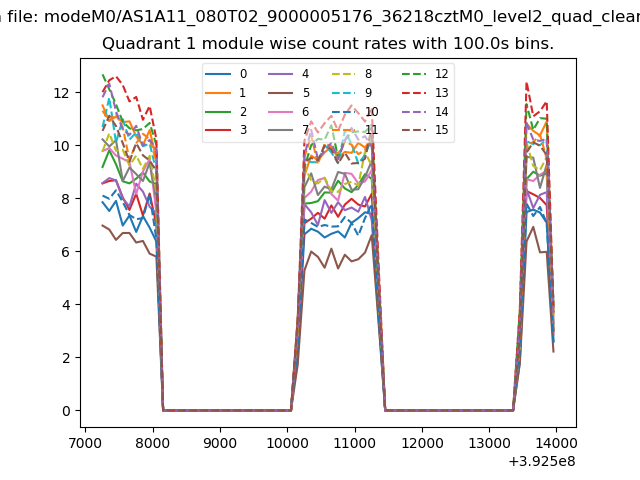
| Module-wise count rates for Quadrant A Data is divided into 100 sec bins |
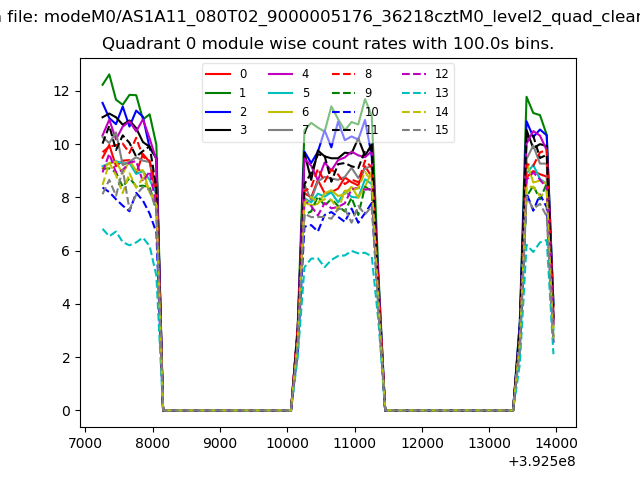 |
 |
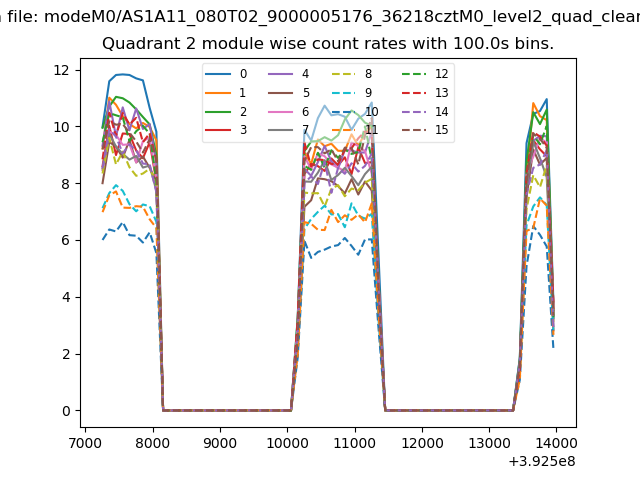
| Module-wise count rates for Quadrant B Data is divided into 100 sec bins |
 |
 |
| Module-wise count rates for Quadrant C Data is divided into 100 sec bins |
 |
 |
| Module-wise count rates for Quadrant D Data is divided into 100 sec bins |
 |
 |
| Parameter | Plot |
|---|---|
| CZT HV Monitor | 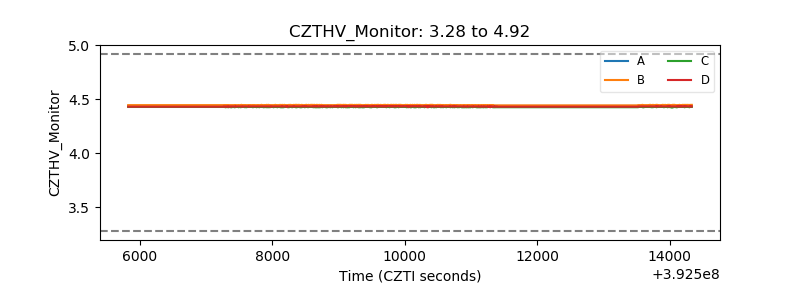 |
| D_VDD | 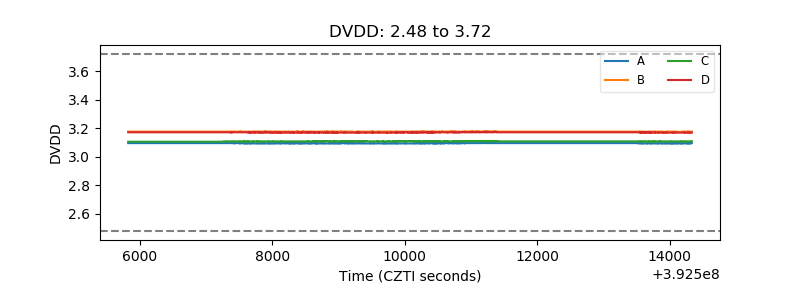 |
| Temperature 1 | 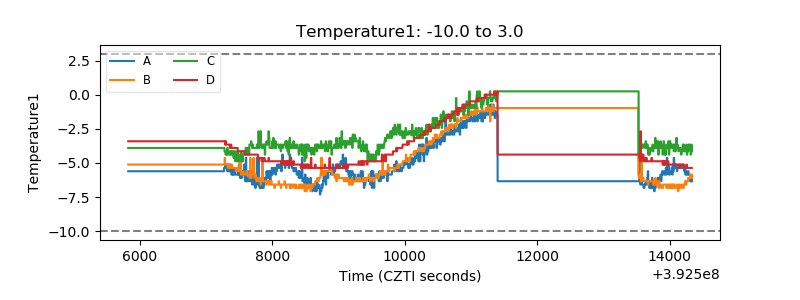 |
| Veto HV Monitor |  |
| Veto LLD | 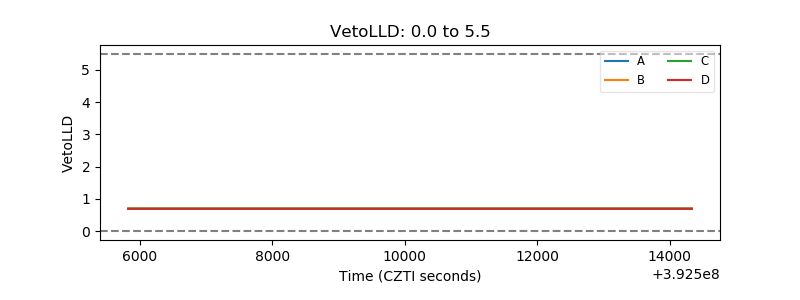 |
| Alpha Counter | 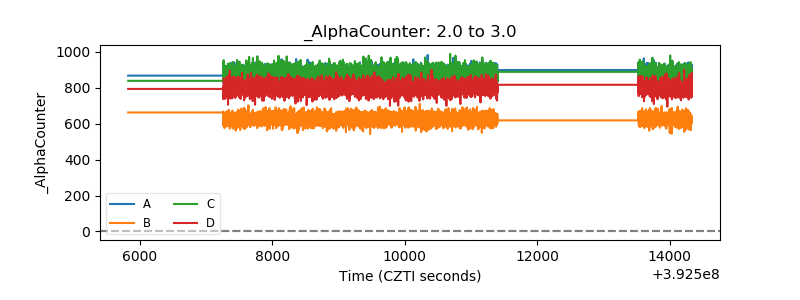 |
| _CPM_Rate |  |
| CZT Counter | 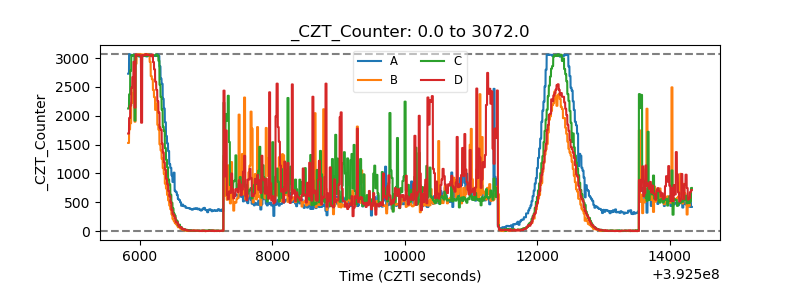 |
| +2.5 Volts monitor | 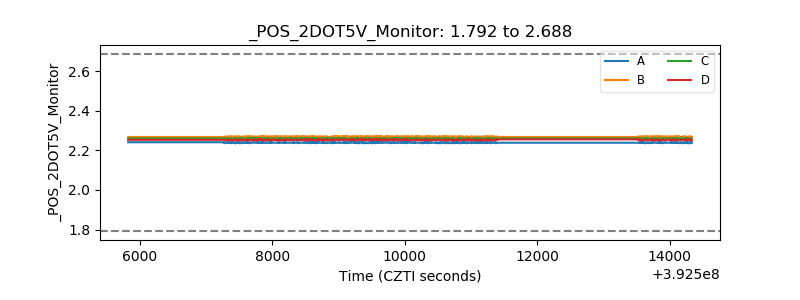 |
| +5 Volts monitor | 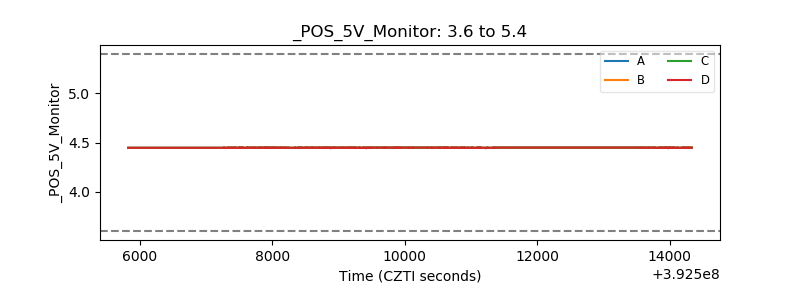 |
| _ROLL_ROT | 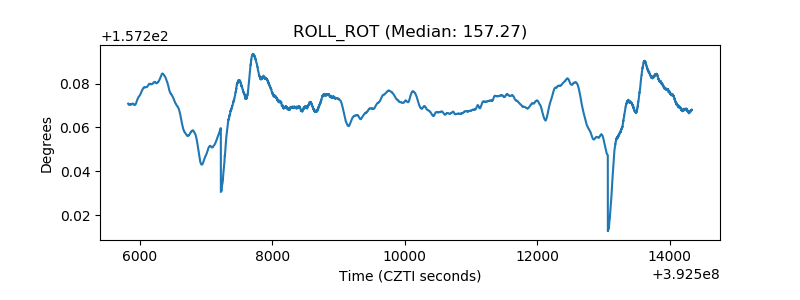 |
| _Roll_DEC | 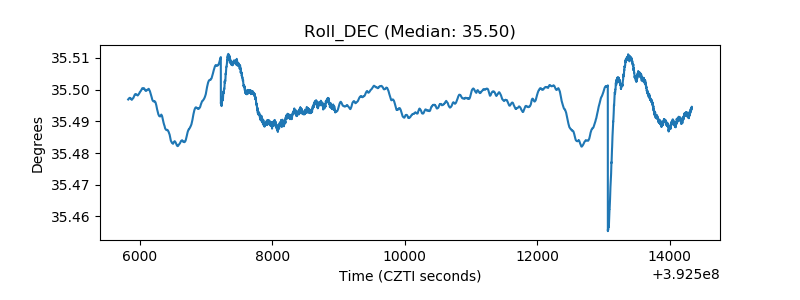 |
| _Roll_RA | 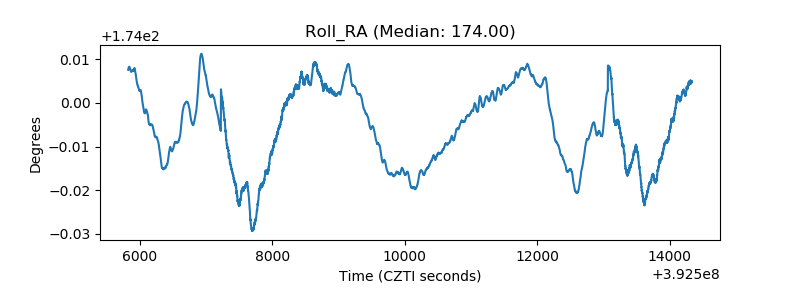 |
| Veto Counter | 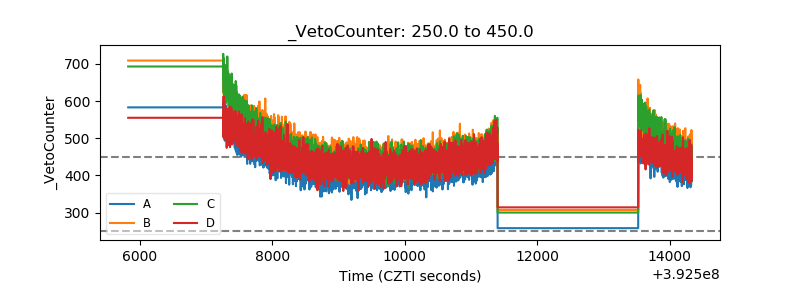 |