| Param | Original file | Final file |
|---|---|---|
| Filename | modeM0/AS1A11_080T02_9000005176_36217cztM0_level2.evt | modeM0/AS1A11_080T02_9000005176_36217cztM0_level2_quad_clean.evt |
| Size (bytes) | 499,006,080 | 65,191,680 |
| Size | 475.9 MB | 62.2 MB |
| Events in quadrant A | 2,888,416 | 416,575 |
| Events in quadrant B | 3,314,767 | 423,617 |
| Events in quadrant C | 3,262,698 | 412,017 |
| Events in quadrant D | 5,311,405 | 374,379 |
| Mode M9 | |||
|---|---|---|---|
| Quadrant | BADHDUFLAG | Total packets | Discarded packets |
| A | 0 | 28 | 0 |
| B | 0 | 28 | 0 |
| C | 0 | 28 | 0 |
| D | 0 | 29 | 0 |
| Mode M0 | |||
|---|---|---|---|
| Quadrant | BADHDUFLAG | Total packets | Discarded packets |
| A | 0 | 11683 | 3 |
| B | 0 | 13009 | 2 |
| C | 0 | 12774 | 2 |
| D | 0 | 19226 | 2 |
| Mode SS | |||
|---|---|---|---|
| Quadrant | BADHDUFLAG | Total packets | Discarded packets |
| A | 0 | 100 | 0 |
| B | 0 | 100 | 0 |
| C | 0 | 100 | 0 |
| D | 0 | 100 | 0 |
| Quadrant | Total seconds | Saturated seconds | Saturation percentage |
|---|---|---|---|
| A | 4954 | 19 | 0.383528% |
| B | 4954 | 135 | 2.725071% |
| C | 4954 | 127 | 2.563585% |
| D | 4954 | 562 | 11.344368% |
Noise dominated data is calculated using 1-second bins in cleaned event files. If a bin has >2000 counts, and if more than 50% of those come from <1% of pixels, then it is considered to be noise-dominated and hence unusable.
| Quadrant | # 1 sec bins | Bins with >0 counts | Bins with >2000 counts | High rate bins dominated by noise | Noise dominated (total time) | Noise dominated (detector-on time) | Marked lightcurve |
|---|---|---|---|---|---|---|---|
| A | 7017 | 4955 | 10 | 10 | 0.14% | 0.20% | 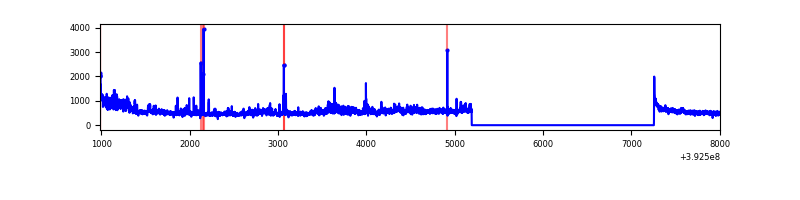 |
| B | 7017 | 4954 | 92 | 92 | 1.31% | 1.86% | 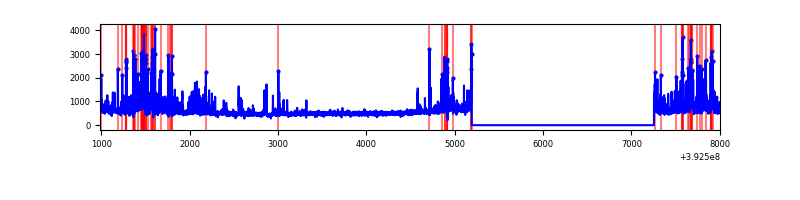 |
| C | 7017 | 4955 | 117 | 117 | 1.67% | 2.36% | 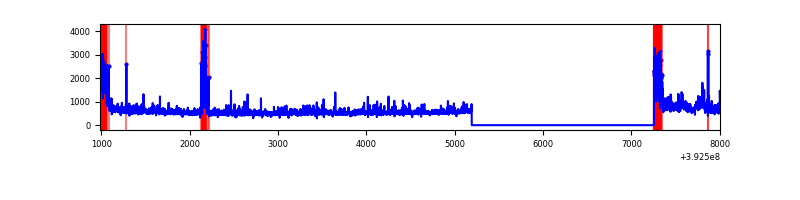 |
| D | 7017 | 4955 | 631 | 631 | 8.99% | 12.73% | 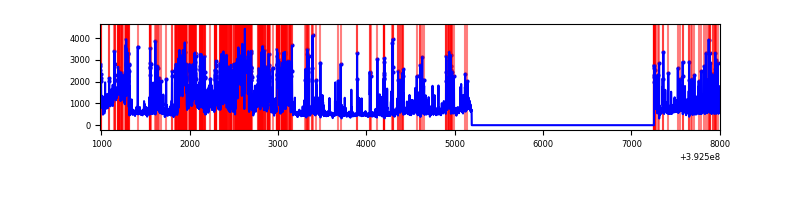 |
Top three noisy pixels from each quadrant. If the there are fewer than three noisy pixels in the level2.evt file, extra rows are filled as -1
| Pixel properties | Quadrant properties | ||||||
|---|---|---|---|---|---|---|---|
| Quadrant | DetID | PixID | Counts | Sigma | Mean | Median | Sigma |
| A | 15 | 223 | 309599 | 2556.03 | 602 | 591 | 120.9 |
| A | 10 | 83 | 173932 | 1433.83 | 602 | 591 | 120.9 |
| A | 9 | 143 | 45196 | 368.96 | 602 | 591 | 120.9 |
| B | 5 | 236 | 287670 | 2515.49 | 603 | 587 | 114.1 |
| B | 5 | 172 | 218033 | 1905.31 | 603 | 587 | 114.1 |
| B | 0 | 213 | 174210 | 1521.32 | 603 | 587 | 114.1 |
| C | 0 | 10 | 599324 | 4359.06 | 589 | 594 | 137.4 |
| C | 15 | 214 | 206389 | 1498.29 | 589 | 594 | 137.4 |
| C | 1 | 23 | 143171 | 1038.03 | 589 | 594 | 137.4 |
| D | 12 | 227 | 1521484 | 11149.65 | 562 | 547 | 136.4 |
| D | 12 | 6 | 550824 | 4033.96 | 562 | 547 | 136.4 |
| D | 12 | 235 | 487191 | 3567.48 | 562 | 547 | 136.4 |
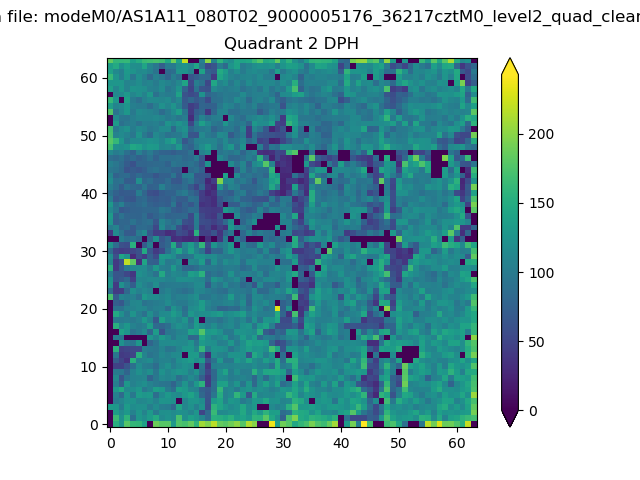
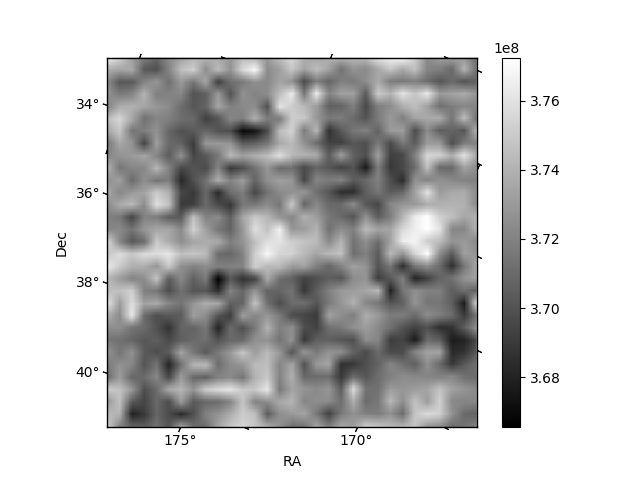
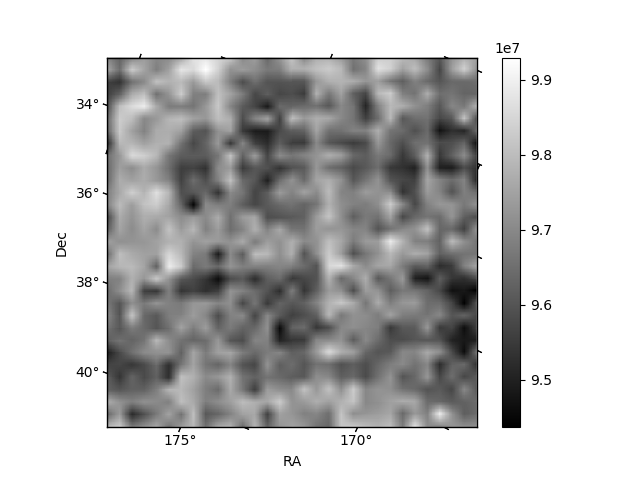
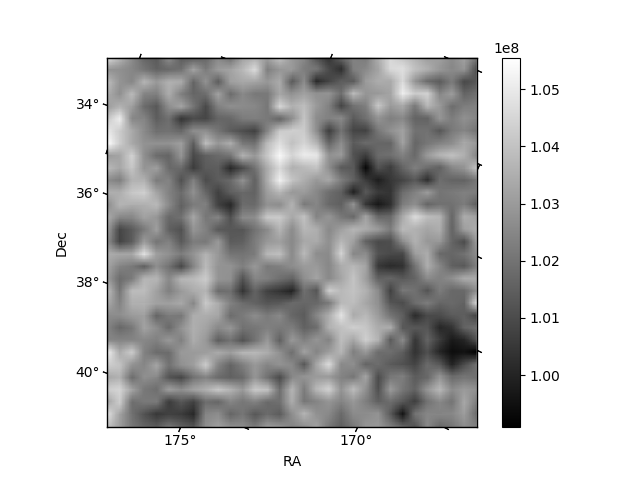
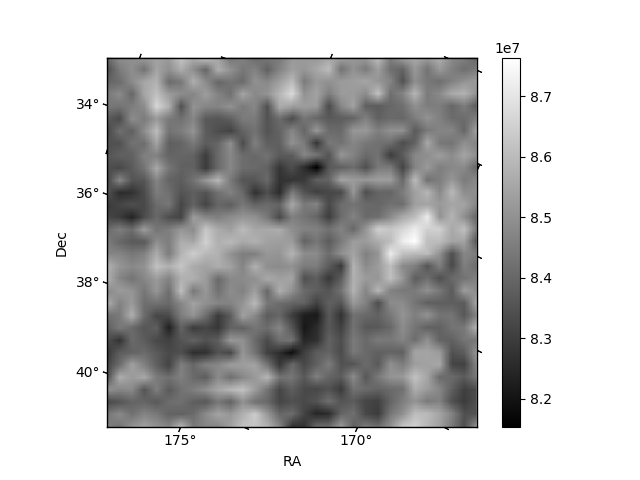
Histogram calculated using DETX and DETY for each event in the final _common_clean file
| Quadrant A | 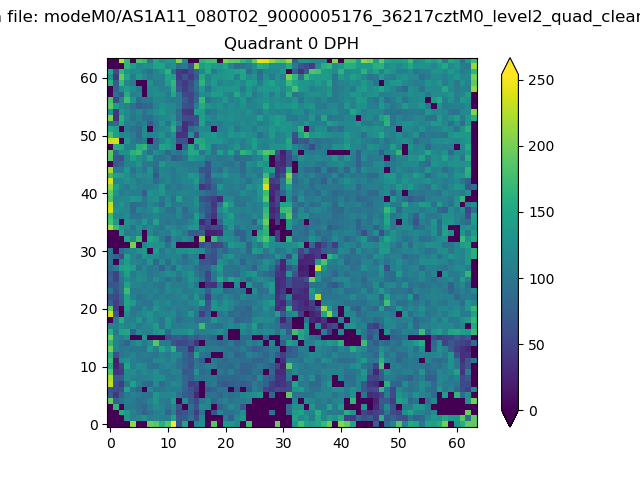 |
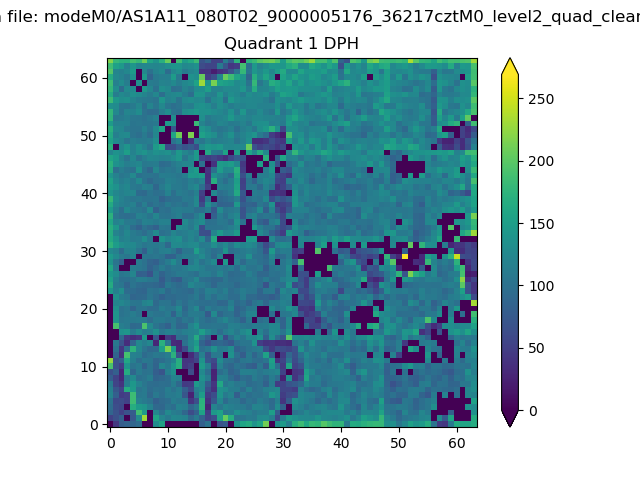 |
Quadrant B |
|---|---|---|---|
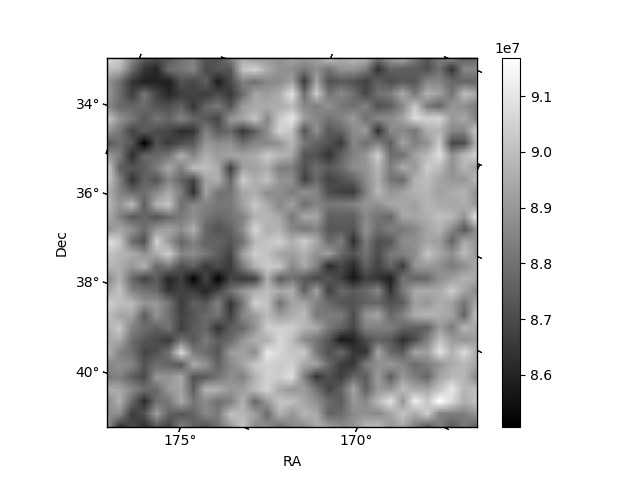
| Quadrant D | 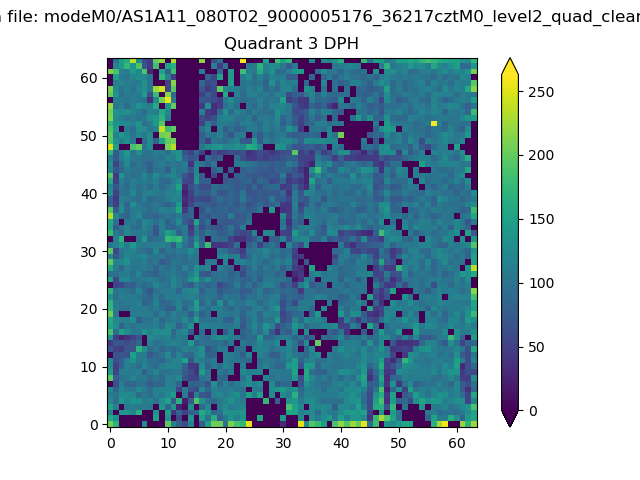 |
 |
Quadrant C |
| Plot type | Count rate plots | Images |
|---|---|---|
| Comparison with Poisson distribution Blue bars denote a histogram of data divided into 1 sec bins. Red curve is a Poisson curve with rate = median count rate of data. |
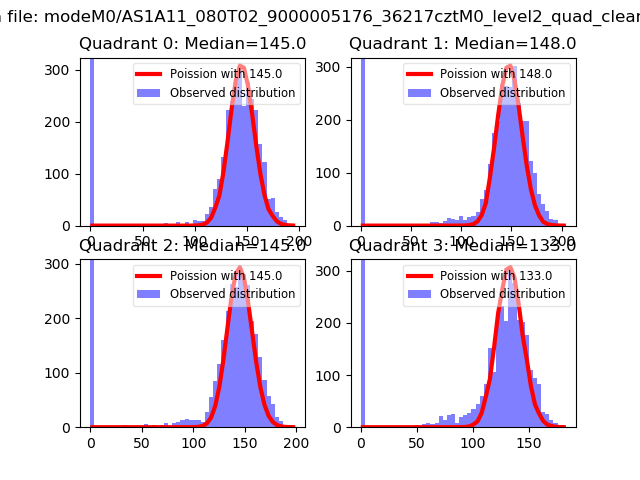 |
 |
| Quadrant-wise count rates Data is divided into 100 sec bins |
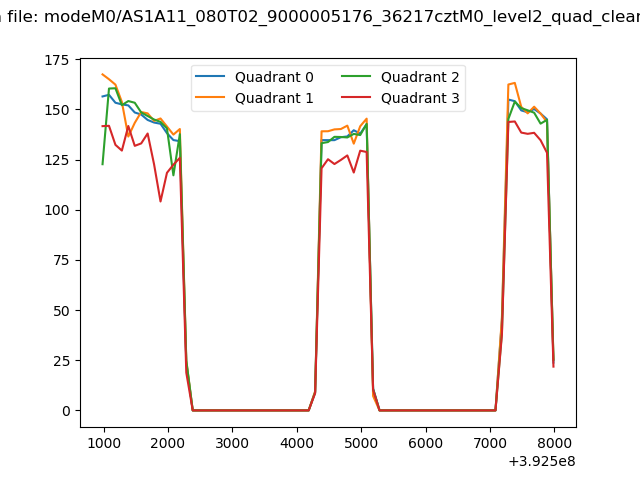 |
|
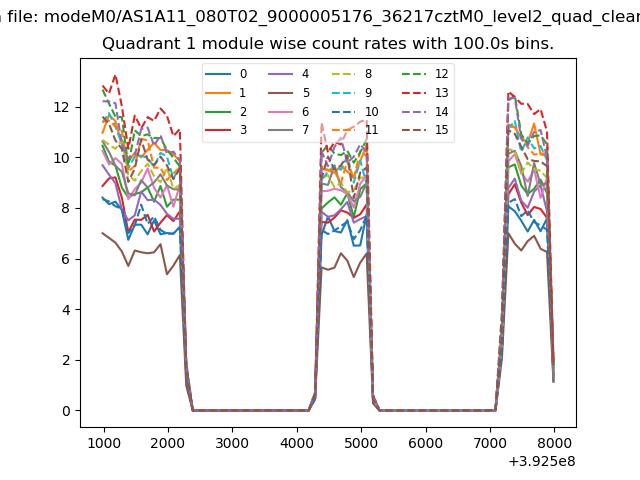
| Module-wise count rates for Quadrant A Data is divided into 100 sec bins |
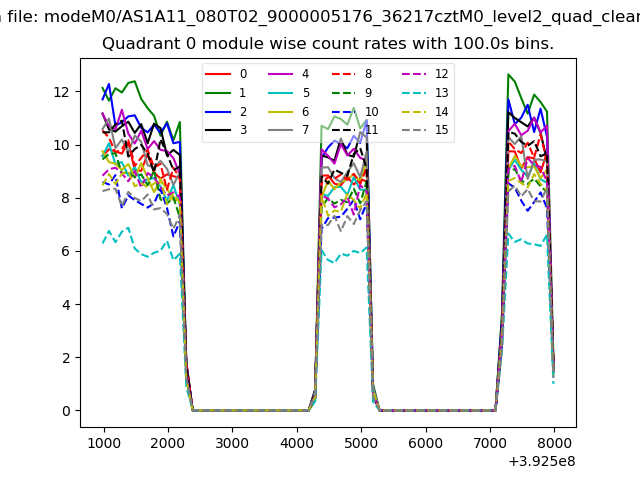 |
 |
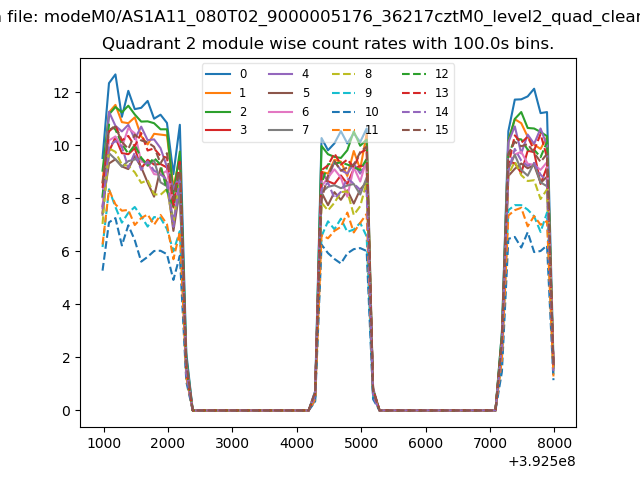
| Module-wise count rates for Quadrant B Data is divided into 100 sec bins |
 |
 |
| Module-wise count rates for Quadrant C Data is divided into 100 sec bins |
 |
 |
| Module-wise count rates for Quadrant D Data is divided into 100 sec bins |
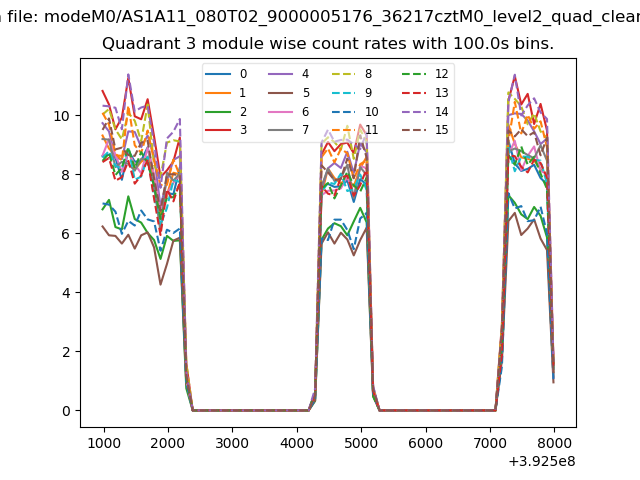 |
 |
| Parameter | Plot |
|---|---|
| CZT HV Monitor | 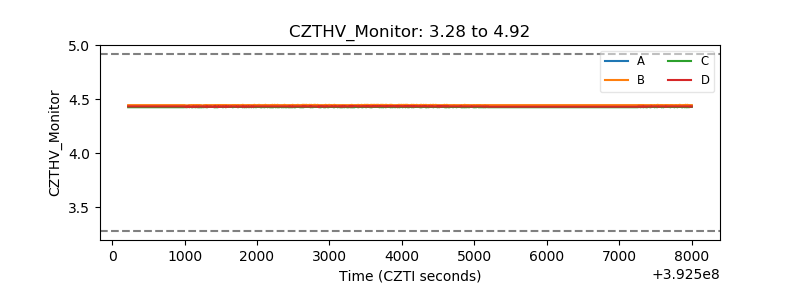 |
| D_VDD | 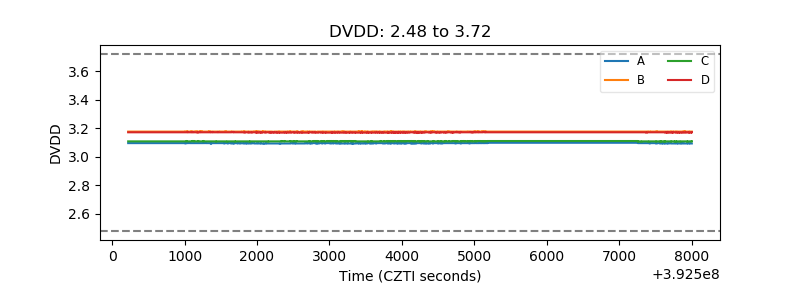 |
| Temperature 1 | 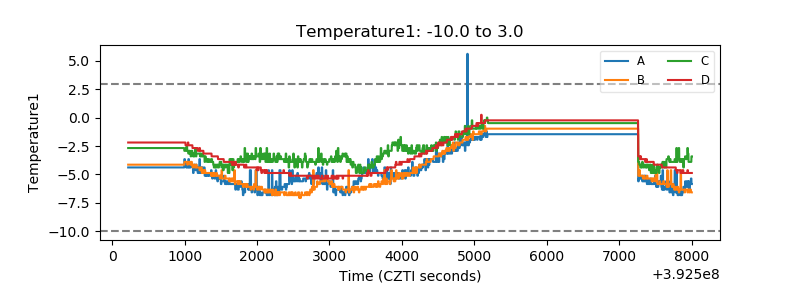 |
| Veto HV Monitor | 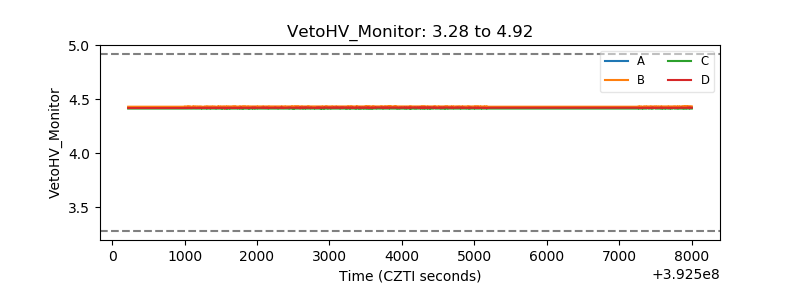 |
| Veto LLD | 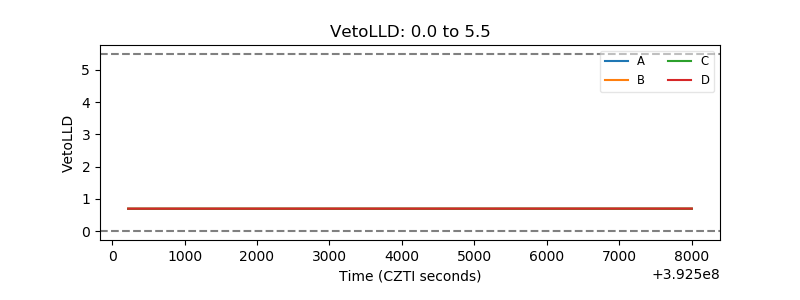 |
| Alpha Counter | 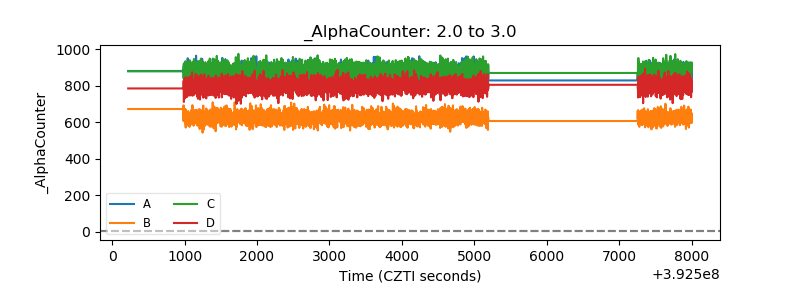 |
| _CPM_Rate | 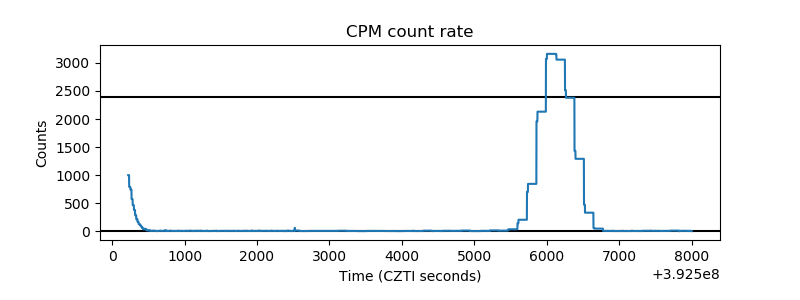 |
| CZT Counter | 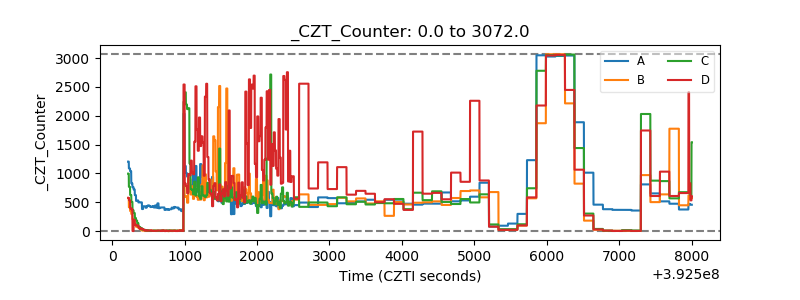 |
| +2.5 Volts monitor | 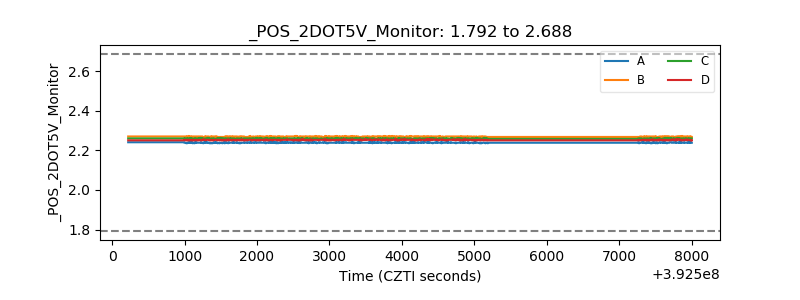 |
| +5 Volts monitor | 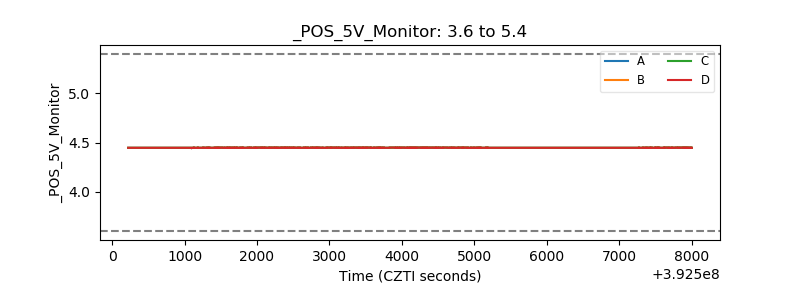 |
| _ROLL_ROT | 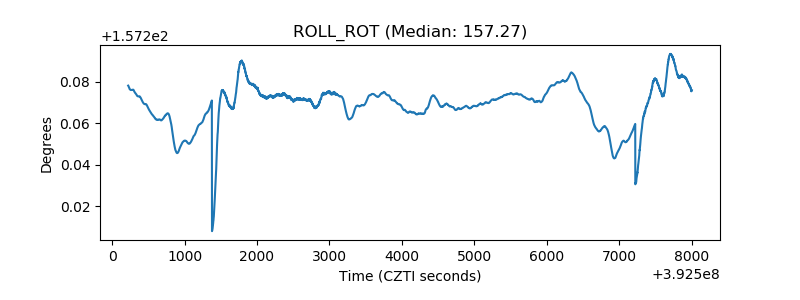 |
| _Roll_DEC | 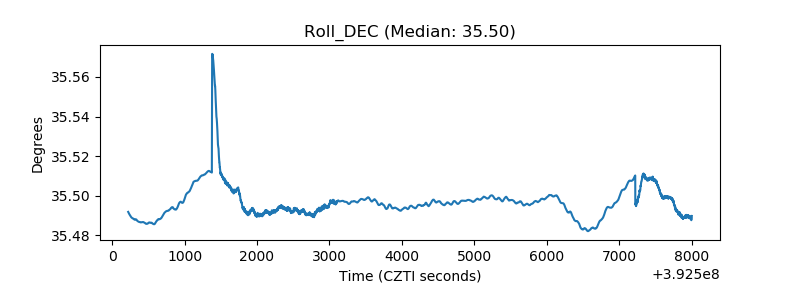 |
| _Roll_RA | 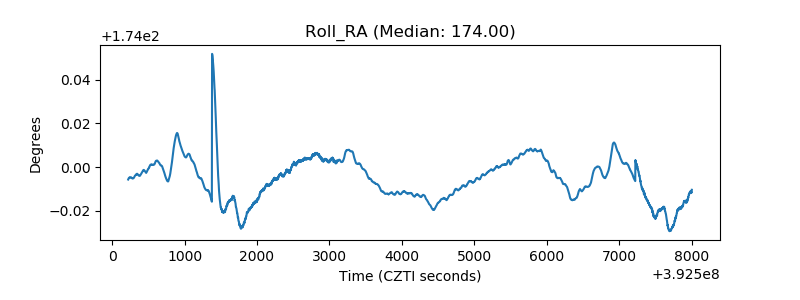 |
| Veto Counter | 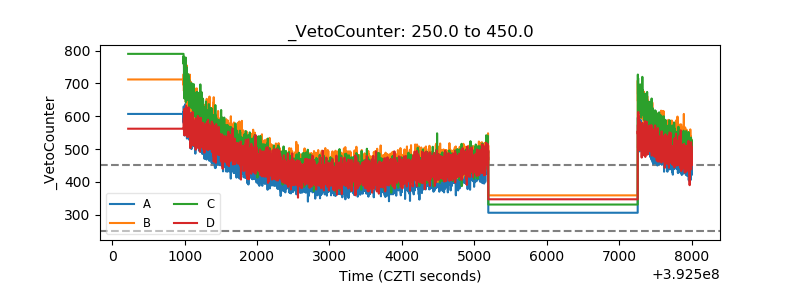 |