| Param | Original file | Final file |
|---|---|---|
| Filename | modeM0/AS1A11_080T02_9000005176_36213cztM0_level2.evt | modeM0/AS1A11_080T02_9000005176_36213cztM0_level2_quad_clean.evt |
| Size (bytes) | 700,407,360 | 65,643,840 |
| Size | 668.0 MB | 62.6 MB |
| Events in quadrant A | 2,841,839 | 447,413 |
| Events in quadrant B | 3,853,268 | 430,613 |
| Events in quadrant C | 3,123,923 | 437,012 |
| Events in quadrant D | 11,023,058 | 288,272 |
| Mode M9 | |||
|---|---|---|---|
| Quadrant | BADHDUFLAG | Total packets | Discarded packets |
| A | 0 | 17 | 0 |
| B | 0 | 17 | 0 |
| C | 0 | 17 | 0 |
| D | 0 | 18 | 0 |
| Mode M0 | |||
|---|---|---|---|
| Quadrant | BADHDUFLAG | Total packets | Discarded packets |
| A | 0 | 11844 | 3 |
| B | 0 | 15104 | 2 |
| C | 0 | 12701 | 2 |
| D | 0 | 36471 | 2 |
| Mode SS | |||
|---|---|---|---|
| Quadrant | BADHDUFLAG | Total packets | Discarded packets |
| A | 0 | 112 | 0 |
| B | 0 | 112 | 0 |
| C | 0 | 112 | 0 |
| D | 0 | 112 | 0 |
| Quadrant | Total seconds | Saturated seconds | Saturation percentage |
|---|---|---|---|
| A | 5470 | 15 | 0.274223% |
| B | 5470 | 340 | 6.215722% |
| C | 5470 | 117 | 2.138940% |
| D | 5470 | 3075 | 56.215722% |
Noise dominated data is calculated using 1-second bins in cleaned event files. If a bin has >2000 counts, and if more than 50% of those come from <1% of pixels, then it is considered to be noise-dominated and hence unusable.
| Quadrant | # 1 sec bins | Bins with >0 counts | Bins with >2000 counts | High rate bins dominated by noise | Noise dominated (total time) | Noise dominated (detector-on time) | Marked lightcurve |
|---|---|---|---|---|---|---|---|
| A | 7173 | 5471 | 2 | 2 | 0.03% | 0.04% | 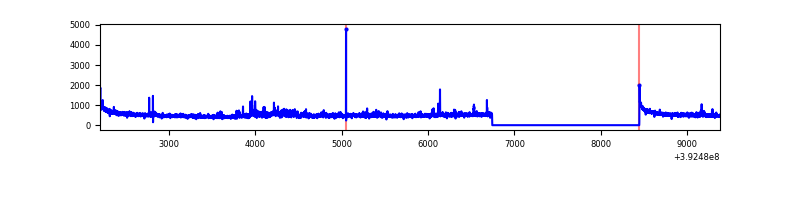 |
| B | 7173 | 5471 | 245 | 245 | 3.42% | 4.48% | 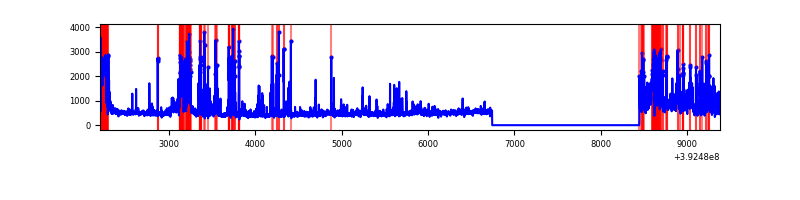 |
| C | 7173 | 5471 | 77 | 77 | 1.07% | 1.41% | 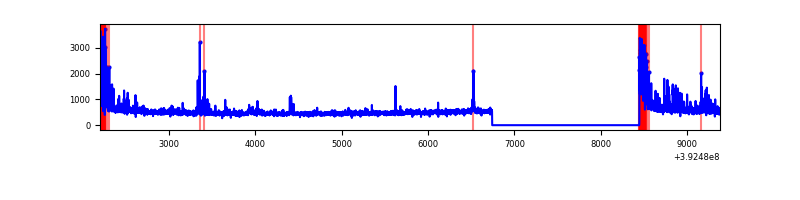 |
| D | 7173 | 5471 | 2999 | 2999 | 41.81% | 54.82% | 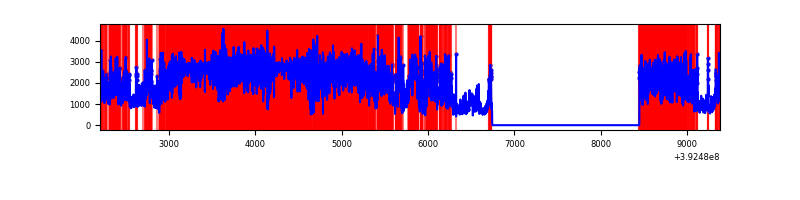 |
Top three noisy pixels from each quadrant. If the there are fewer than three noisy pixels in the level2.evt file, extra rows are filled as -1
| Pixel properties | Quadrant properties | ||||||
|---|---|---|---|---|---|---|---|
| Quadrant | DetID | PixID | Counts | Sigma | Mean | Median | Sigma |
| A | 10 | 83 | 198003 | 1577.02 | 623 | 611 | 125.2 |
| A | 15 | 223 | 181646 | 1446.34 | 623 | 611 | 125.2 |
| A | 15 | 174 | 12297 | 93.36 | 623 | 611 | 125.2 |
| B | 5 | 172 | 733189 | 6264.21 | 609 | 594 | 116.9 |
| B | 0 | 190 | 288073 | 2458.15 | 609 | 594 | 116.9 |
| B | 4 | 232 | 222988 | 1901.63 | 609 | 594 | 116.9 |
| C | 0 | 10 | 438535 | 3110.94 | 608 | 613 | 140.8 |
| C | 15 | 214 | 229455 | 1625.66 | 608 | 613 | 140.8 |
| C | 1 | 23 | 33818 | 235.88 | 608 | 613 | 140.8 |
| D | 12 | 235 | 4820971 | 40558.18 | 487 | 475 | 118.9 |
| D | 12 | 227 | 3519148 | 29605.04 | 487 | 475 | 118.9 |
| D | 12 | 6 | 511030 | 4295.65 | 487 | 475 | 118.9 |
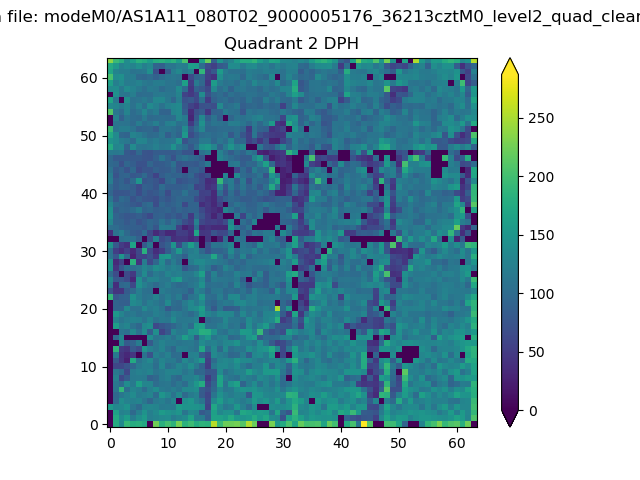
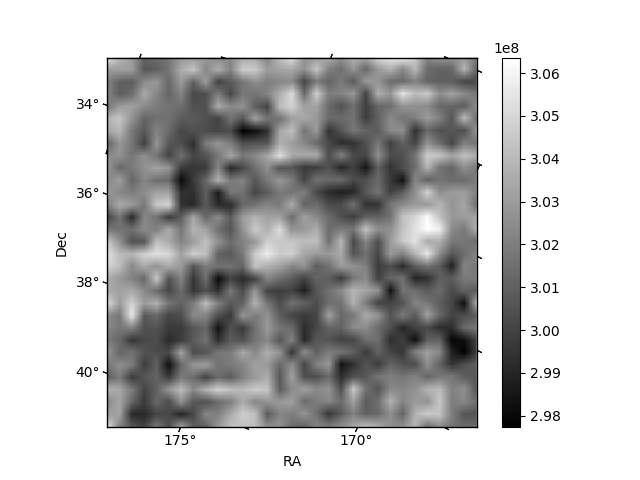
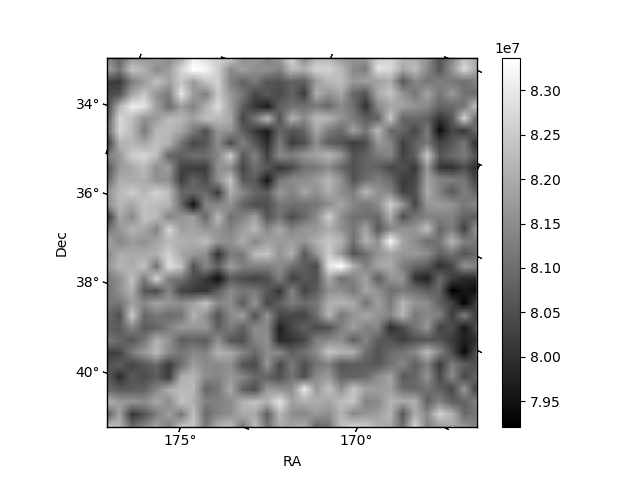
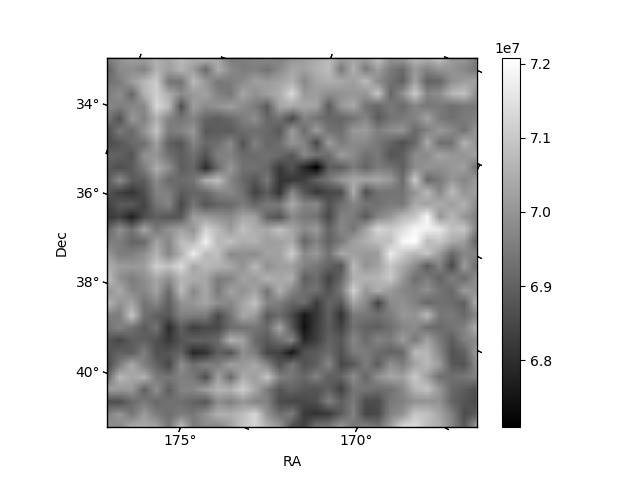
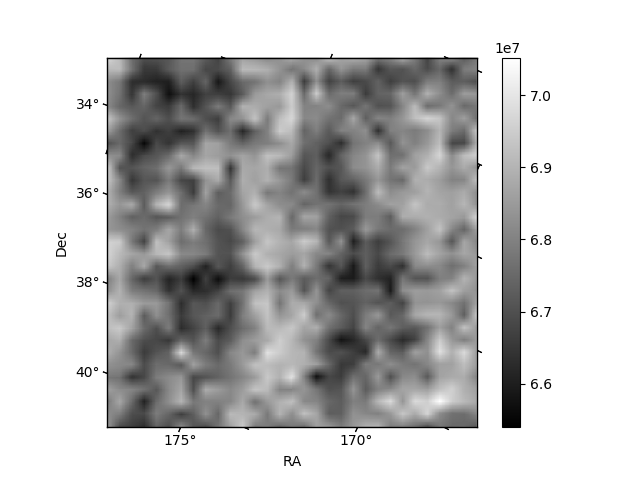
Histogram calculated using DETX and DETY for each event in the final _common_clean file
| Quadrant A | 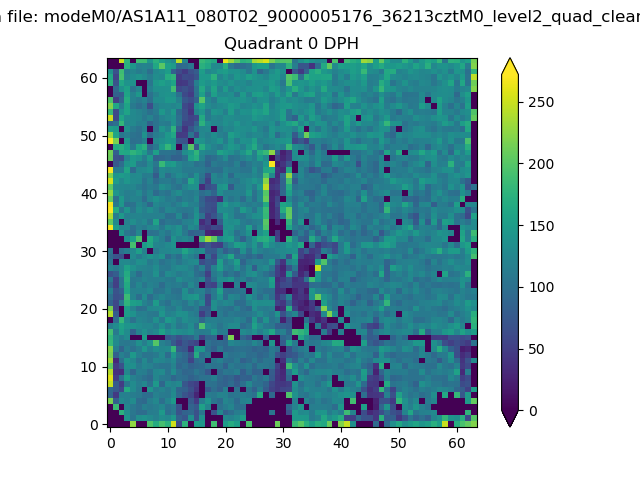 |
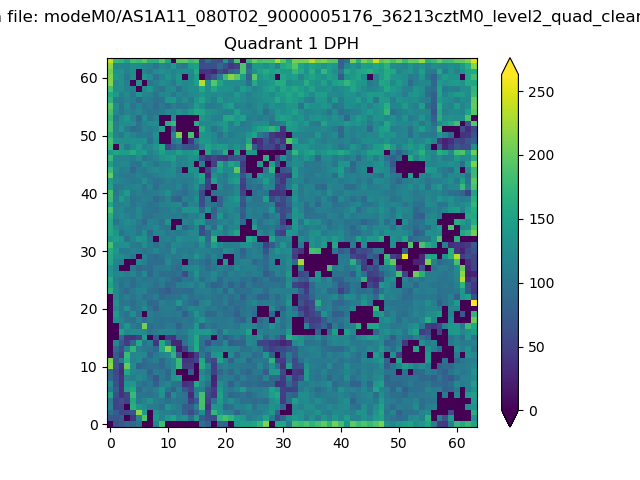 |
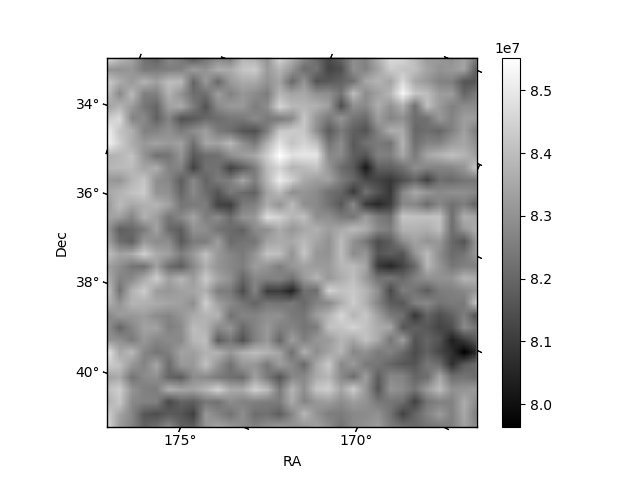
Quadrant B |
|---|---|---|---|
| Quadrant D | 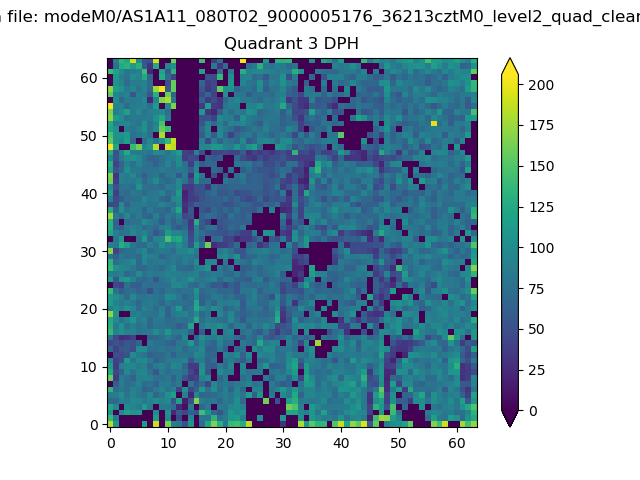 |
 |
Quadrant C |
| Plot type | Count rate plots | Images |
|---|---|---|
| Comparison with Poisson distribution Blue bars denote a histogram of data divided into 1 sec bins. Red curve is a Poisson curve with rate = median count rate of data. |
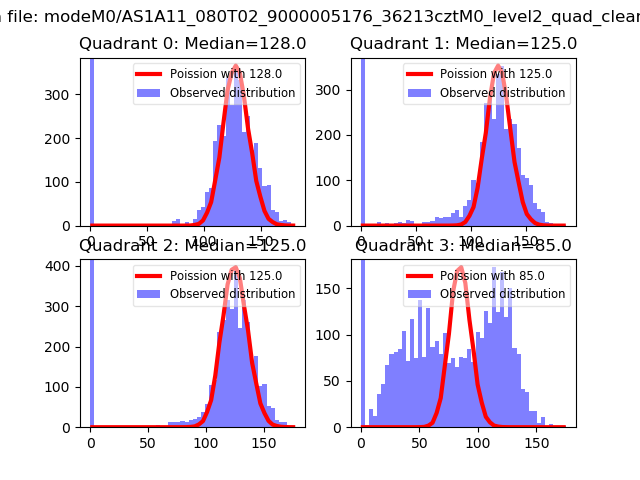 |
 |
| Quadrant-wise count rates Data is divided into 100 sec bins |
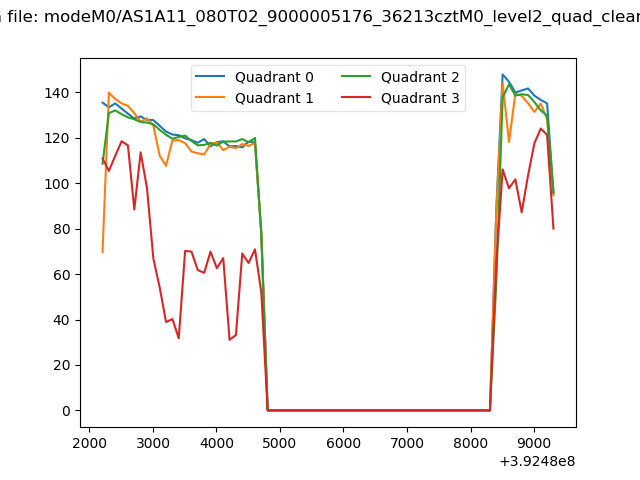 |
|
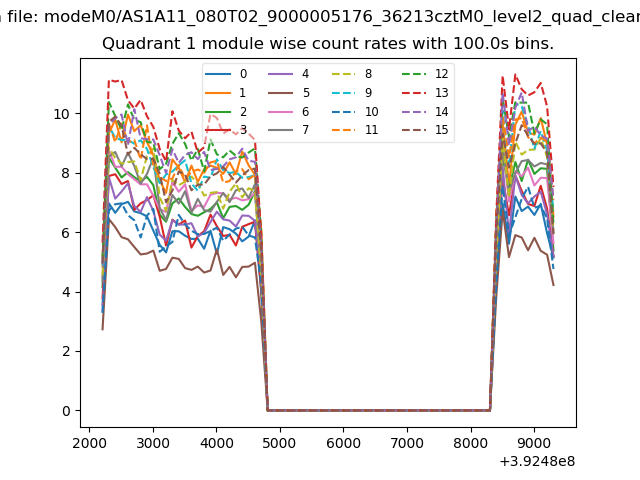
| Module-wise count rates for Quadrant A Data is divided into 100 sec bins |
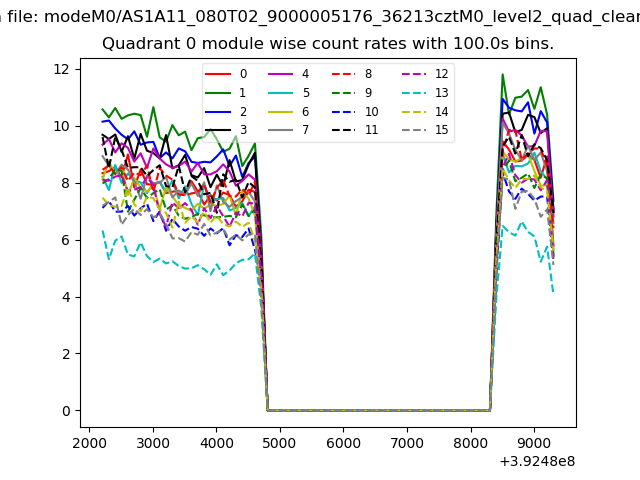 |
 |
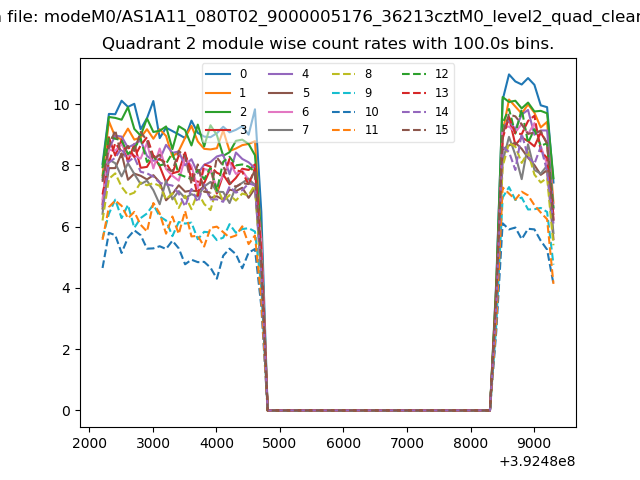
| Module-wise count rates for Quadrant B Data is divided into 100 sec bins |
 |
 |
| Module-wise count rates for Quadrant C Data is divided into 100 sec bins |
 |
 |
| Module-wise count rates for Quadrant D Data is divided into 100 sec bins |
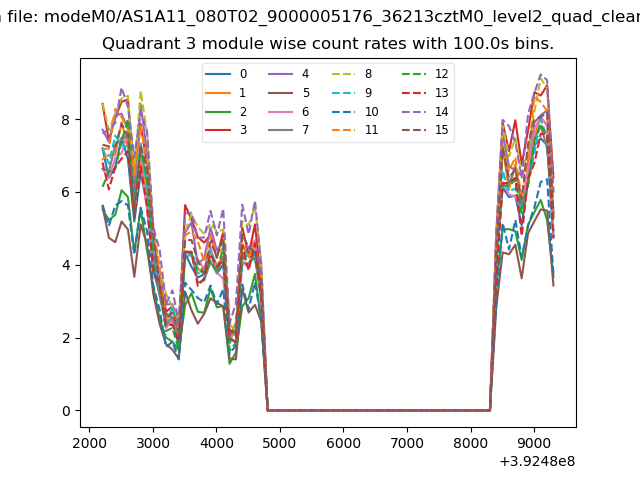 |
 |
| Parameter | Plot |
|---|---|
| CZT HV Monitor | 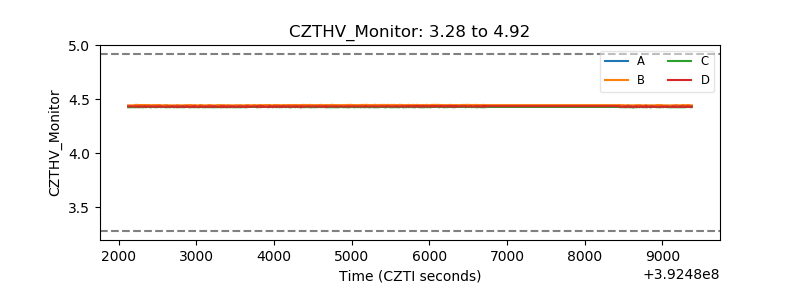 |
| D_VDD | 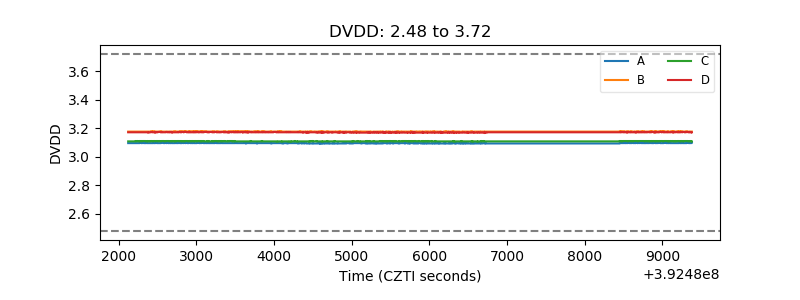 |
| Temperature 1 | 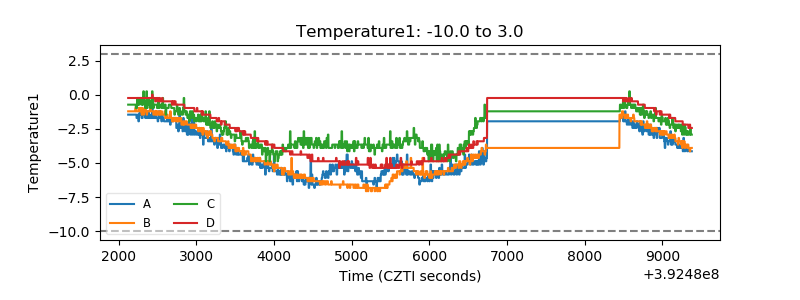 |
| Veto HV Monitor |  |
| Veto LLD | 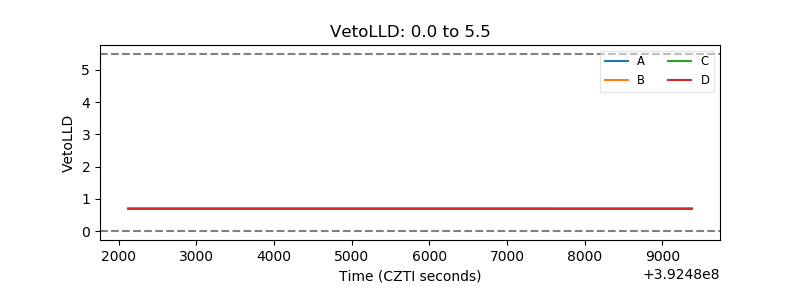 |
| Alpha Counter | 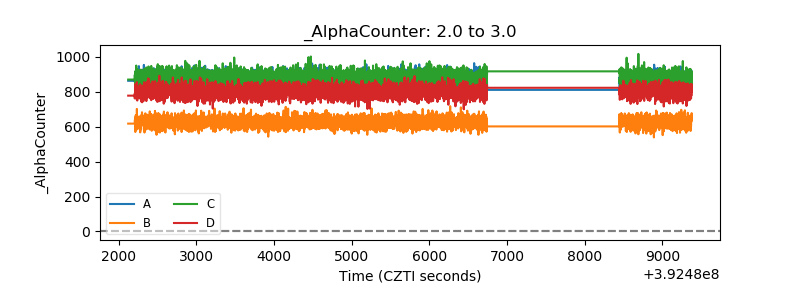 |
| _CPM_Rate | 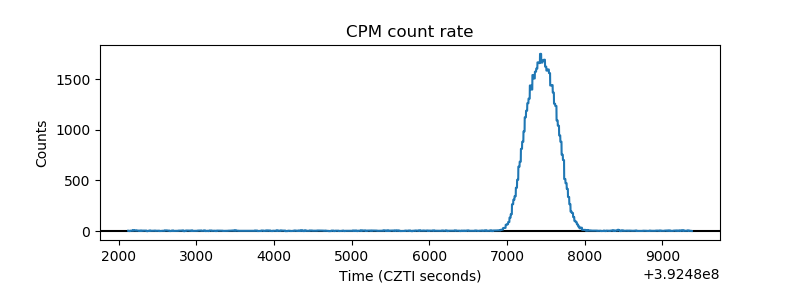 |
| CZT Counter | 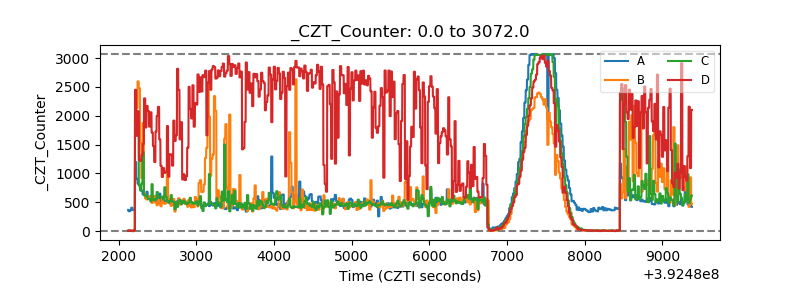 |
| +2.5 Volts monitor | 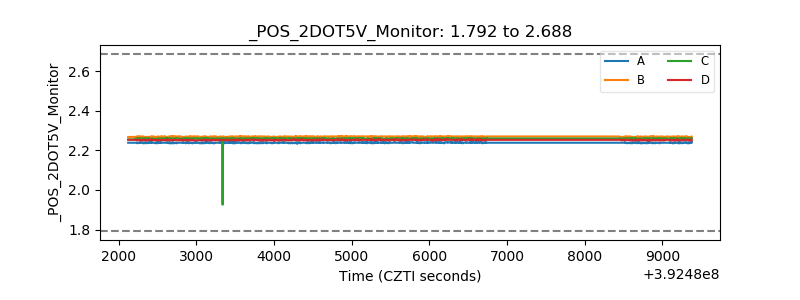 |
| +5 Volts monitor | 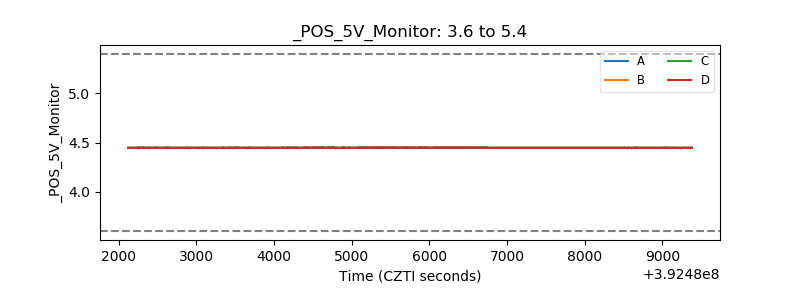 |
| _ROLL_ROT | 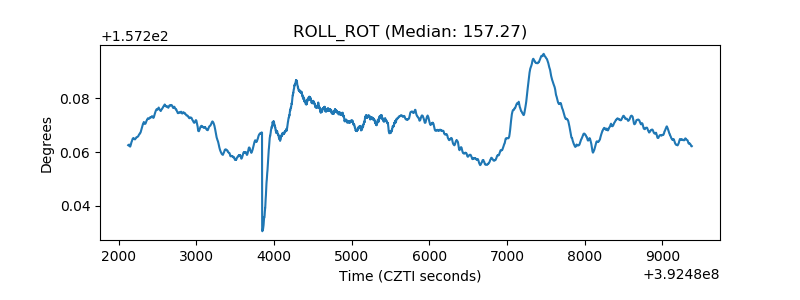 |
| _Roll_DEC | 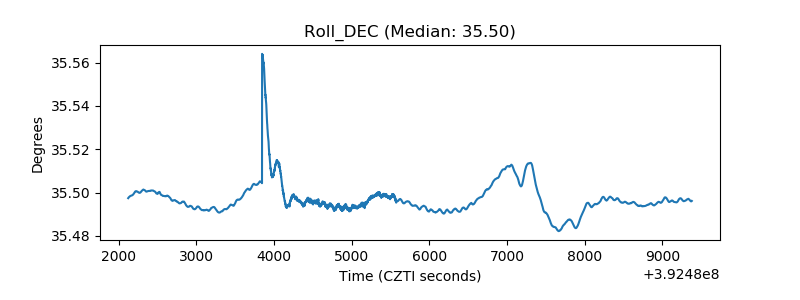 |
| _Roll_RA | 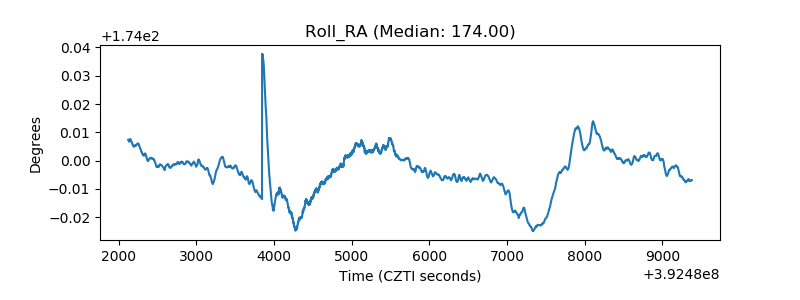 |
| Veto Counter | 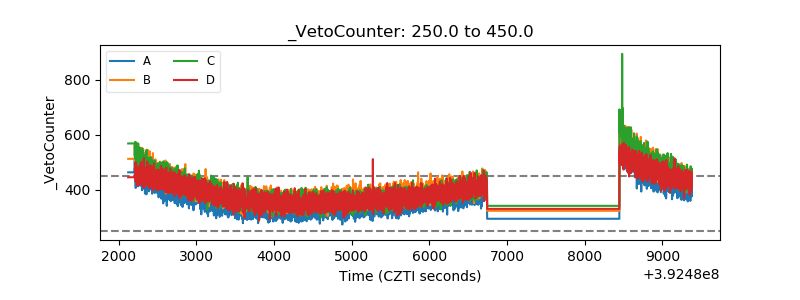 |