| Param | Original file | Final file |
|---|---|---|
| Filename | modeM0/AS1A11_080T02_9000005176_36212cztM0_level2.evt | modeM0/AS1A11_080T02_9000005176_36212cztM0_level2_quad_clean.evt |
| Size (bytes) | 688,026,240 | 69,690,240 |
| Size | 656.2 MB | 66.5 MB |
| Events in quadrant A | 2,860,136 | 473,478 |
| Events in quadrant B | 3,141,677 | 467,531 |
| Events in quadrant C | 6,670,931 | 379,683 |
| Events in quadrant D | 7,788,787 | 399,022 |
| Mode M9 | |||
|---|---|---|---|
| Quadrant | BADHDUFLAG | Total packets | Discarded packets |
| A | 0 | 15 | 0 |
| B | 0 | 15 | 0 |
| C | 0 | 15 | 0 |
| D | 0 | 15 | 0 |
| Mode M0 | |||
|---|---|---|---|
| Quadrant | BADHDUFLAG | Total packets | Discarded packets |
| A | 0 | 12082 | 3 |
| B | 0 | 12977 | 2 |
| C | 0 | 23390 | 2 |
| D | 0 | 27033 | 2 |
| Mode SS | |||
|---|---|---|---|
| Quadrant | BADHDUFLAG | Total packets | Discarded packets |
| A | 0 | 114 | 0 |
| B | 0 | 114 | 0 |
| C | 0 | 114 | 0 |
| D | 0 | 114 | 0 |
| Quadrant | Total seconds | Saturated seconds | Saturation percentage |
|---|---|---|---|
| A | 5561 | 12 | 0.215789% |
| B | 5561 | 158 | 2.841216% |
| C | 5561 | 1380 | 24.815681% |
| D | 5561 | 1069 | 19.223161% |
Noise dominated data is calculated using 1-second bins in cleaned event files. If a bin has >2000 counts, and if more than 50% of those come from <1% of pixels, then it is considered to be noise-dominated and hence unusable.
| Quadrant | # 1 sec bins | Bins with >0 counts | Bins with >2000 counts | High rate bins dominated by noise | Noise dominated (total time) | Noise dominated (detector-on time) | Marked lightcurve |
|---|---|---|---|---|---|---|---|
| A | 7144 | 5562 | 1 | 1 | 0.01% | 0.02% | 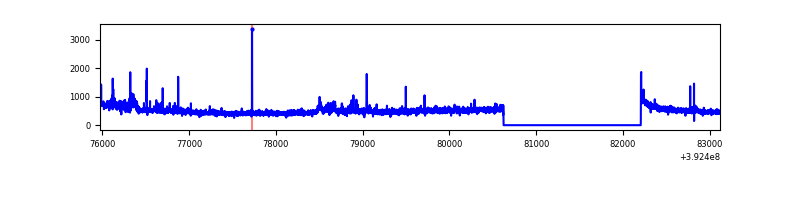 |
| B | 7144 | 5562 | 110 | 110 | 1.54% | 1.98% | 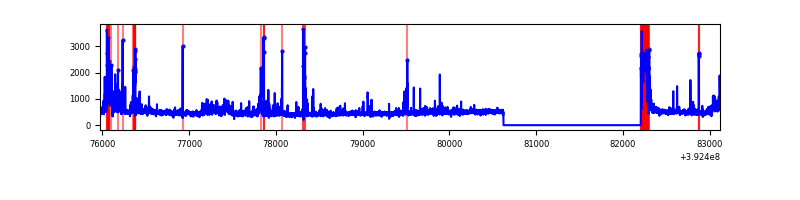 |
| C | 7144 | 5562 | 1225 | 1225 | 17.15% | 22.02% | 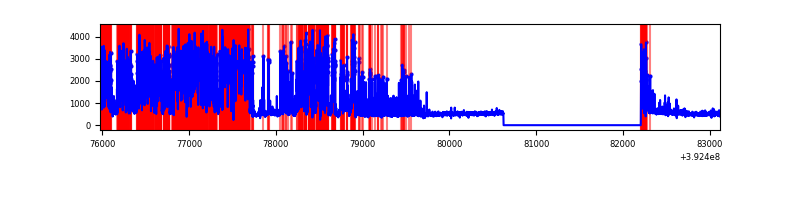 |
| D | 7143 | 5561 | 1024 | 1024 | 14.34% | 18.41% | 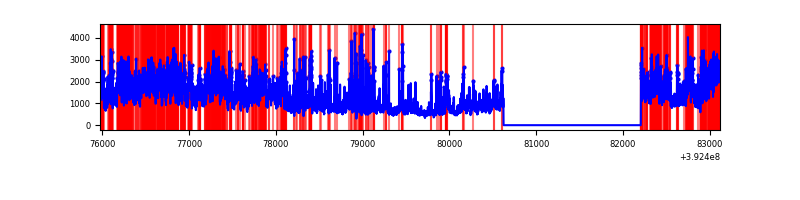 |
Top three noisy pixels from each quadrant. If the there are fewer than three noisy pixels in the level2.evt file, extra rows are filled as -1
| Pixel properties | Quadrant properties | ||||||
|---|---|---|---|---|---|---|---|
| Quadrant | DetID | PixID | Counts | Sigma | Mean | Median | Sigma |
| A | 15 | 223 | 185142 | 1443.8 | 630 | 617 | 127.8 |
| A | 10 | 83 | 182256 | 1421.22 | 630 | 617 | 127.8 |
| A | 9 | 143 | 39390 | 303.38 | 630 | 617 | 127.8 |
| B | 5 | 172 | 492601 | 4162.84 | 620 | 603 | 118.2 |
| B | 4 | 232 | 51081 | 427.1 | 620 | 603 | 118.2 |
| B | 0 | 197 | 47909 | 400.26 | 620 | 603 | 118.2 |
| C | 4 | 254 | 3895321 | 30055.0 | 552 | 556 | 129.6 |
| C | 0 | 10 | 330273 | 2544.35 | 552 | 556 | 129.6 |
| C | 15 | 214 | 212048 | 1632.04 | 552 | 556 | 129.6 |
| D | 12 | 235 | 4739775 | 32918.01 | 585 | 568 | 144.0 |
| D | 12 | 6 | 325263 | 2255.3 | 585 | 568 | 144.0 |
| D | 12 | 227 | 124453 | 860.49 | 585 | 568 | 144.0 |
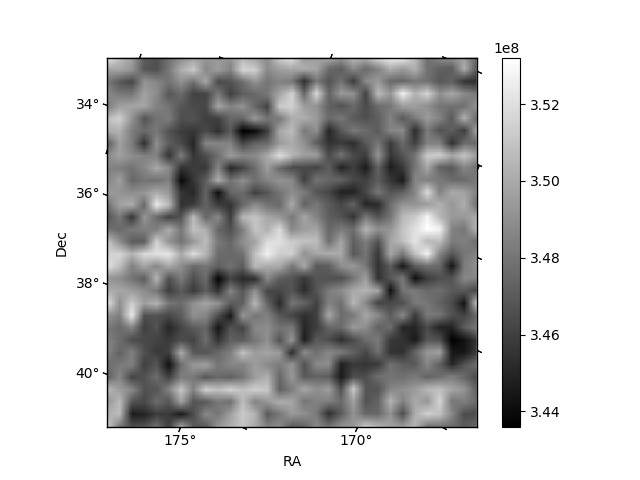
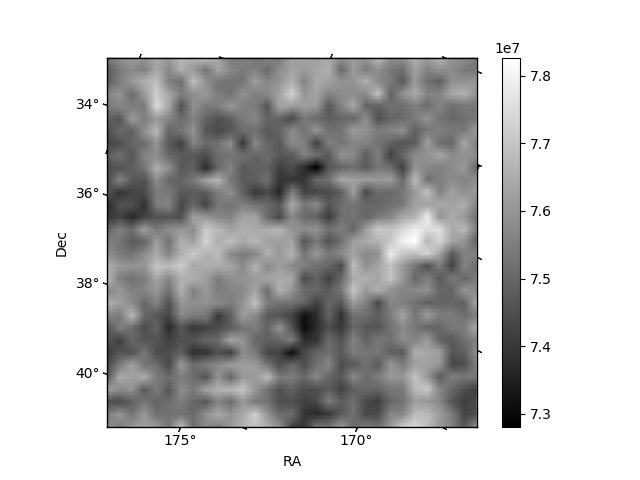
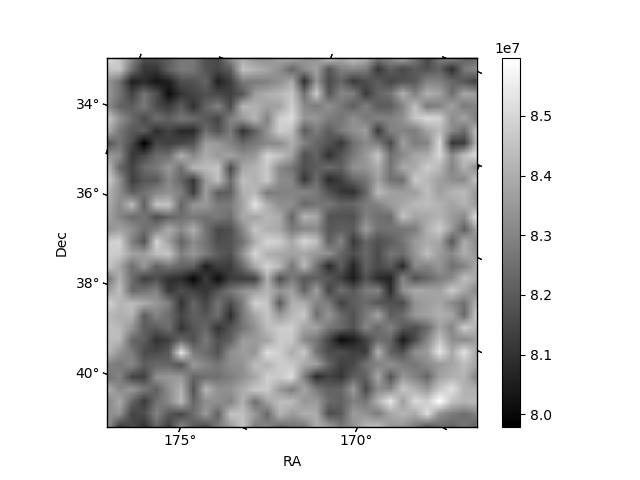
Histogram calculated using DETX and DETY for each event in the final _common_clean file
| Quadrant A | 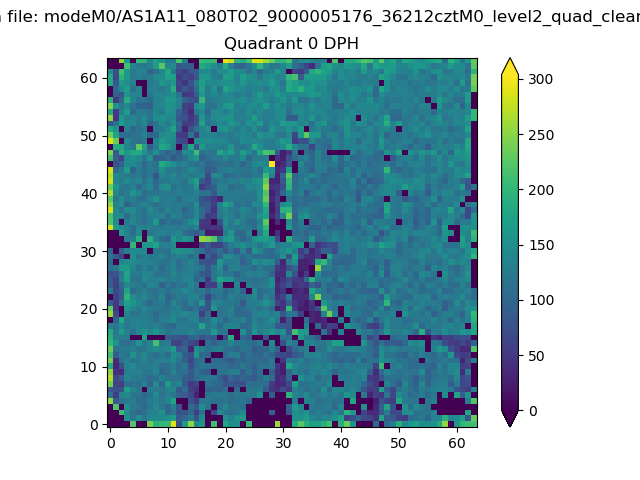 |
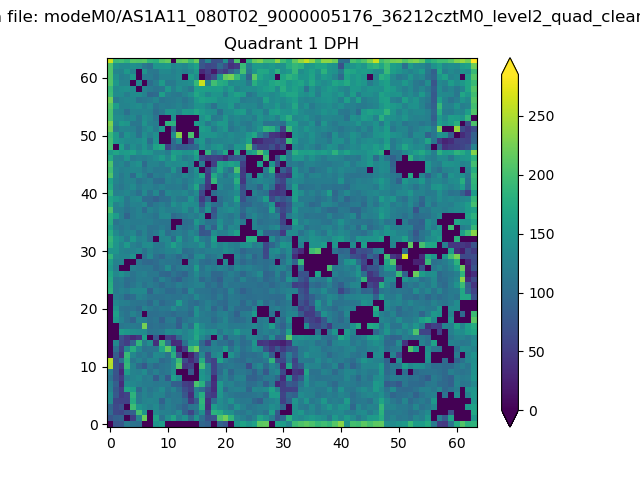 |
Quadrant B |
|---|---|---|---|
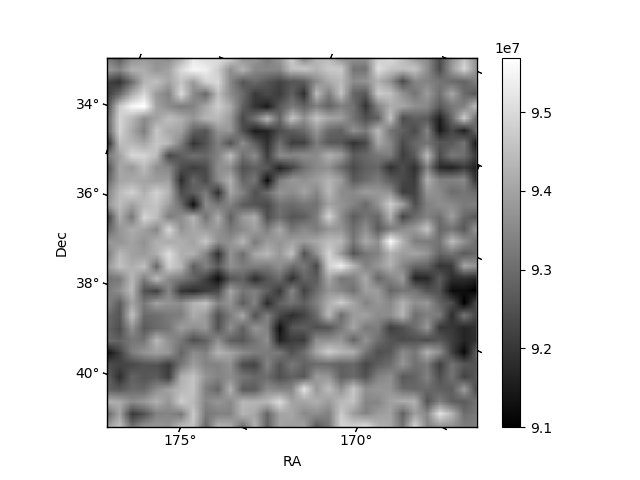
| Quadrant D |  |
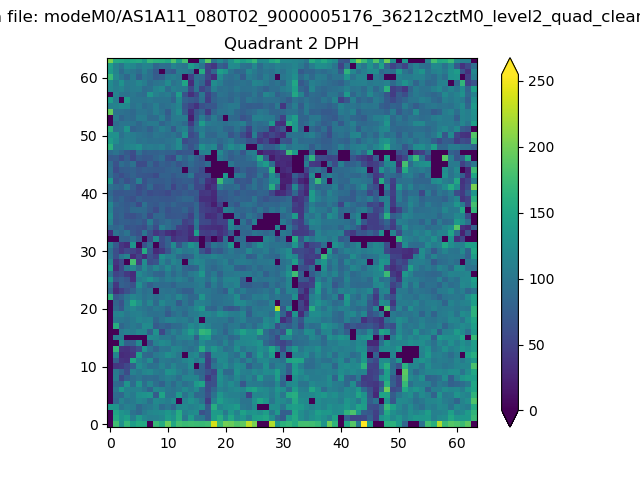 |
Quadrant C |
| Plot type | Count rate plots | Images |
|---|---|---|
| Comparison with Poisson distribution Blue bars denote a histogram of data divided into 1 sec bins. Red curve is a Poisson curve with rate = median count rate of data. |
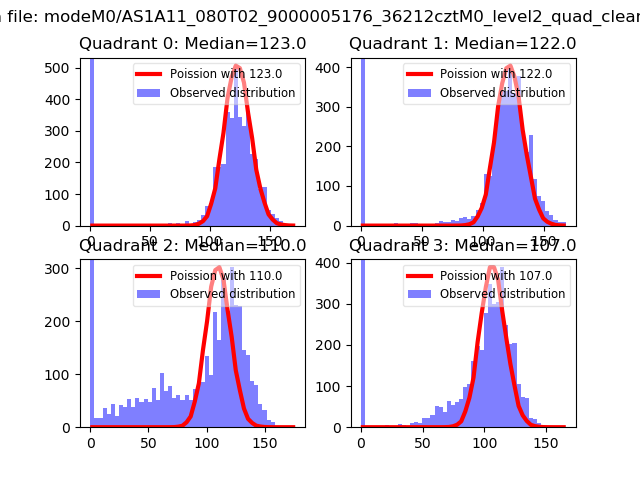 |
 |
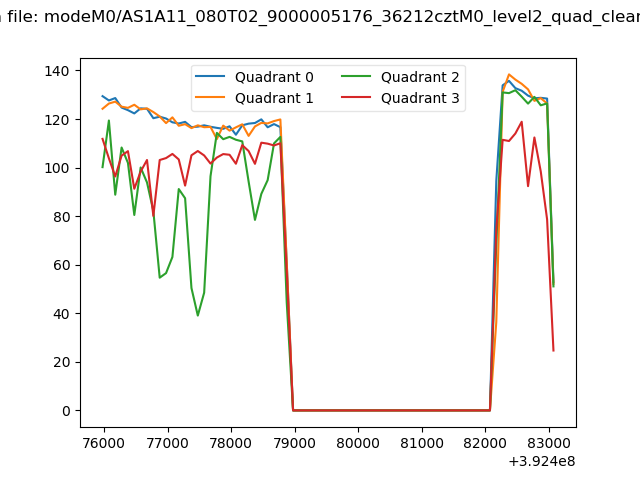
| Quadrant-wise count rates Data is divided into 100 sec bins |
 |
|
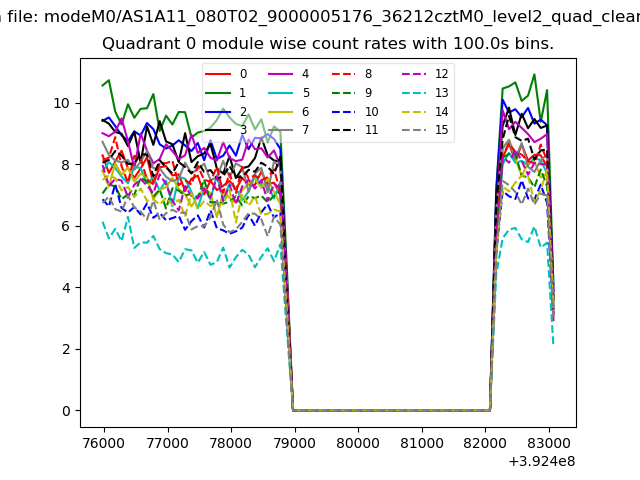
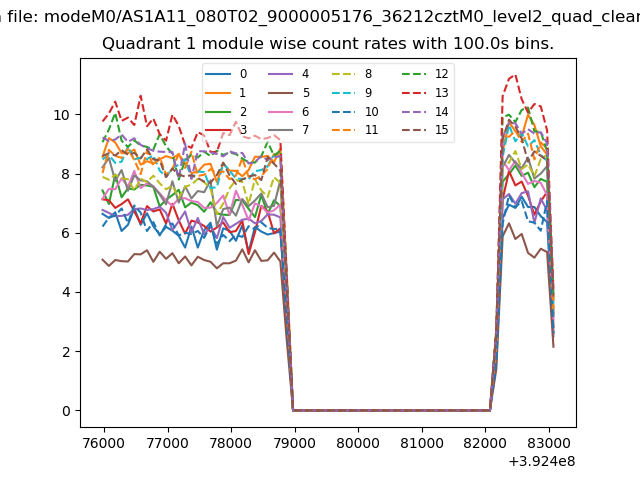
| Module-wise count rates for Quadrant A Data is divided into 100 sec bins |
 |
 |
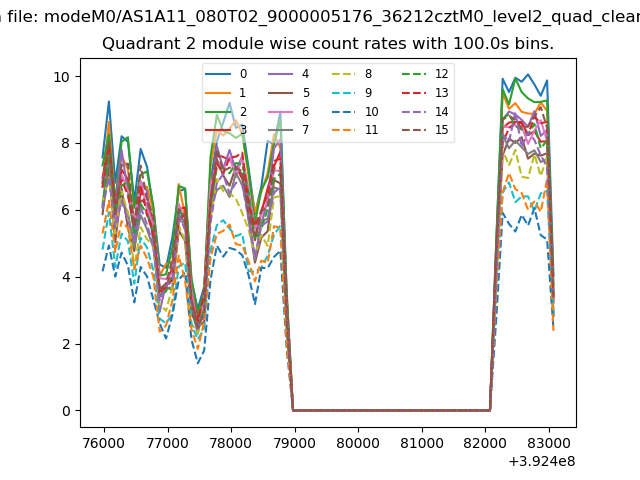
| Module-wise count rates for Quadrant B Data is divided into 100 sec bins |
 |
 |
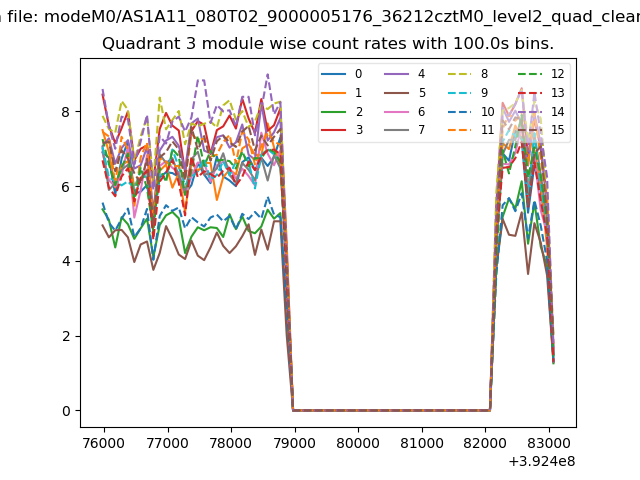
| Module-wise count rates for Quadrant C Data is divided into 100 sec bins |
 |
 |
| Module-wise count rates for Quadrant D Data is divided into 100 sec bins |
 |
 |
| Parameter | Plot |
|---|---|
| CZT HV Monitor | 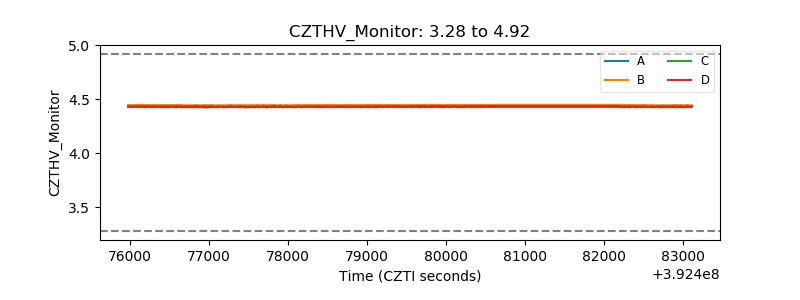 |
| D_VDD | 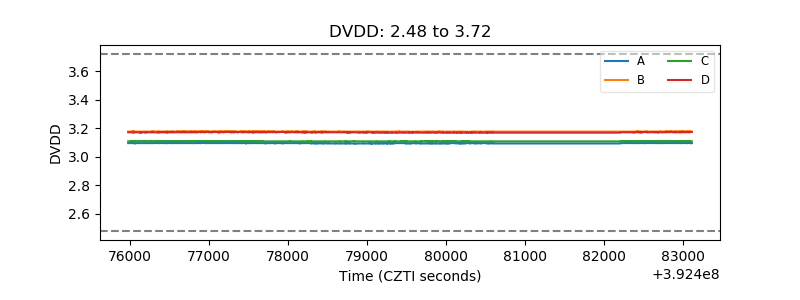 |
| Temperature 1 | 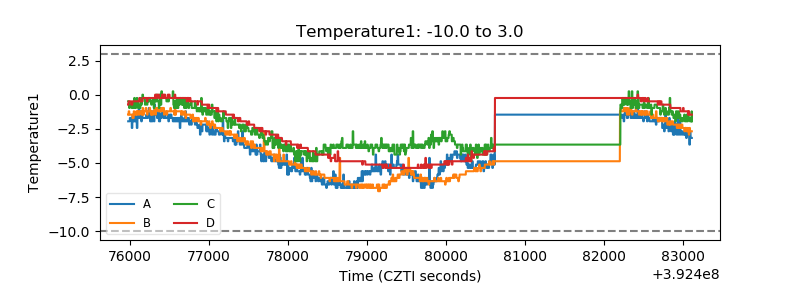 |
| Veto HV Monitor | 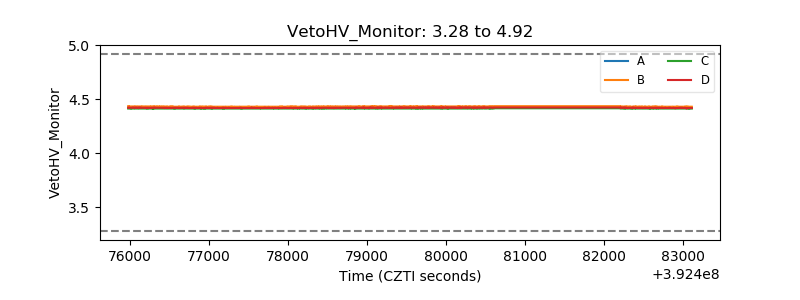 |
| Veto LLD | 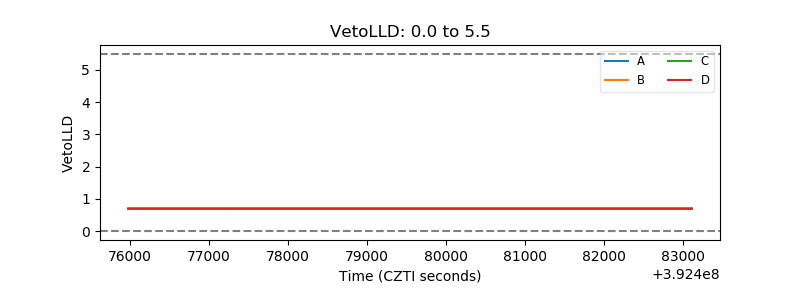 |
| Alpha Counter | 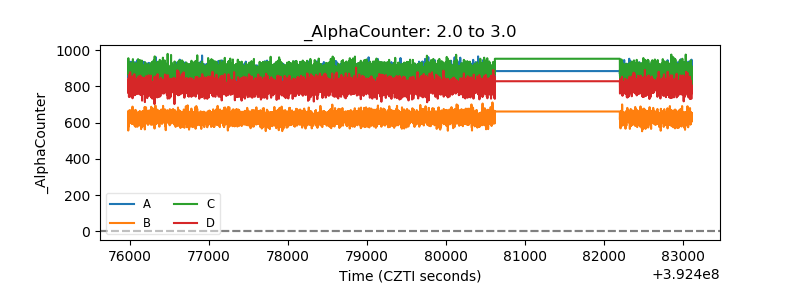 |
| _CPM_Rate | 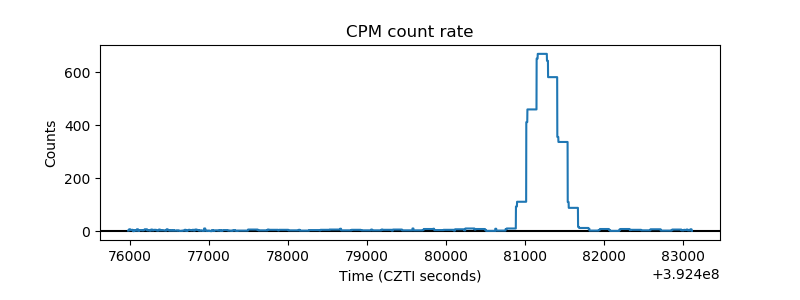 |
| CZT Counter | 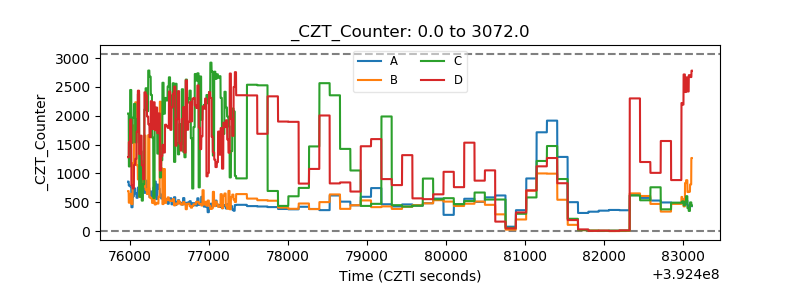 |
| +2.5 Volts monitor | 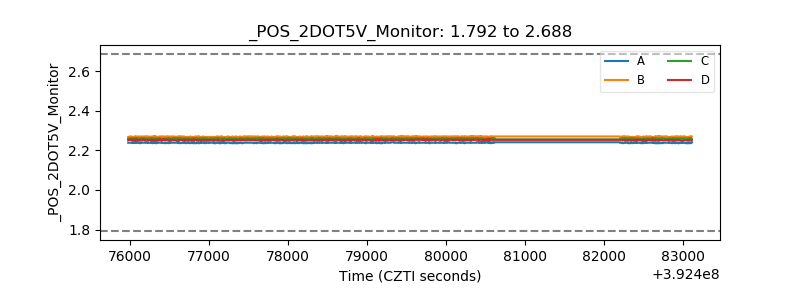 |
| +5 Volts monitor | 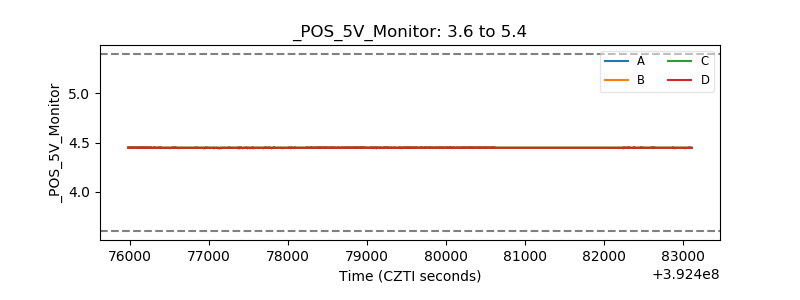 |
| _ROLL_ROT |  |
| _Roll_DEC | 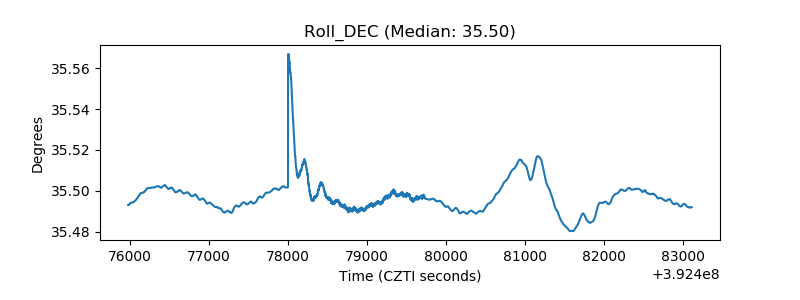 |
| _Roll_RA | 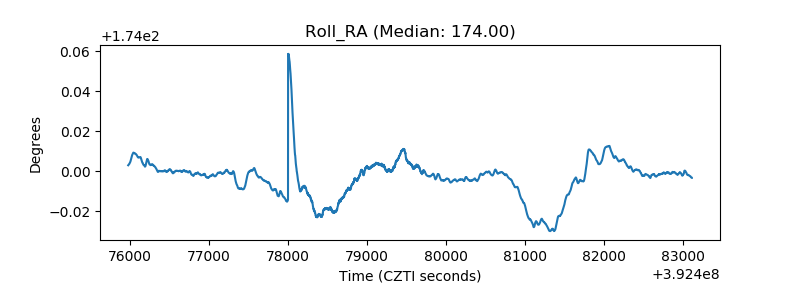 |
| Veto Counter | 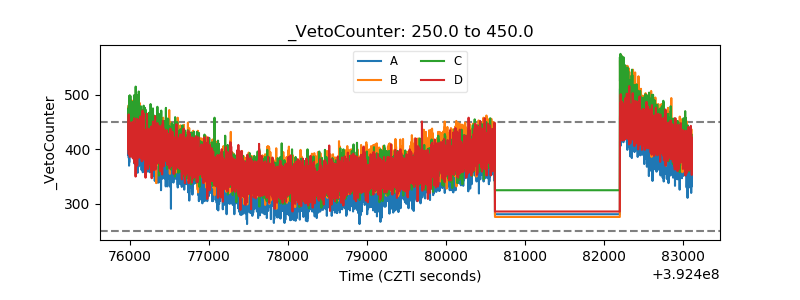 |