| Param | Original file | Final file |
|---|---|---|
| Filename | modeM0/AS1A11_080T02_9000005176_36211cztM0_level2.evt | modeM0/AS1A11_080T02_9000005176_36211cztM0_level2_quad_clean.evt |
| Size (bytes) | 1,238,497,920 | 144,702,720 |
| Size | 1.2 GB | 138.0 MB |
| Events in quadrant A | 5,465,540 | 975,284 |
| Events in quadrant B | 6,305,532 | 969,881 |
| Events in quadrant C | 13,550,633 | 841,949 |
| Events in quadrant D | 11,476,055 | 862,590 |
| Mode M9 | |||
|---|---|---|---|
| Quadrant | BADHDUFLAG | Total packets | Discarded packets |
| A | 0 | 29 | 0 |
| B | 0 | 29 | 0 |
| C | 0 | 29 | 0 |
| D | 0 | 29 | 0 |
| Mode M0 | |||
|---|---|---|---|
| Quadrant | BADHDUFLAG | Total packets | Discarded packets |
| A | 0 | 23009 | 3 |
| B | 0 | 25378 | 2 |
| C | 0 | 47190 | 2 |
| D | 0 | 41287 | 2 |
| Mode SS | |||
|---|---|---|---|
| Quadrant | BADHDUFLAG | Total packets | Discarded packets |
| A | 0 | 214 | 0 |
| B | 0 | 214 | 0 |
| C | 0 | 214 | 0 |
| D | 0 | 214 | 0 |
| Quadrant | Total seconds | Saturated seconds | Saturation percentage |
|---|---|---|---|
| A | 10562 | 16 | 0.151486% |
| B | 10562 | 273 | 2.584738% |
| C | 10562 | 2988 | 28.290097% |
| D | 10562 | 1700 | 16.095436% |
Noise dominated data is calculated using 1-second bins in cleaned event files. If a bin has >2000 counts, and if more than 50% of those come from <1% of pixels, then it is considered to be noise-dominated and hence unusable.
| Quadrant | # 1 sec bins | Bins with >0 counts | Bins with >2000 counts | High rate bins dominated by noise | Noise dominated (total time) | Noise dominated (detector-on time) | Marked lightcurve |
|---|---|---|---|---|---|---|---|
| A | 13398 | 10564 | 1 | 1 | 0.01% | 0.01% | 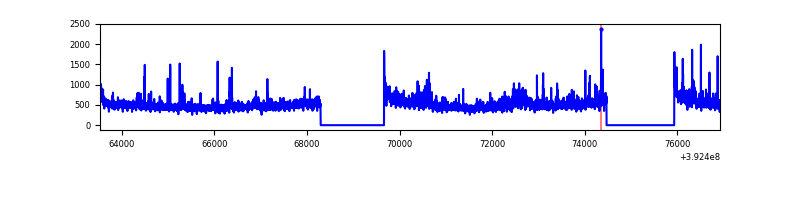 |
| B | 13398 | 10564 | 170 | 170 | 1.27% | 1.61% | 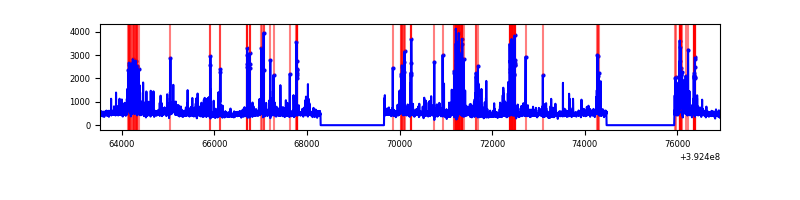 |
| C | 13398 | 10564 | 2640 | 2640 | 19.70% | 24.99% | 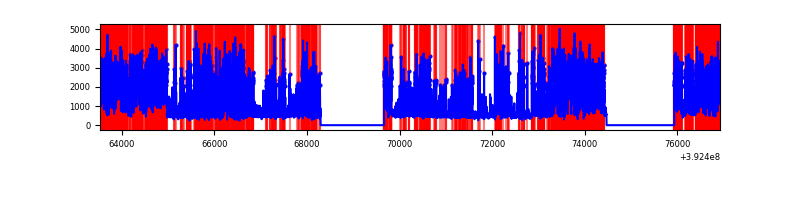 |
| D | 13398 | 10564 | 1523 | 1523 | 11.37% | 14.42% | 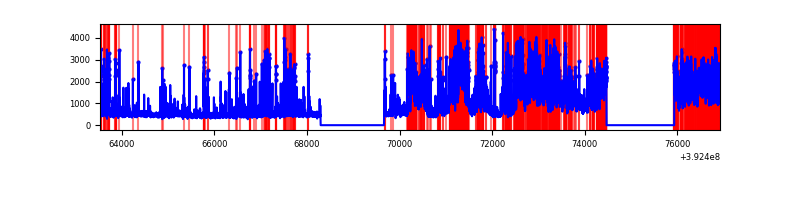 |
Top three noisy pixels from each quadrant. If the there are fewer than three noisy pixels in the level2.evt file, extra rows are filled as -1
| Pixel properties | Quadrant properties | ||||||
|---|---|---|---|---|---|---|---|
| Quadrant | DetID | PixID | Counts | Sigma | Mean | Median | Sigma |
| A | 15 | 223 | 416957 | 1714.47 | 1199 | 1173 | 242.5 |
| A | 10 | 83 | 305078 | 1253.14 | 1199 | 1173 | 242.5 |
| A | 9 | 143 | 93241 | 379.64 | 1199 | 1173 | 242.5 |
| B | 5 | 172 | 1022893 | 4544.43 | 1182 | 1149 | 224.8 |
| B | 0 | 190 | 214502 | 948.93 | 1182 | 1149 | 224.8 |
| B | 4 | 232 | 115403 | 508.17 | 1182 | 1149 | 224.8 |
| C | 4 | 254 | 8298254 | 34644.03 | 1033 | 1038 | 239.5 |
| C | 15 | 214 | 404658 | 1685.26 | 1033 | 1038 | 239.5 |
| C | 0 | 207 | 397256 | 1654.36 | 1033 | 1038 | 239.5 |
| D | 12 | 235 | 4650986 | 17065.9 | 1117 | 1085 | 272.5 |
| D | 12 | 6 | 907967 | 3328.4 | 1117 | 1085 | 272.5 |
| D | 12 | 227 | 613250 | 2246.75 | 1117 | 1085 | 272.5 |
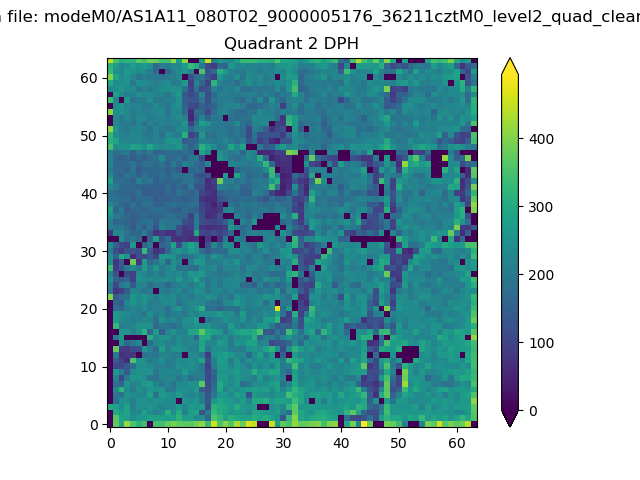
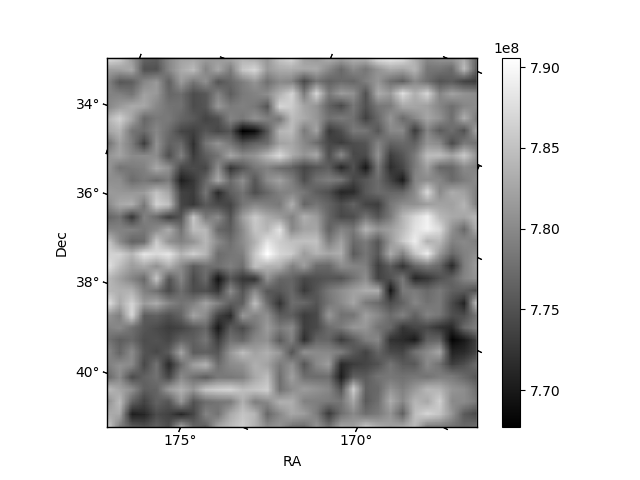
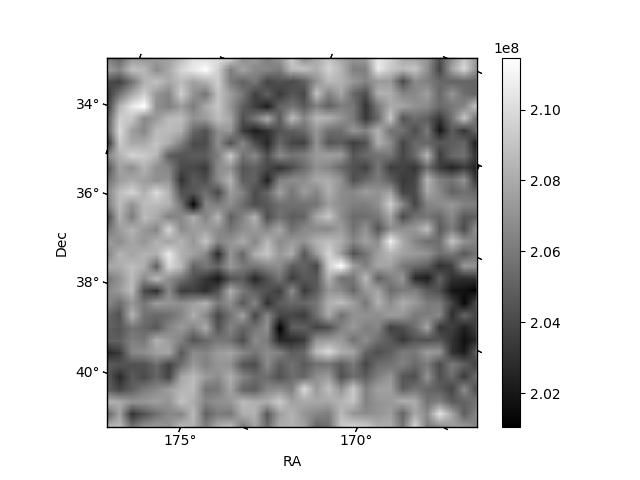
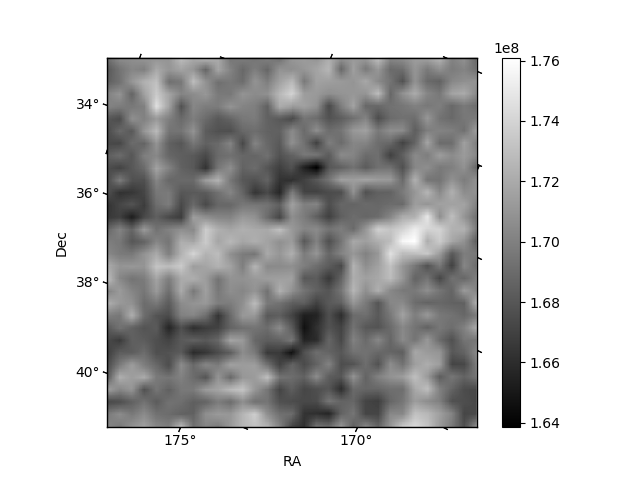
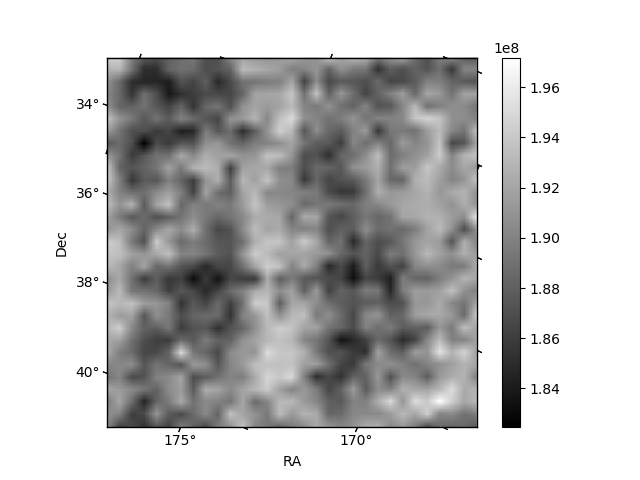
Histogram calculated using DETX and DETY for each event in the final _common_clean file
| Quadrant A | 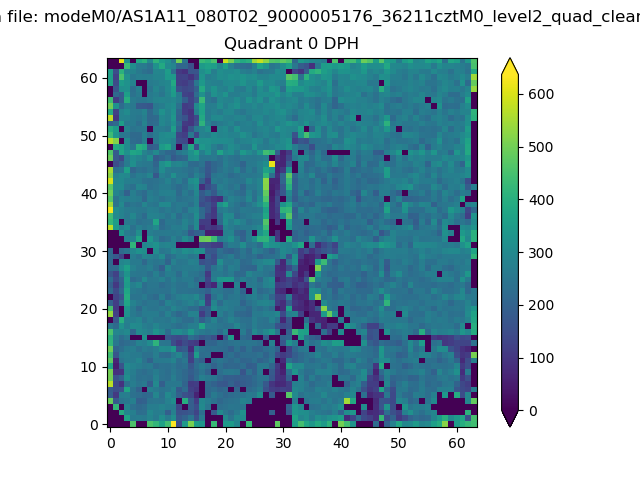 |
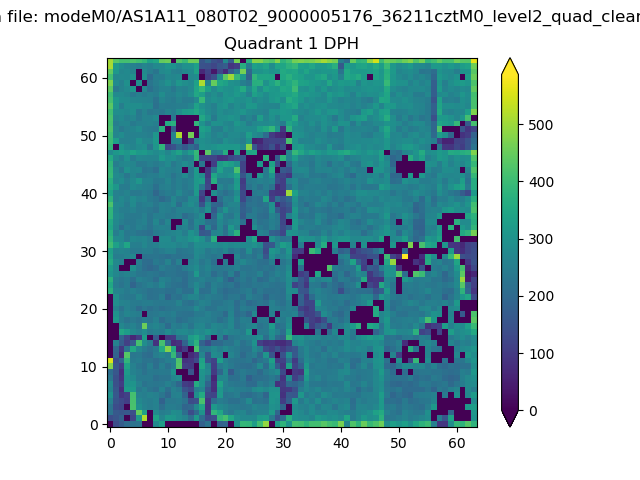 |
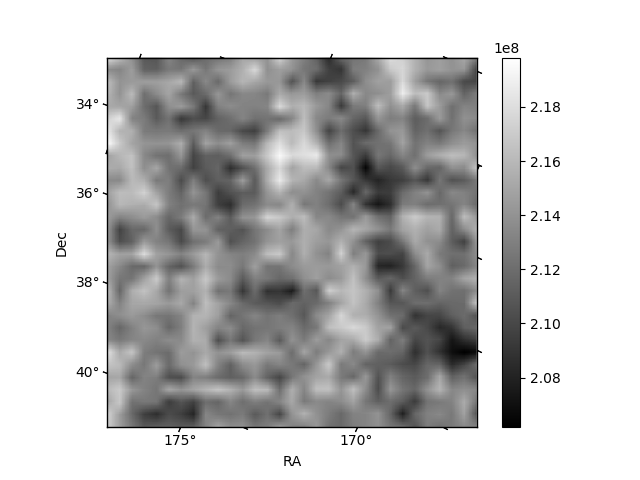
Quadrant B |
|---|---|---|---|
| Quadrant D | 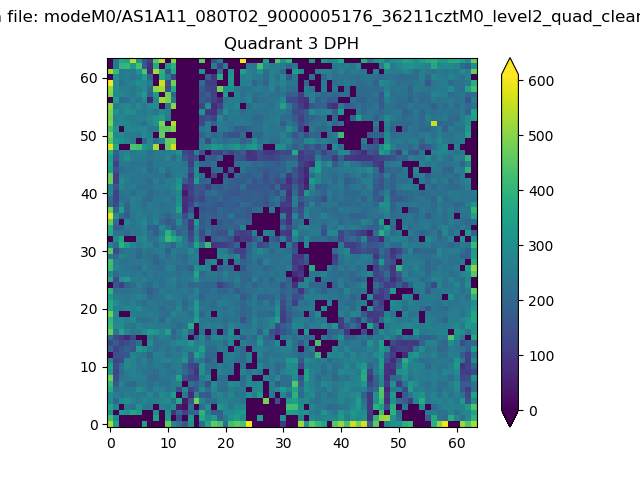 |
 |
Quadrant C |
| Plot type | Count rate plots | Images |
|---|---|---|
| Comparison with Poisson distribution Blue bars denote a histogram of data divided into 1 sec bins. Red curve is a Poisson curve with rate = median count rate of data. |
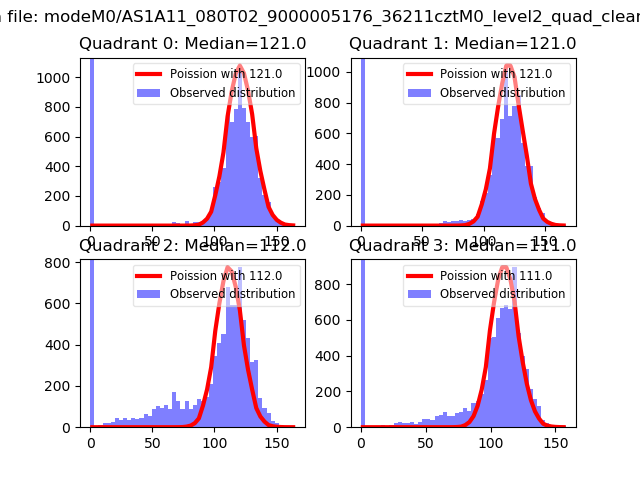 |
 |
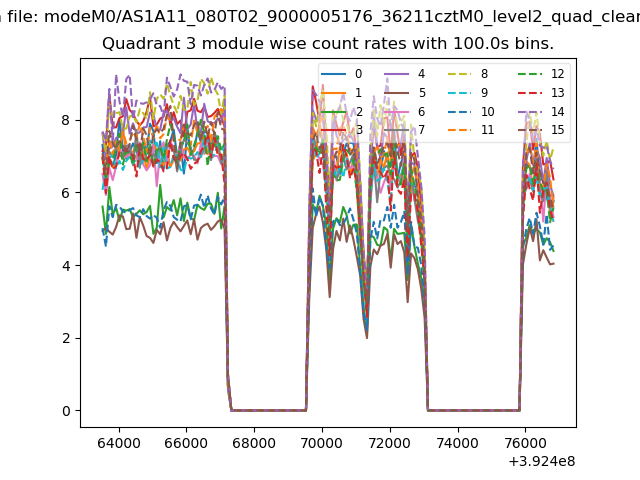
| Quadrant-wise count rates Data is divided into 100 sec bins |
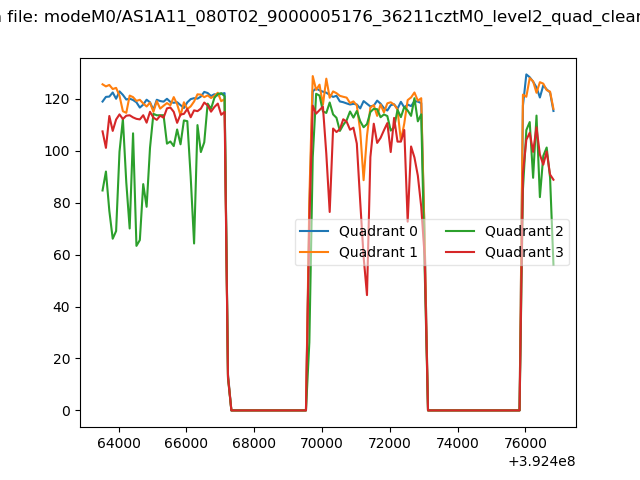 |
|
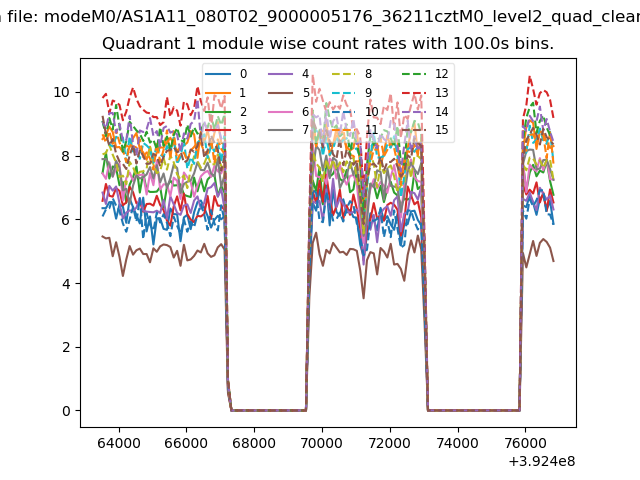
| Module-wise count rates for Quadrant A Data is divided into 100 sec bins |
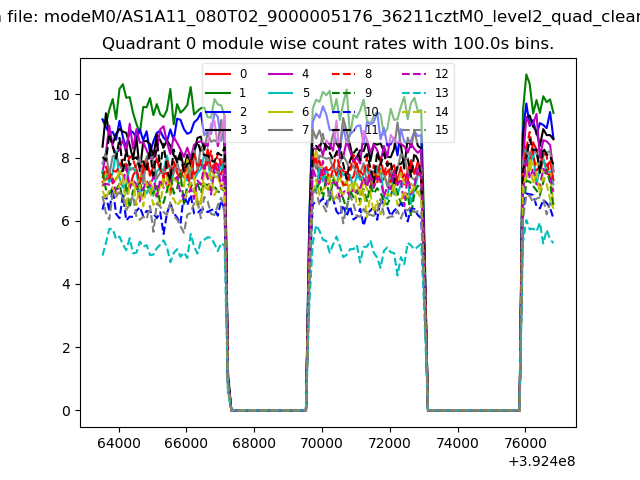 |
 |
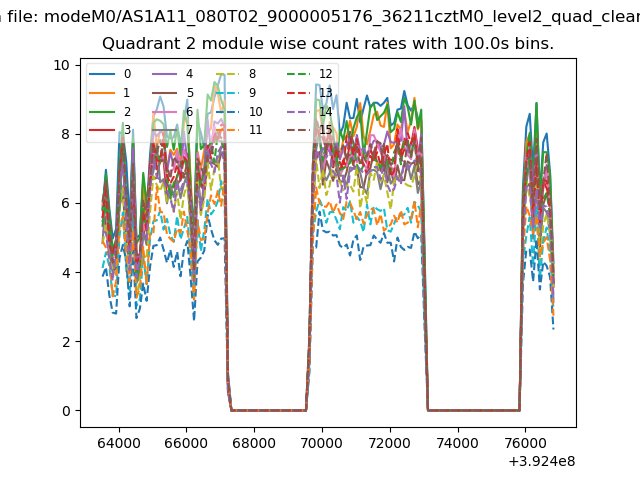
| Module-wise count rates for Quadrant B Data is divided into 100 sec bins |
 |
 |
| Module-wise count rates for Quadrant C Data is divided into 100 sec bins |
 |
 |
| Module-wise count rates for Quadrant D Data is divided into 100 sec bins |
 |
 |
| Parameter | Plot |
|---|---|
| CZT HV Monitor | 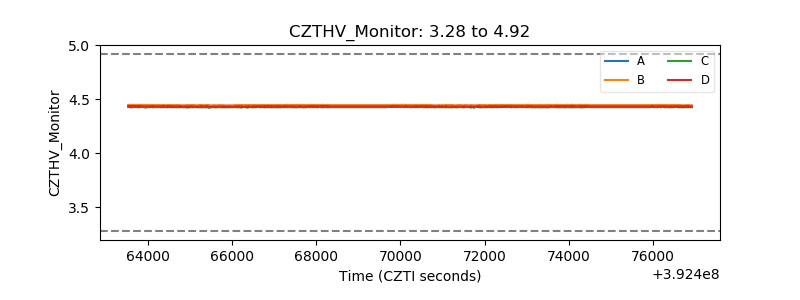 |
| D_VDD | 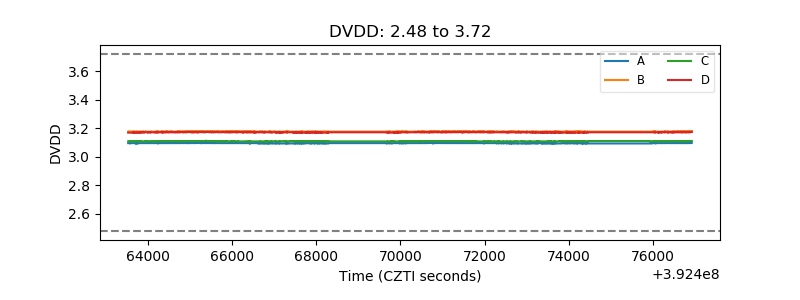 |
| Temperature 1 | 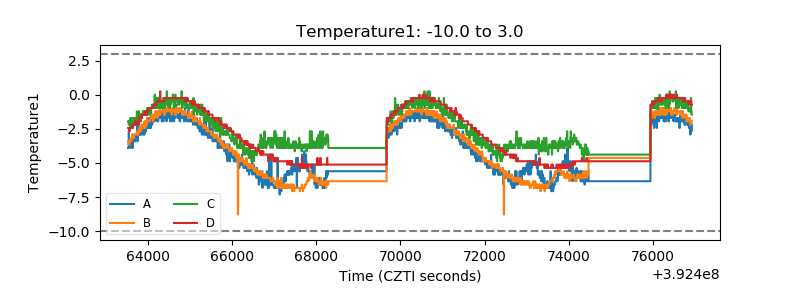 |
| Veto HV Monitor | 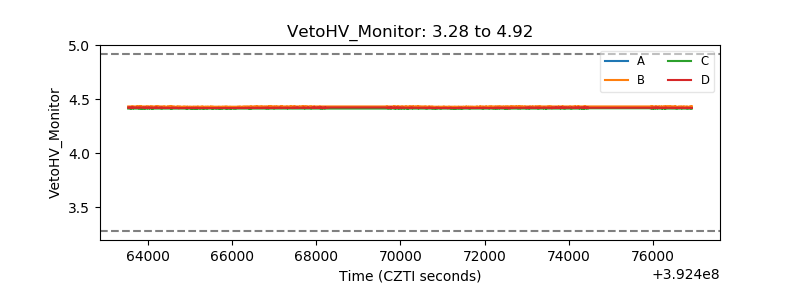 |
| Veto LLD | 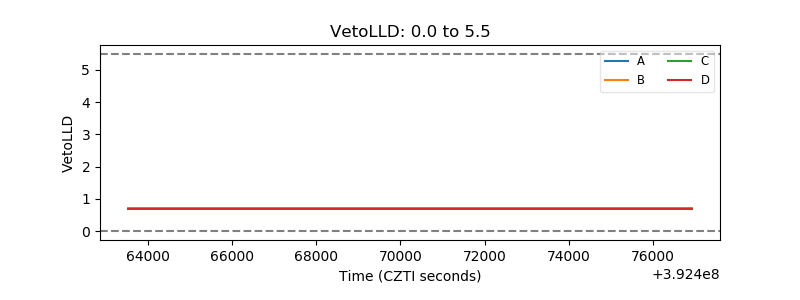 |
| Alpha Counter | 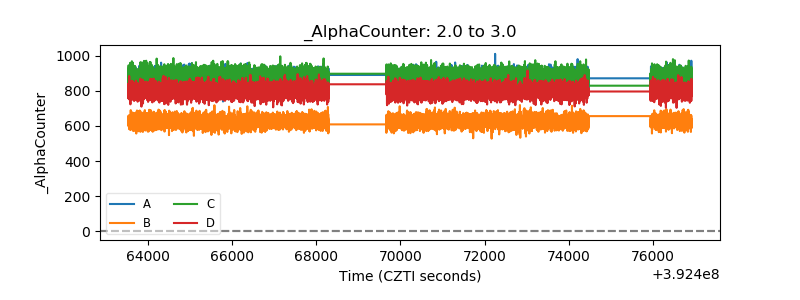 |
| _CPM_Rate | 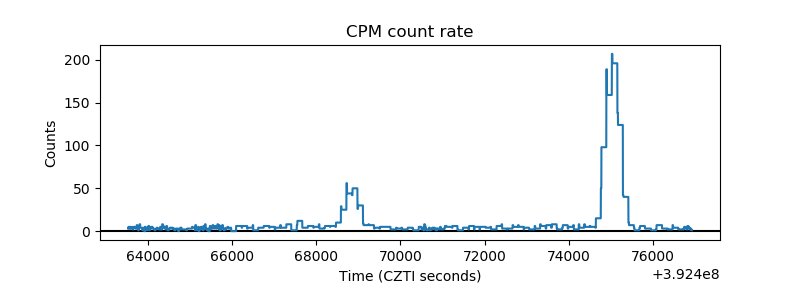 |
| CZT Counter | 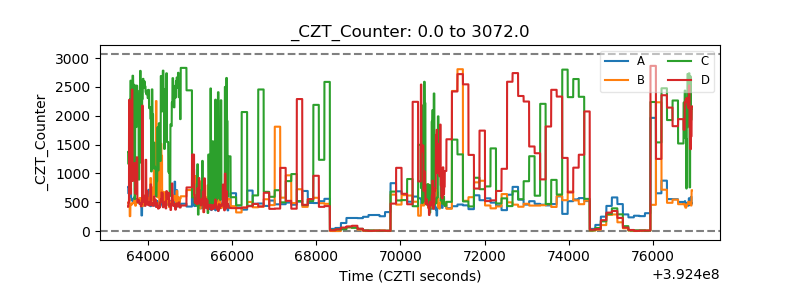 |
| +2.5 Volts monitor | 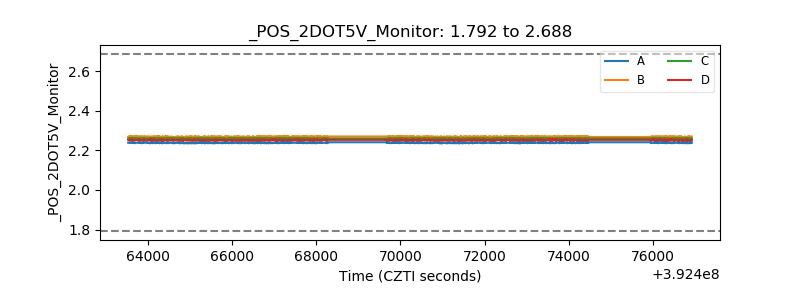 |
| +5 Volts monitor | 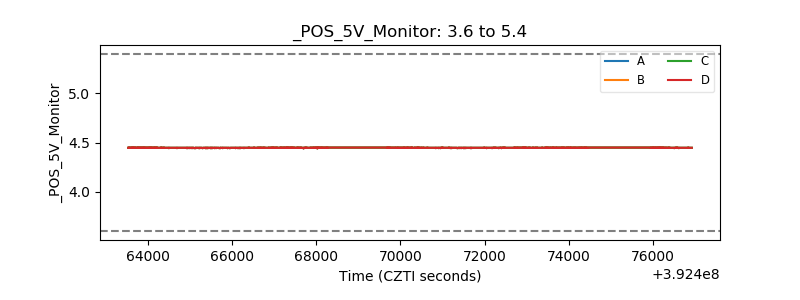 |
| _ROLL_ROT | 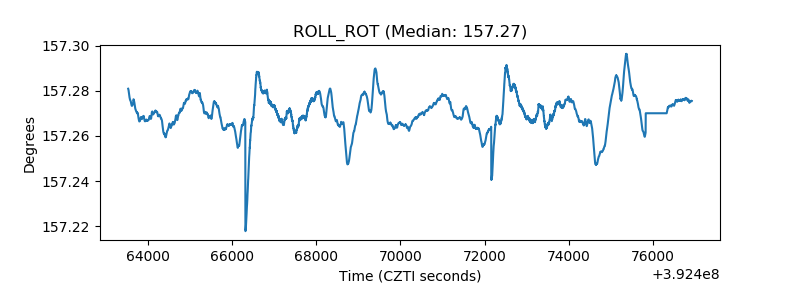 |
| _Roll_DEC | 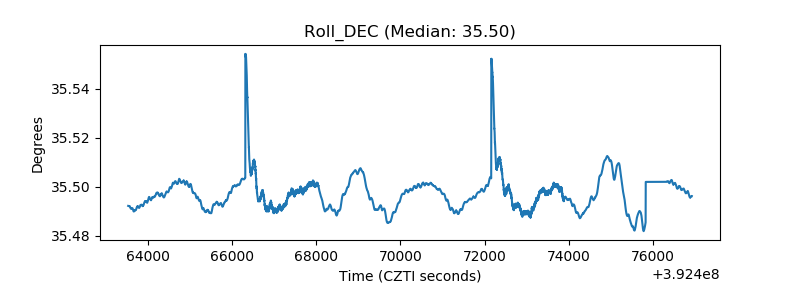 |
| _Roll_RA | 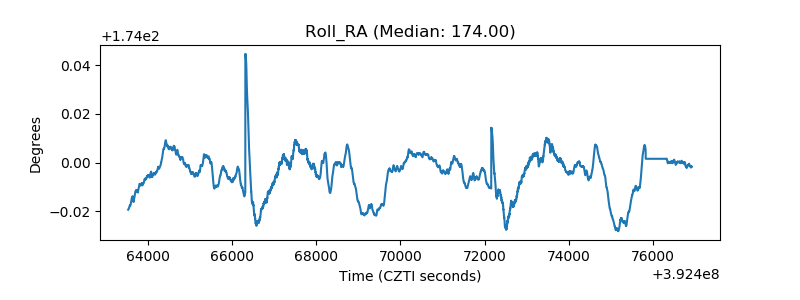 |
| Veto Counter | 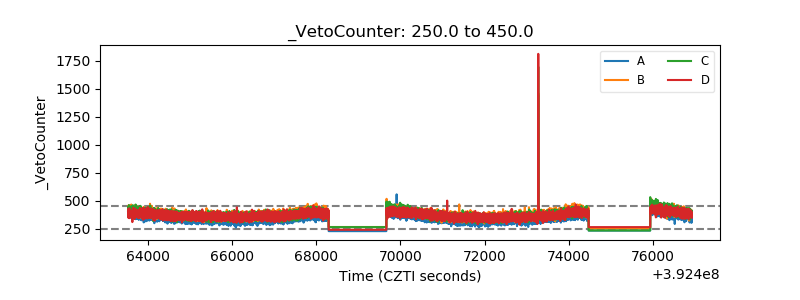 |