| Param | Original file | Final file |
|---|---|---|
| Filename | modeM0/AS1A11_080T02_9000005176_36208cztM0_level2.evt | modeM0/AS1A11_080T02_9000005176_36208cztM0_level2_quad_clean.evt |
| Size (bytes) | 764,640,000 | 73,114,560 |
| Size | 729.2 MB | 69.7 MB |
| Events in quadrant A | 3,045,439 | 507,541 |
| Events in quadrant B | 3,766,753 | 499,153 |
| Events in quadrant C | 12,145,277 | 322,423 |
| Events in quadrant D | 3,806,489 | 476,548 |
| Mode M9 | |||
|---|---|---|---|
| Quadrant | BADHDUFLAG | Total packets | Discarded packets |
| A | 0 | 27 | 0 |
| B | 0 | 27 | 0 |
| C | 0 | 27 | 0 |
| D | 0 | 28 | 0 |
| Mode M0 | |||
|---|---|---|---|
| Quadrant | BADHDUFLAG | Total packets | Discarded packets |
| A | 0 | 12730 | 3 |
| B | 0 | 14888 | 2 |
| C | 0 | 40089 | 2 |
| D | 0 | 15153 | 2 |
| Mode SS | |||
|---|---|---|---|
| Quadrant | BADHDUFLAG | Total packets | Discarded packets |
| A | 0 | 118 | 0 |
| B | 0 | 118 | 0 |
| C | 0 | 118 | 0 |
| D | 0 | 118 | 0 |
| Quadrant | Total seconds | Saturated seconds | Saturation percentage |
|---|---|---|---|
| A | 5823 | 11 | 0.188906% |
| B | 5823 | 260 | 4.465052% |
| C | 5823 | 3769 | 64.726086% |
| D | 5823 | 182 | 3.125537% |
Noise dominated data is calculated using 1-second bins in cleaned event files. If a bin has >2000 counts, and if more than 50% of those come from <1% of pixels, then it is considered to be noise-dominated and hence unusable.
| Quadrant | # 1 sec bins | Bins with >0 counts | Bins with >2000 counts | High rate bins dominated by noise | Noise dominated (total time) | Noise dominated (detector-on time) | Marked lightcurve |
|---|---|---|---|---|---|---|---|
| A | 7166 | 5824 | 2 | 2 | 0.03% | 0.03% | 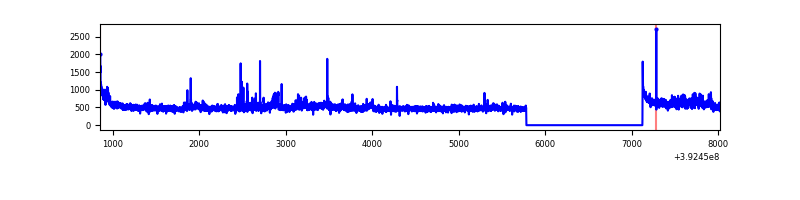 |
| B | 7166 | 5824 | 217 | 217 | 3.03% | 3.73% | 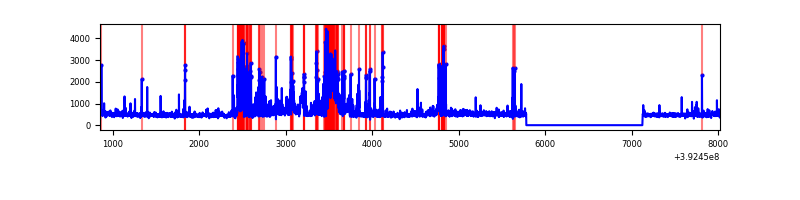 |
| C | 7166 | 5824 | 3412 | 3412 | 47.61% | 58.59% | 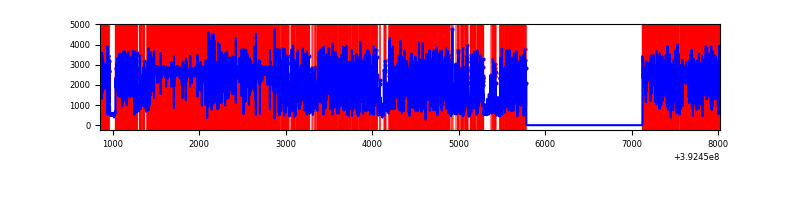 |
| D | 7166 | 5824 | 155 | 155 | 2.16% | 2.66% | 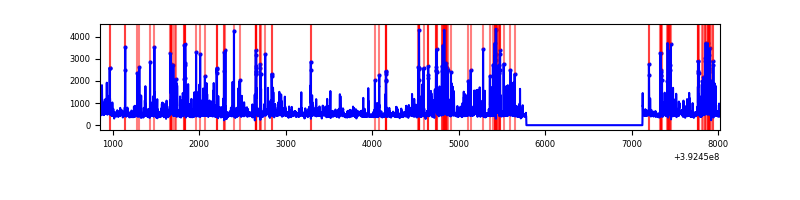 |
Top three noisy pixels from each quadrant. If the there are fewer than three noisy pixels in the level2.evt file, extra rows are filled as -1
| Pixel properties | Quadrant properties | ||||||
|---|---|---|---|---|---|---|---|
| Quadrant | DetID | PixID | Counts | Sigma | Mean | Median | Sigma |
| A | 10 | 83 | 186482 | 1374.83 | 665 | 652 | 135.2 |
| A | 15 | 223 | 149102 | 1098.28 | 665 | 652 | 135.2 |
| A | 2 | 79 | 47669 | 347.85 | 665 | 652 | 135.2 |
| B | 5 | 172 | 950631 | 7522.31 | 649 | 630 | 126.3 |
| B | 0 | 190 | 89708 | 705.34 | 649 | 630 | 126.3 |
| B | 5 | 255 | 61568 | 482.52 | 649 | 630 | 126.3 |
| C | 4 | 254 | 9739802 | 96397.67 | 430 | 431 | 101.0 |
| C | 15 | 208 | 237887 | 2350.28 | 430 | 431 | 101.0 |
| C | 15 | 214 | 180229 | 1779.59 | 430 | 431 | 101.0 |
| D | 12 | 6 | 726609 | 4558.78 | 643 | 624 | 159.2 |
| D | 2 | 250 | 128592 | 803.57 | 643 | 624 | 159.2 |
| D | 2 | 153 | 97486 | 608.24 | 643 | 624 | 159.2 |
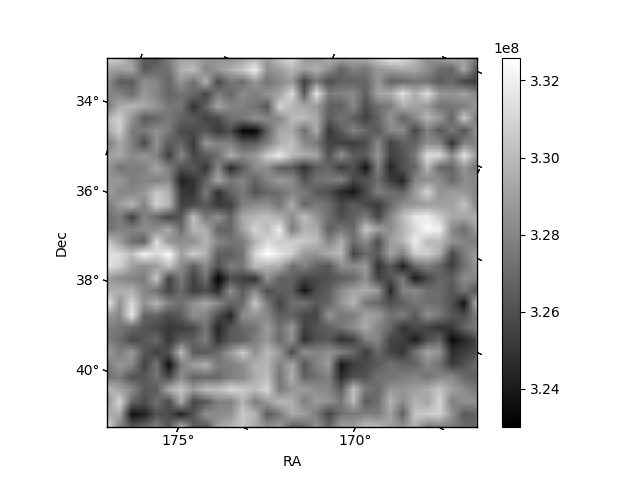
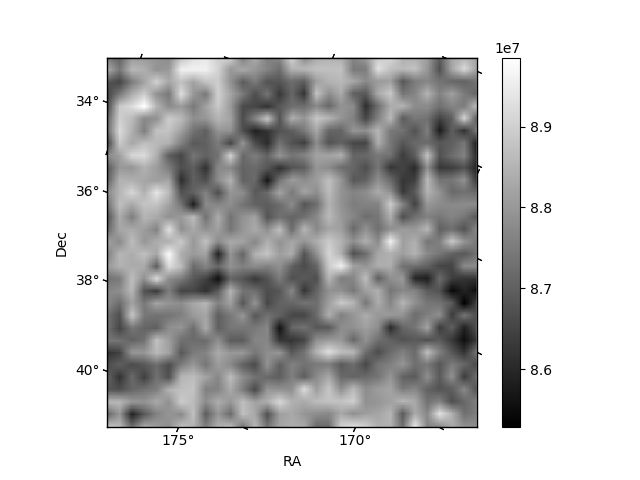
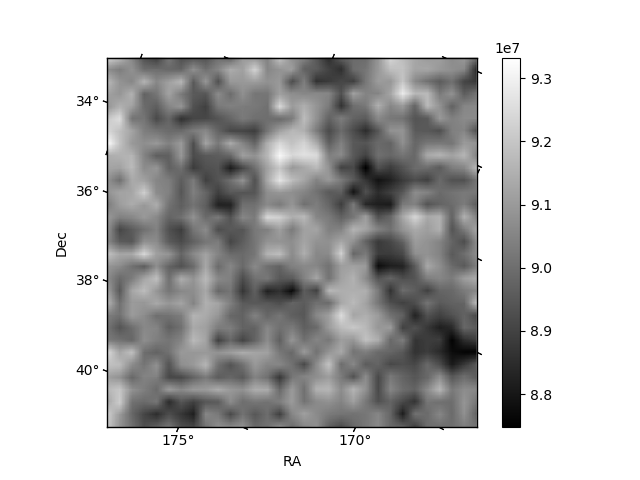
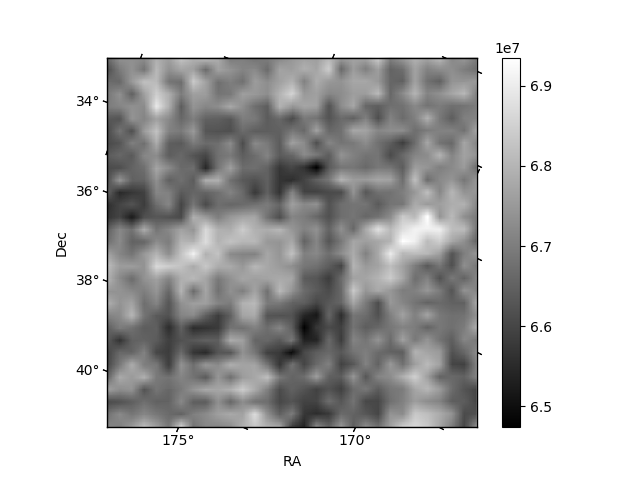
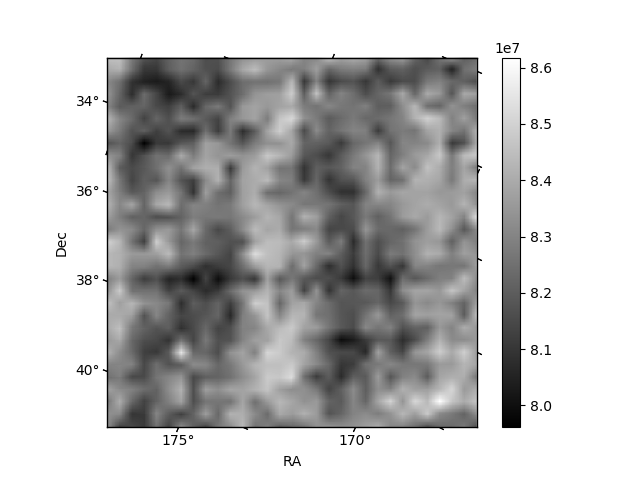
Histogram calculated using DETX and DETY for each event in the final _common_clean file
| Quadrant A | 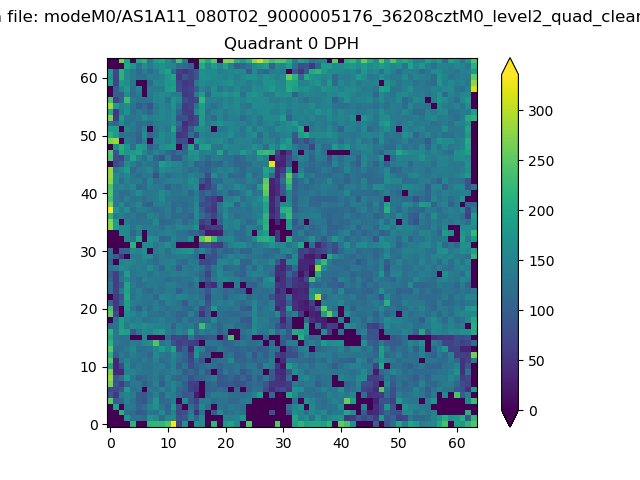 |
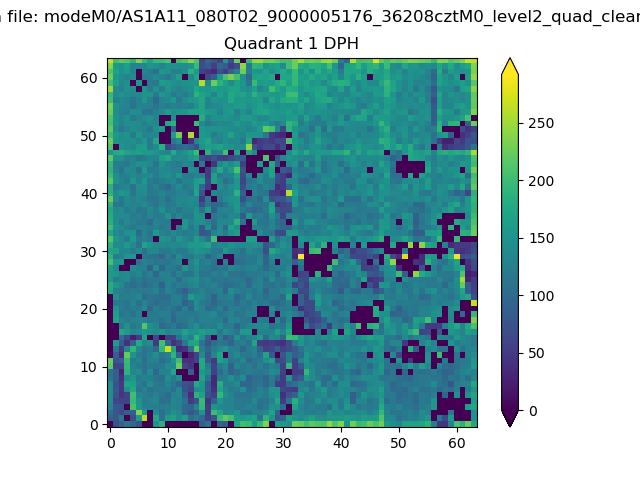 |
Quadrant B |
|---|---|---|---|
| Quadrant D | 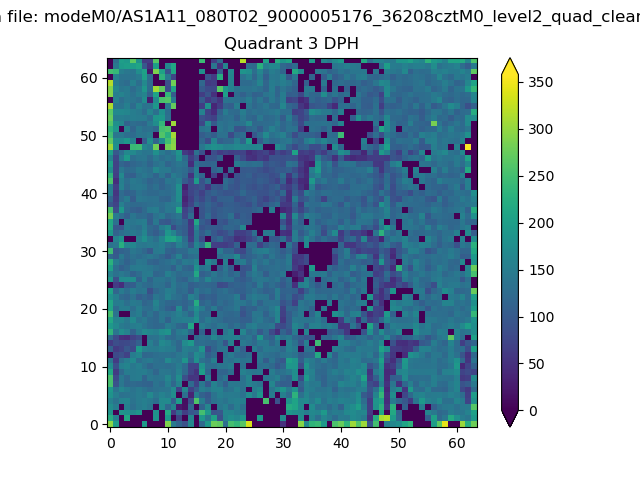 |
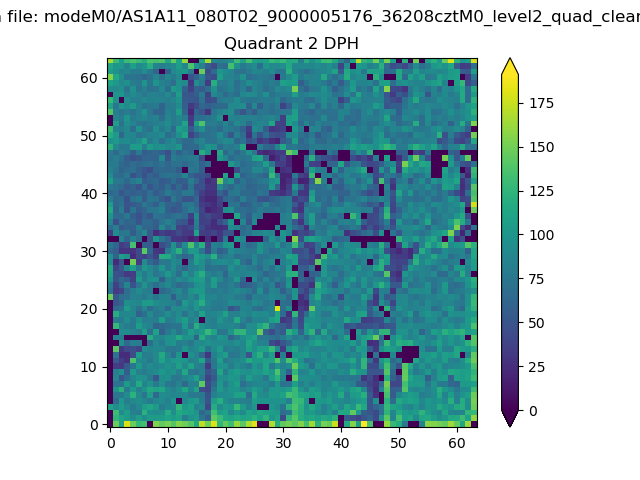 |
Quadrant C |
| Plot type | Count rate plots | Images |
|---|---|---|
| Comparison with Poisson distribution Blue bars denote a histogram of data divided into 1 sec bins. Red curve is a Poisson curve with rate = median count rate of data. |
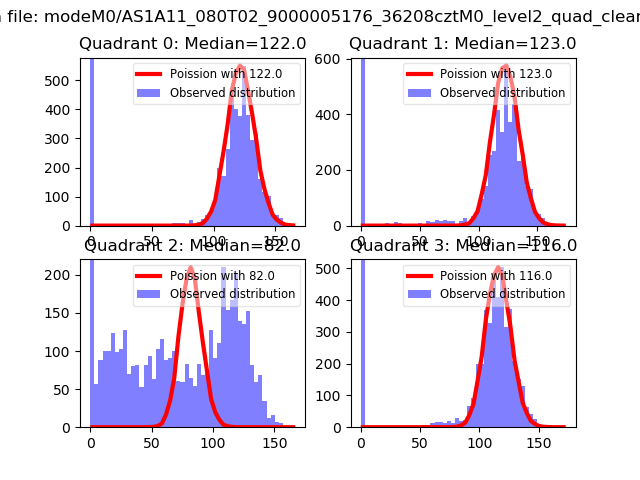 |
 |
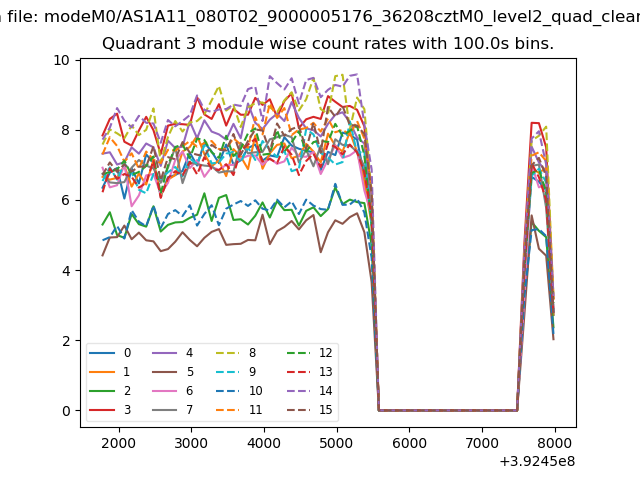
| Quadrant-wise count rates Data is divided into 100 sec bins |
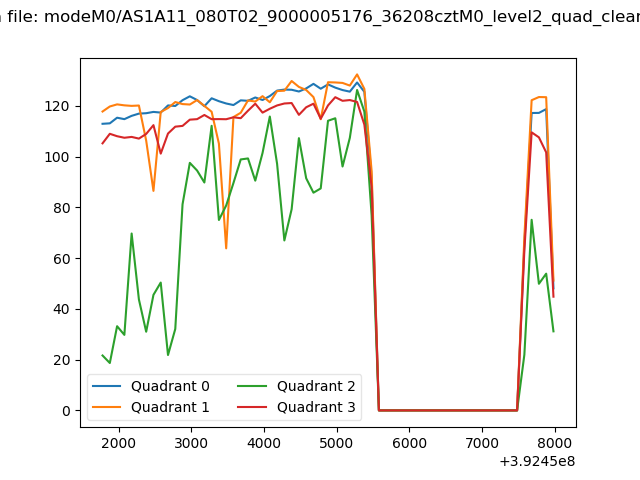 |
|
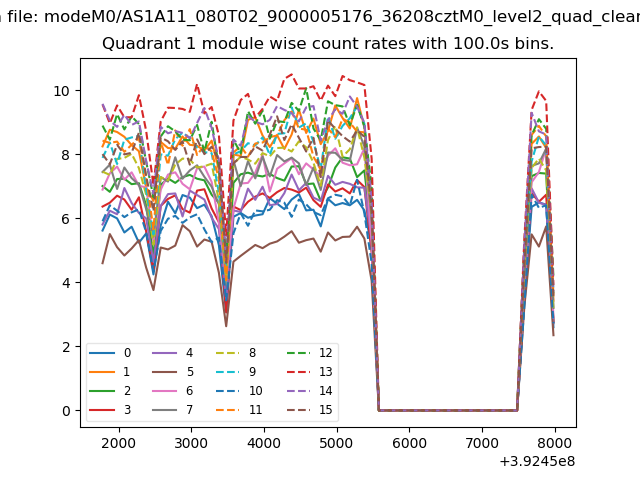
| Module-wise count rates for Quadrant A Data is divided into 100 sec bins |
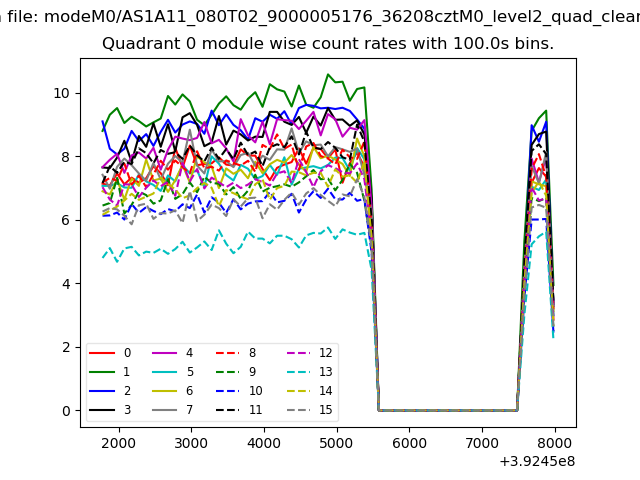 |
 |
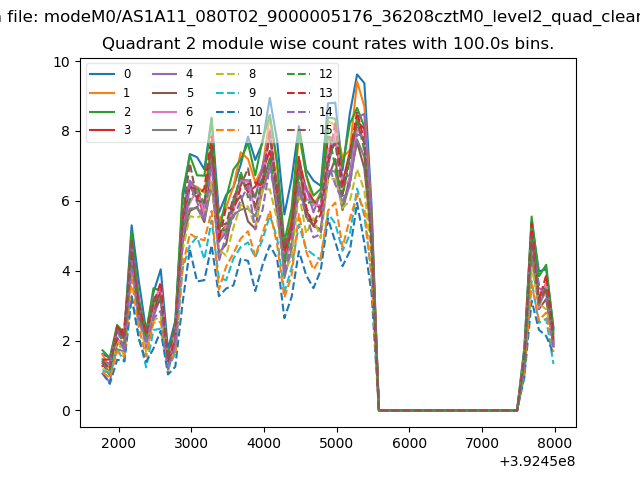
| Module-wise count rates for Quadrant B Data is divided into 100 sec bins |
 |
 |
| Module-wise count rates for Quadrant C Data is divided into 100 sec bins |
 |
 |
| Module-wise count rates for Quadrant D Data is divided into 100 sec bins |
 |
 |
| Parameter | Plot |
|---|---|
| CZT HV Monitor | 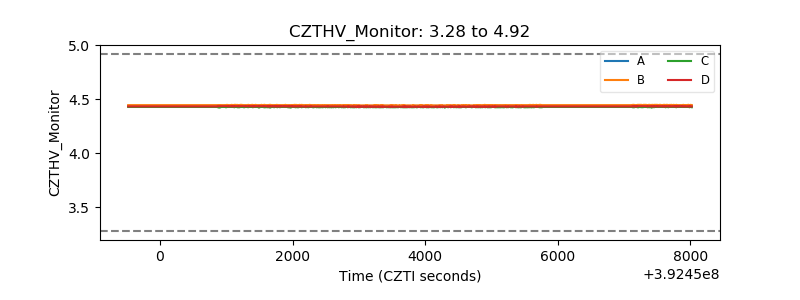 |
| D_VDD | 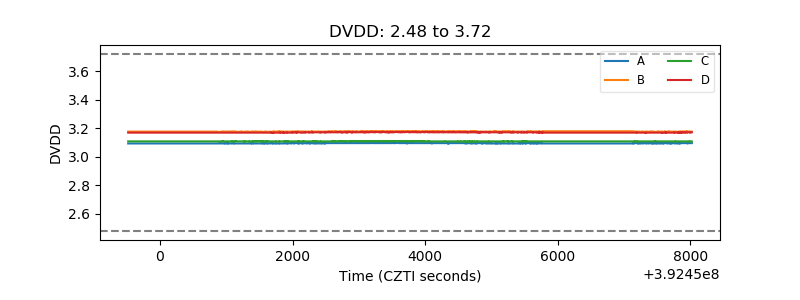 |
| Temperature 1 | 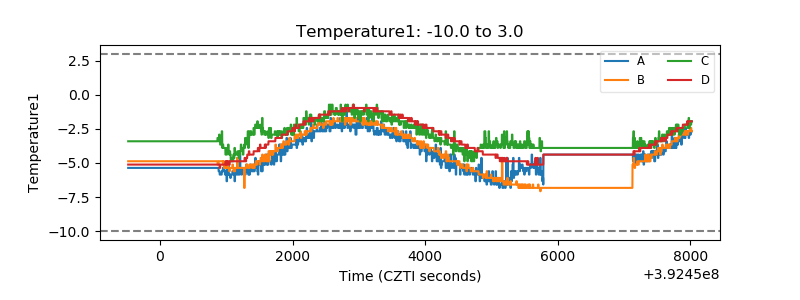 |
| Veto HV Monitor | 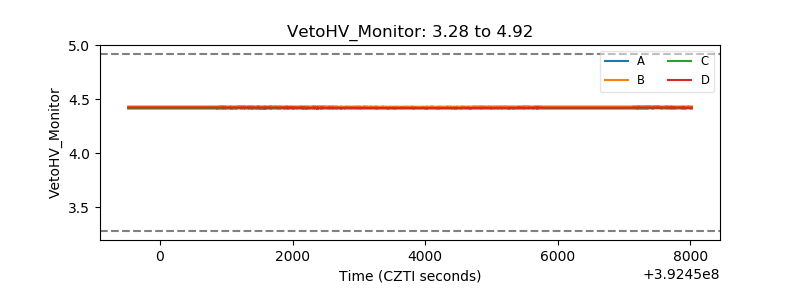 |
| Veto LLD | 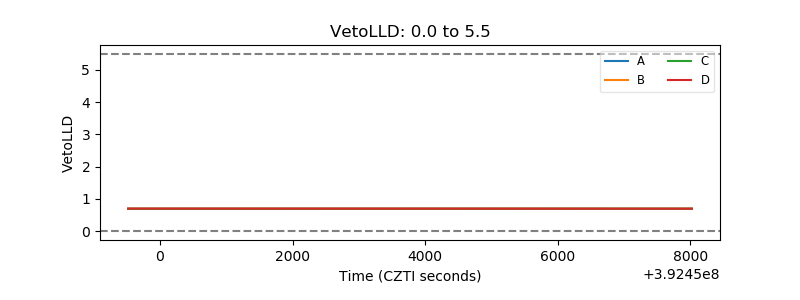 |
| Alpha Counter | 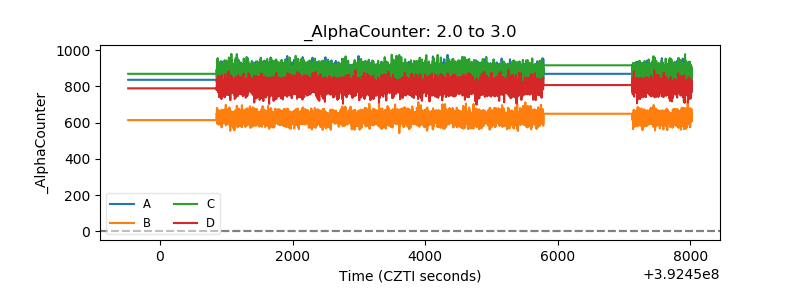 |
| _CPM_Rate | 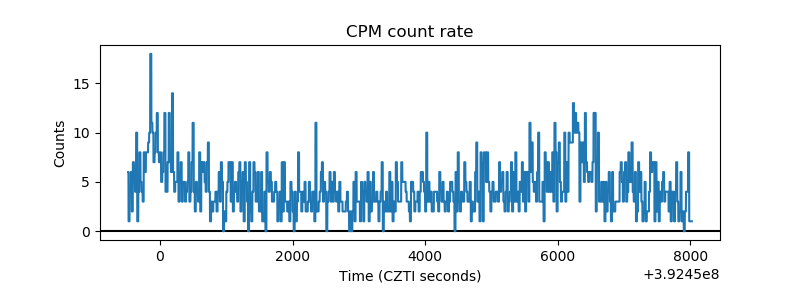 |
| CZT Counter | 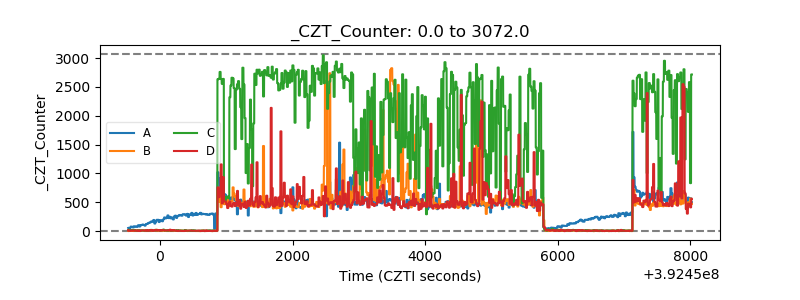 |
| +2.5 Volts monitor | 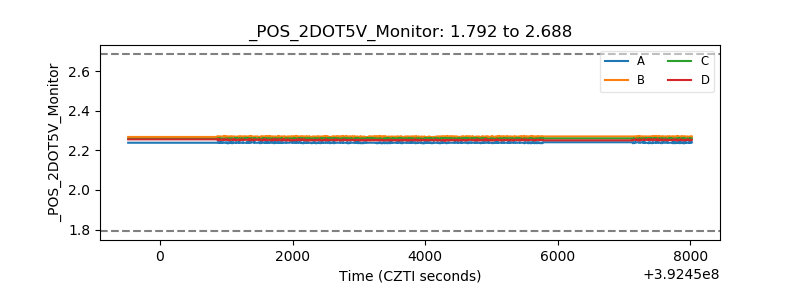 |
| +5 Volts monitor | 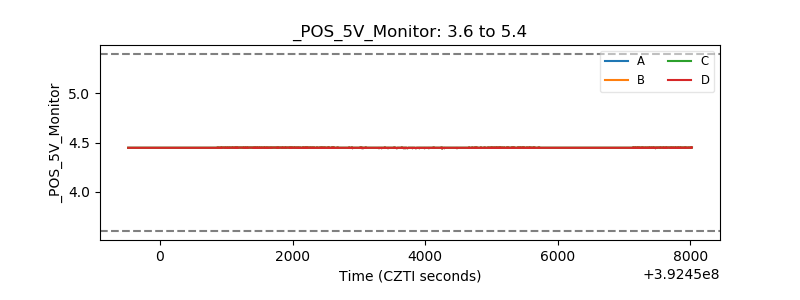 |
| _ROLL_ROT | 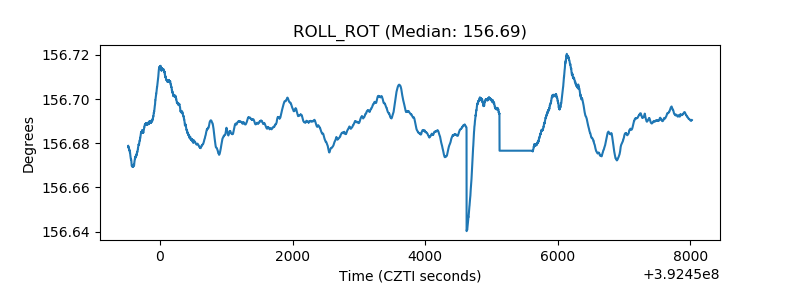 |
| _Roll_DEC | 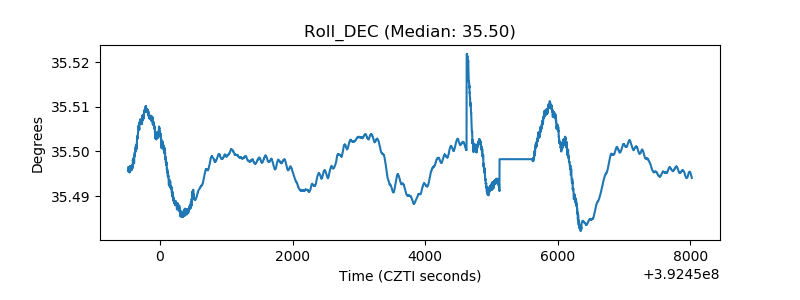 |
| _Roll_RA | 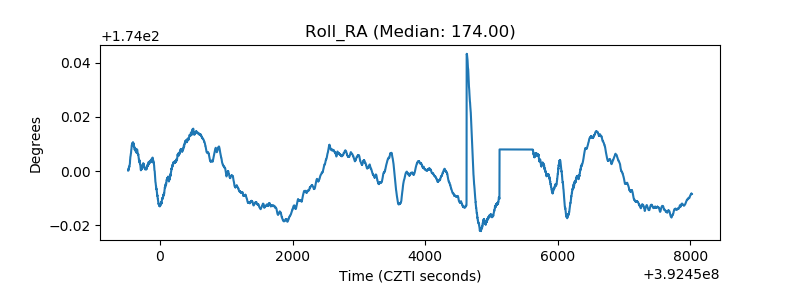 |
| Veto Counter | 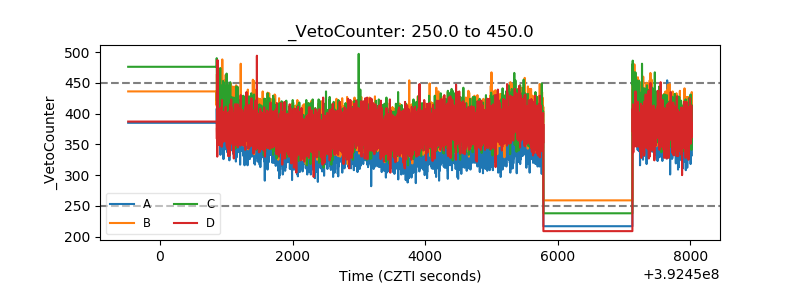 |