| Param | Original file | Final file |
|---|---|---|
| Filename | modeM0/AS1A11_080T02_9000005176_36207cztM0_level2.evt | modeM0/AS1A11_080T02_9000005176_36207cztM0_level2_quad_clean.evt |
| Size (bytes) | 713,831,040 | 62,596,800 |
| Size | 680.8 MB | 59.7 MB |
| Events in quadrant A | 2,970,266 | 424,754 |
| Events in quadrant B | 3,442,242 | 421,395 |
| Events in quadrant C | 11,313,315 | 254,243 |
| Events in quadrant D | 3,513,256 | 401,284 |
| Mode M9 | |||
|---|---|---|---|
| Quadrant | BADHDUFLAG | Total packets | Discarded packets |
| A | 0 | 29 | 0 |
| B | 0 | 29 | 0 |
| C | 0 | 29 | 0 |
| D | 0 | 30 | 0 |
| Mode M0 | |||
|---|---|---|---|
| Quadrant | BADHDUFLAG | Total packets | Discarded packets |
| A | 0 | 12096 | 3 |
| B | 0 | 13811 | 2 |
| C | 0 | 37502 | 2 |
| D | 0 | 14109 | 2 |
| Mode SS | |||
|---|---|---|---|
| Quadrant | BADHDUFLAG | Total packets | Discarded packets |
| A | 0 | 114 | 0 |
| B | 0 | 114 | 0 |
| C | 0 | 114 | 0 |
| D | 0 | 114 | 0 |
| Quadrant | Total seconds | Saturated seconds | Saturation percentage |
|---|---|---|---|
| A | 5611 | 15 | 0.267332% |
| B | 5611 | 183 | 3.261451% |
| C | 5611 | 3338 | 59.490287% |
| D | 5611 | 172 | 3.065407% |
Noise dominated data is calculated using 1-second bins in cleaned event files. If a bin has >2000 counts, and if more than 50% of those come from <1% of pixels, then it is considered to be noise-dominated and hence unusable.
| Quadrant | # 1 sec bins | Bins with >0 counts | Bins with >2000 counts | High rate bins dominated by noise | Noise dominated (total time) | Noise dominated (detector-on time) | Marked lightcurve |
|---|---|---|---|---|---|---|---|
| A | 7104 | 5612 | 3 | 3 | 0.04% | 0.05% | 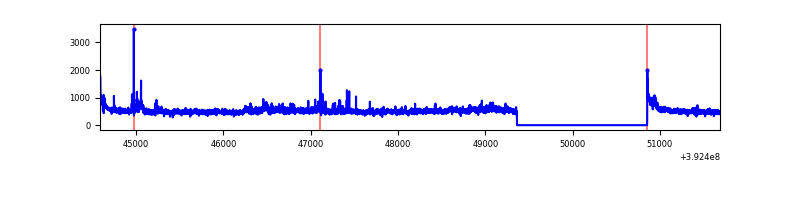 |
| B | 7104 | 5612 | 149 | 149 | 2.10% | 2.66% | 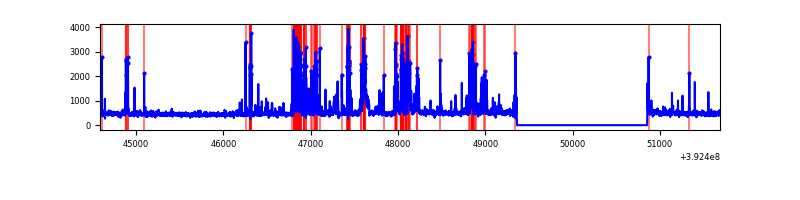 |
| C | 7103 | 5610 | 3029 | 3029 | 42.64% | 53.99% | 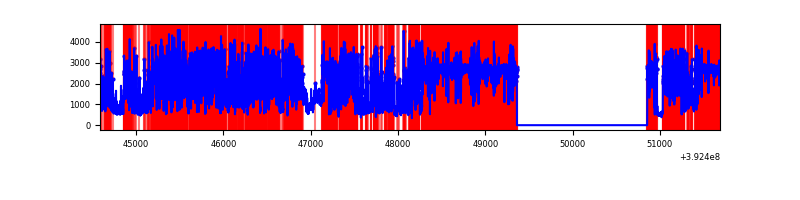 |
| D | 7104 | 5612 | 149 | 149 | 2.10% | 2.66% | 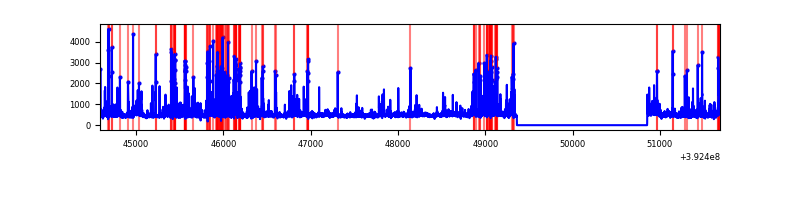 |
Top three noisy pixels from each quadrant. If the there are fewer than three noisy pixels in the level2.evt file, extra rows are filled as -1
| Pixel properties | Quadrant properties | ||||||
|---|---|---|---|---|---|---|---|
| Quadrant | DetID | PixID | Counts | Sigma | Mean | Median | Sigma |
| A | 15 | 223 | 198344 | 1502.22 | 641 | 626 | 131.6 |
| A | 10 | 83 | 182273 | 1380.12 | 641 | 626 | 131.6 |
| A | 8 | 144 | 68308 | 514.24 | 641 | 626 | 131.6 |
| B | 5 | 172 | 799312 | 6509.19 | 631 | 613 | 122.7 |
| B | 0 | 190 | 60194 | 485.57 | 631 | 613 | 122.7 |
| B | 0 | 229 | 26487 | 210.87 | 631 | 613 | 122.7 |
| C | 4 | 254 | 8716546 | 87723.1 | 424 | 427 | 99.4 |
| C | 15 | 208 | 621941 | 6255.21 | 424 | 427 | 99.4 |
| C | 15 | 214 | 181011 | 1817.48 | 424 | 427 | 99.4 |
| D | 12 | 6 | 600660 | 3883.95 | 622 | 602 | 154.5 |
| D | 13 | 171 | 139611 | 899.75 | 622 | 602 | 154.5 |
| D | 2 | 250 | 135731 | 874.64 | 622 | 602 | 154.5 |
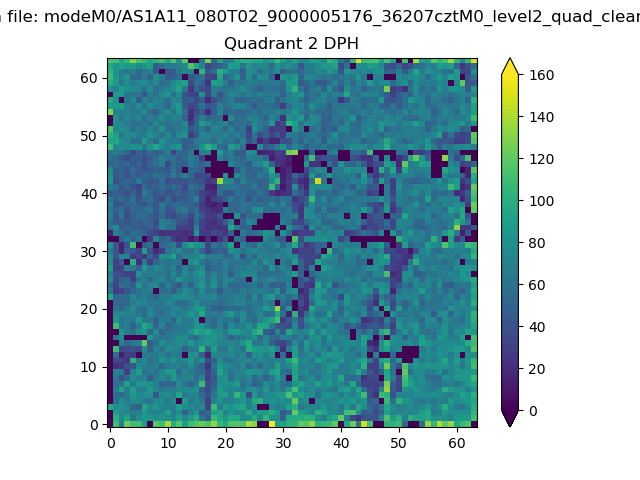
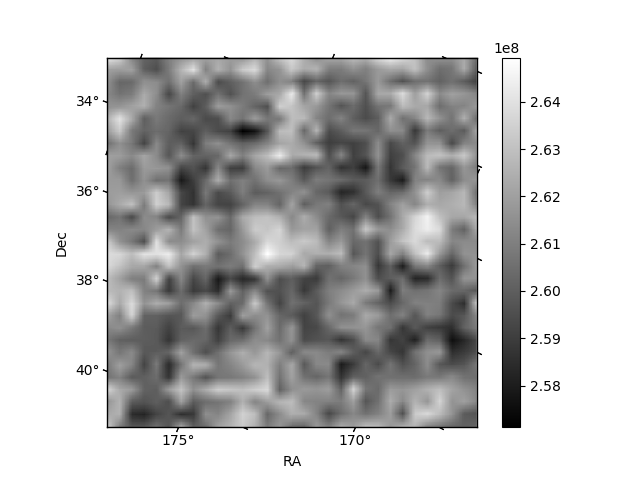
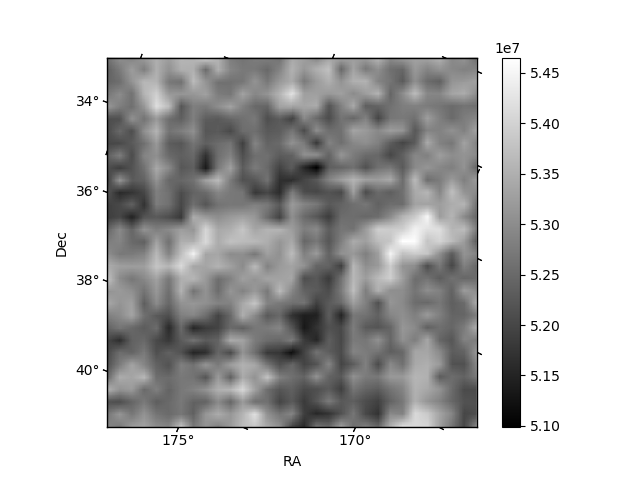
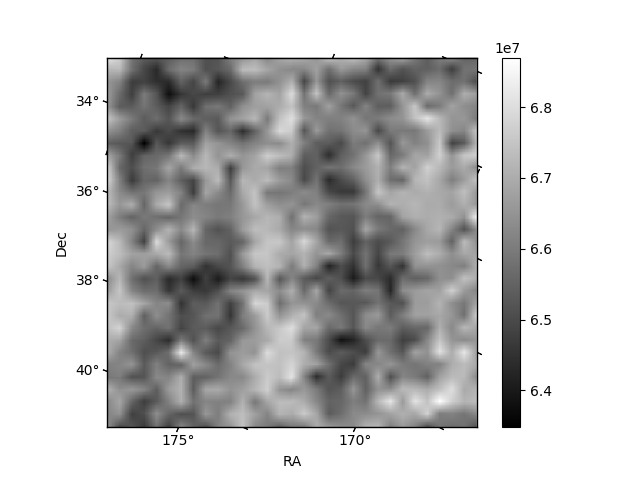
Histogram calculated using DETX and DETY for each event in the final _common_clean file
| Quadrant A | 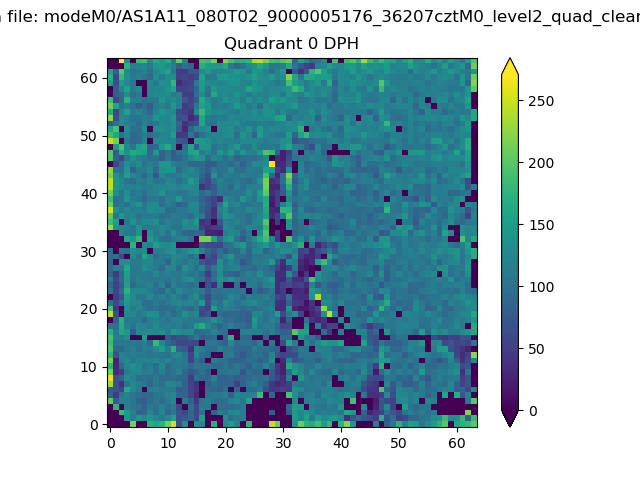 |
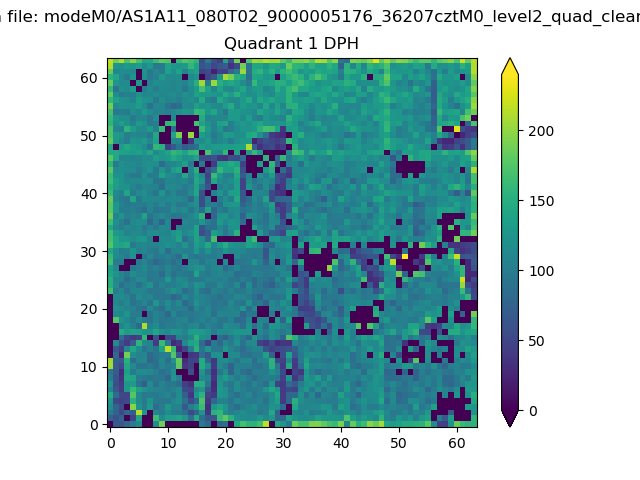 |
Quadrant B |
|---|---|---|---|
| Quadrant D | 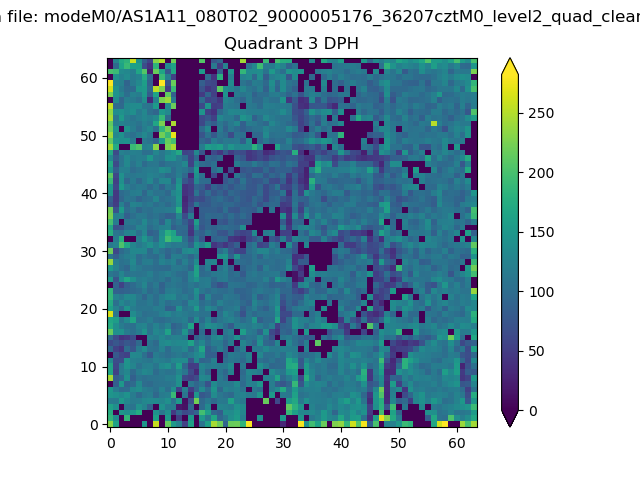 |
 |
Quadrant C |
| Plot type | Count rate plots | Images |
|---|---|---|
| Comparison with Poisson distribution Blue bars denote a histogram of data divided into 1 sec bins. Red curve is a Poisson curve with rate = median count rate of data. |
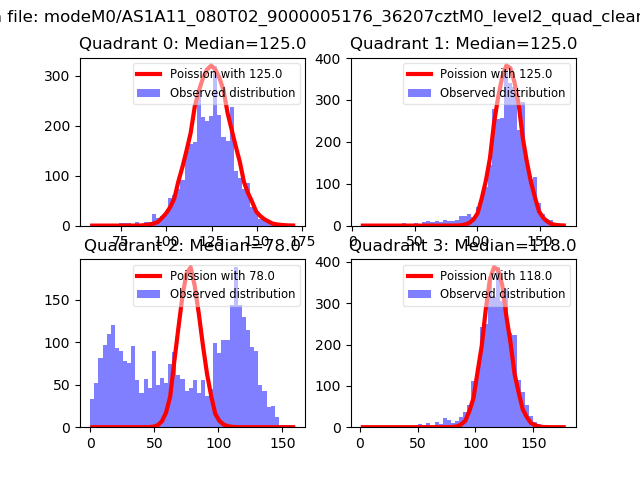 |
 |
| Quadrant-wise count rates Data is divided into 100 sec bins |
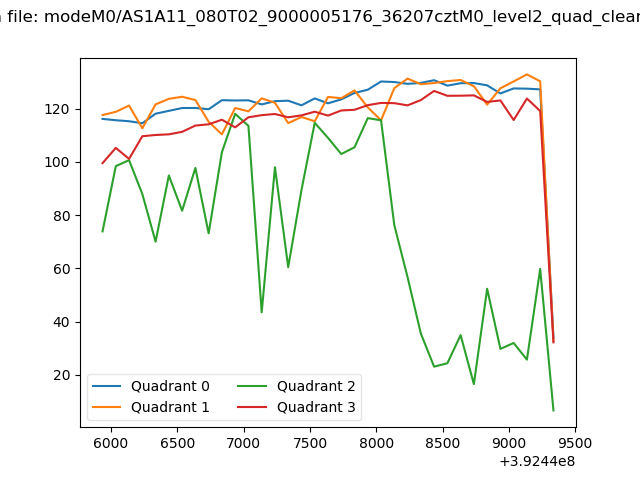 |
|
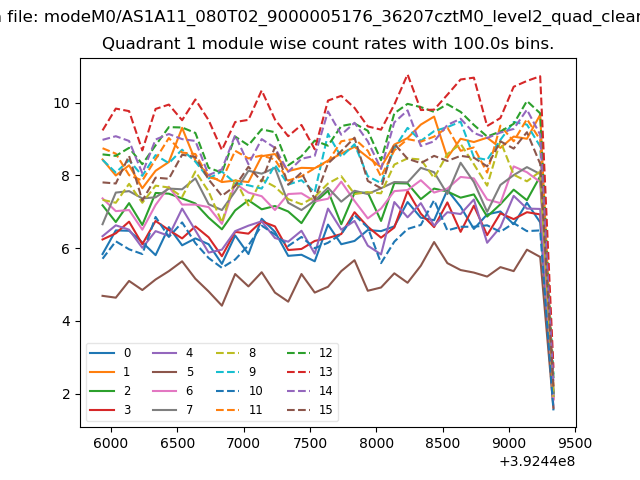
| Module-wise count rates for Quadrant A Data is divided into 100 sec bins |
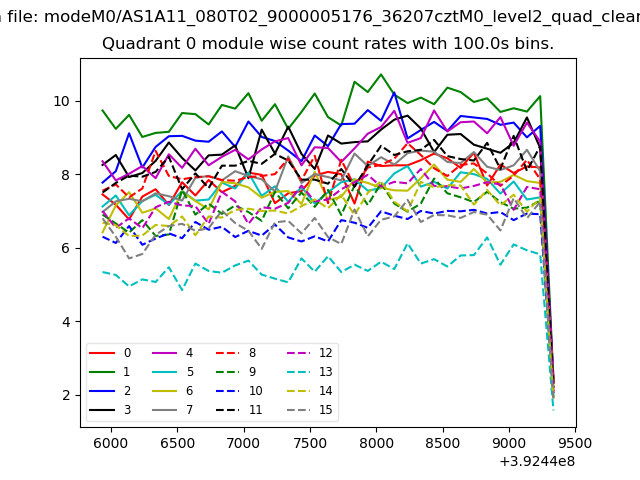 |
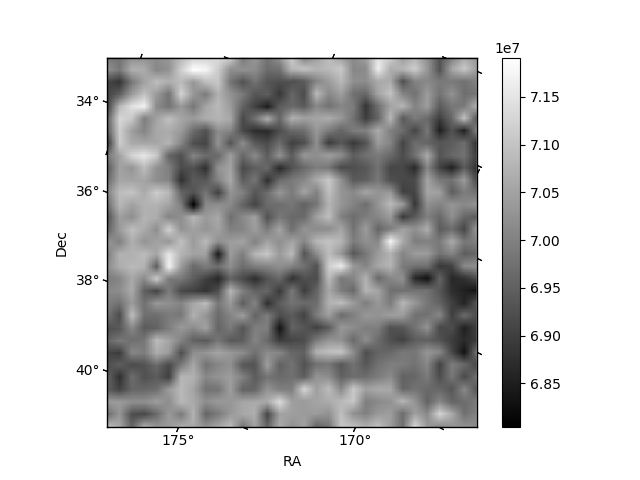 |
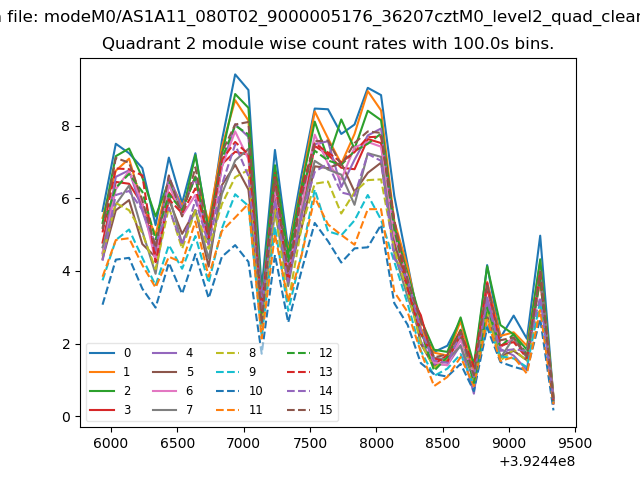
| Module-wise count rates for Quadrant B Data is divided into 100 sec bins |
 |
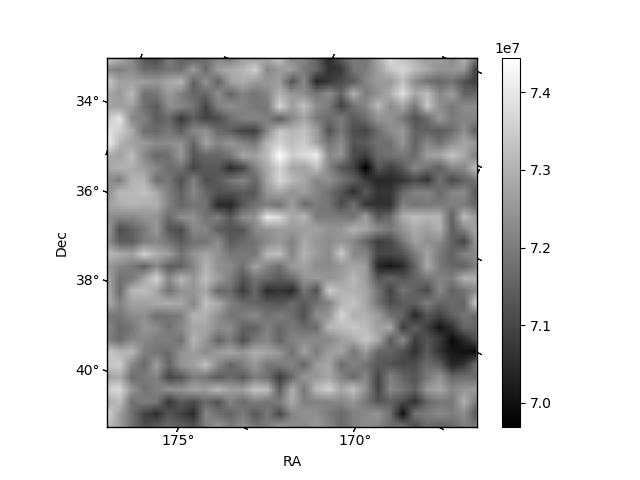 |
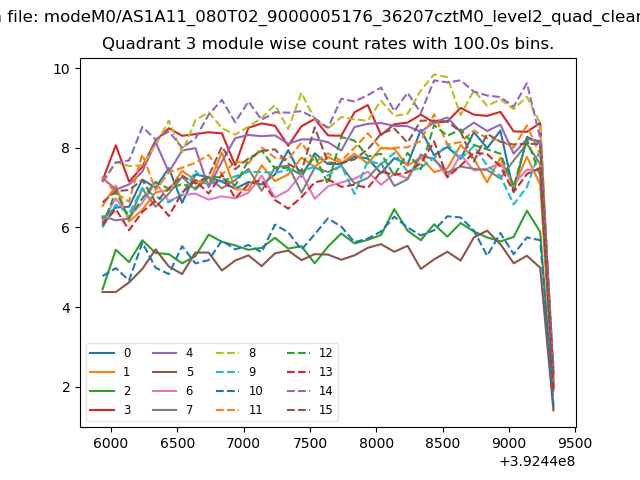
| Module-wise count rates for Quadrant C Data is divided into 100 sec bins |
 |
 |
| Module-wise count rates for Quadrant D Data is divided into 100 sec bins |
 |
 |
| Parameter | Plot |
|---|---|
| CZT HV Monitor | 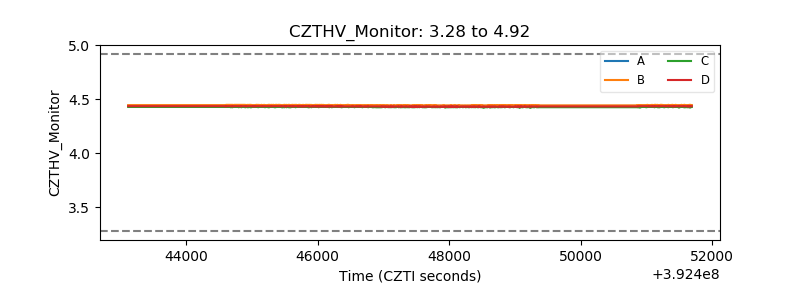 |
| D_VDD | 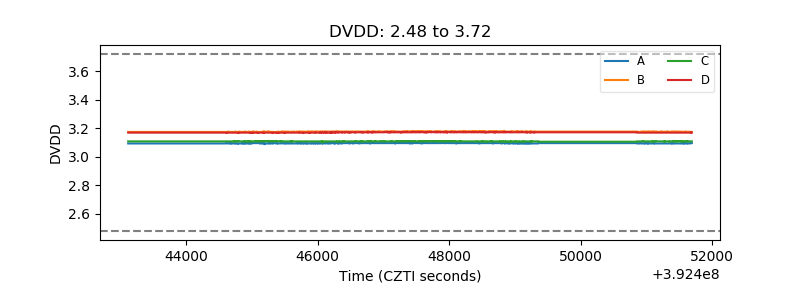 |
| Temperature 1 | 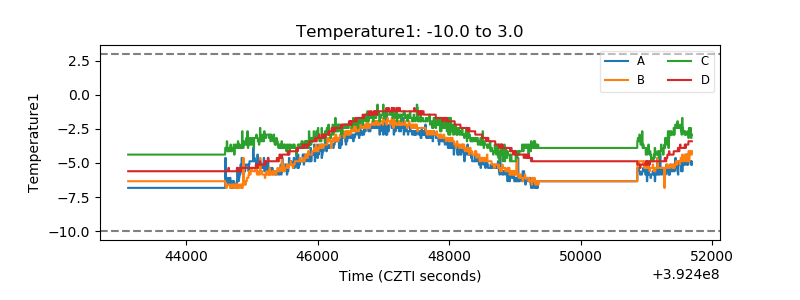 |
| Veto HV Monitor | 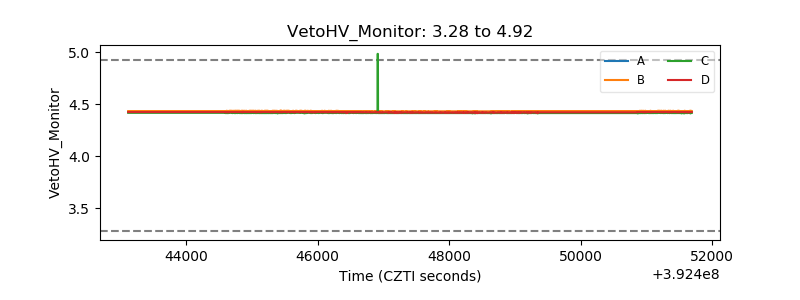 |
| Veto LLD | 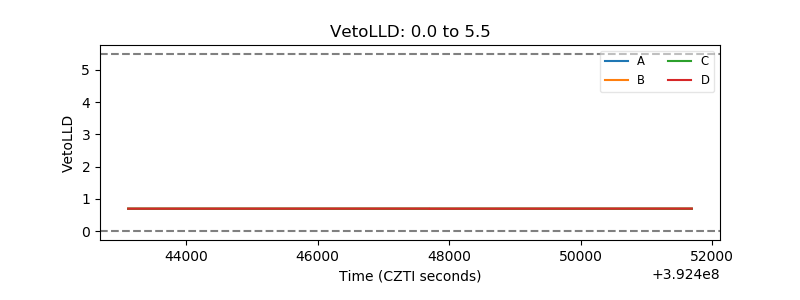 |
| Alpha Counter | 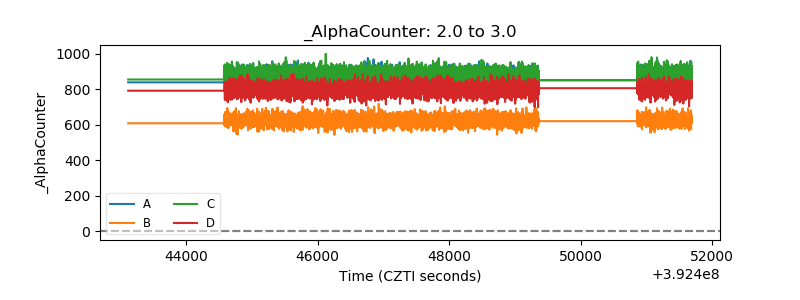 |
| _CPM_Rate | 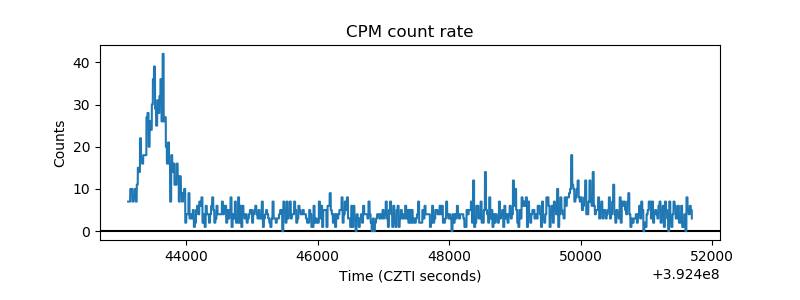 |
| CZT Counter | 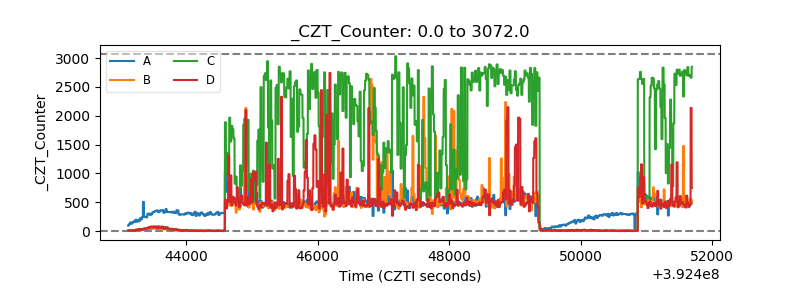 |
| +2.5 Volts monitor | 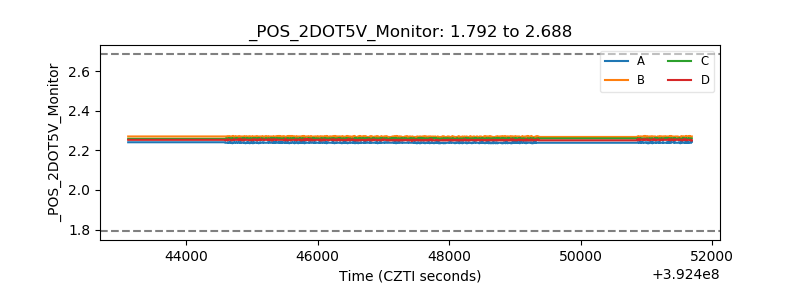 |
| +5 Volts monitor | 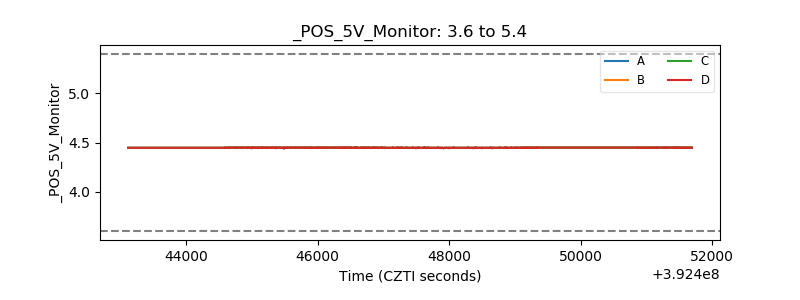 |
| _ROLL_ROT | 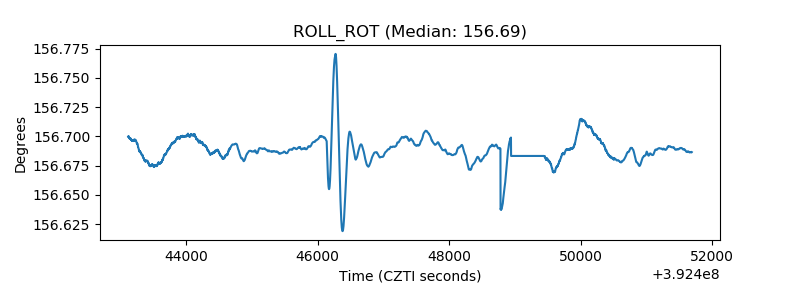 |
| _Roll_DEC | 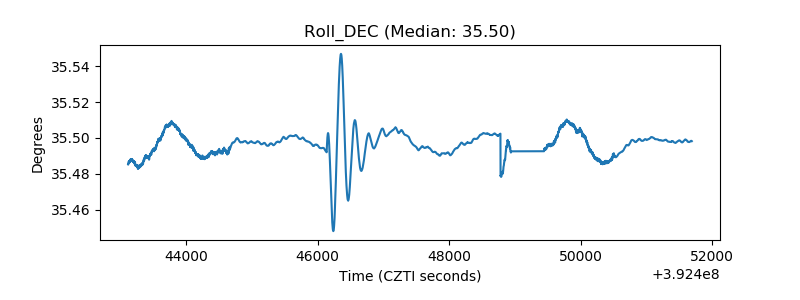 |
| _Roll_RA | 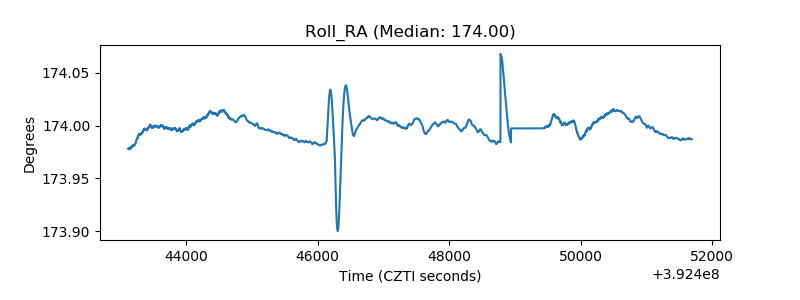 |
| Veto Counter | 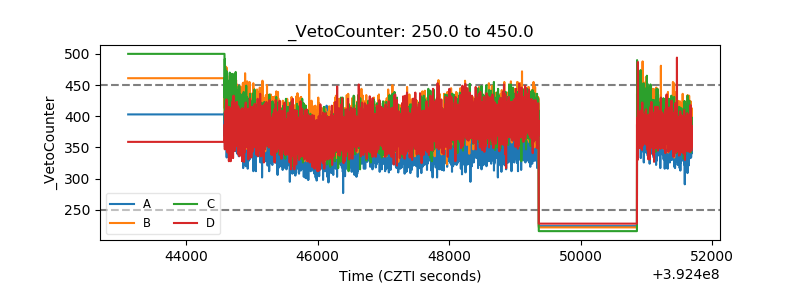 |