| Param | Original file | Final file |
|---|---|---|
| Filename | modeM0/AS1A11_080T02_9000005176_36205cztM0_level2.evt | modeM0/AS1A11_080T02_9000005176_36205cztM0_level2_quad_clean.evt |
| Size (bytes) | 483,102,720 | 46,941,120 |
| Size | 460.7 MB | 44.8 MB |
| Events in quadrant A | 2,803,943 | 280,221 |
| Events in quadrant B | 3,343,026 | 275,878 |
| Events in quadrant C | 3,484,347 | 275,693 |
| Events in quadrant D | 4,653,866 | 231,490 |
| Mode M9 | |||
|---|---|---|---|
| Quadrant | BADHDUFLAG | Total packets | Discarded packets |
| A | 0 | 34 | 0 |
| B | 0 | 34 | 0 |
| C | 0 | 34 | 0 |
| D | 0 | 35 | 0 |
| Mode M0 | |||
|---|---|---|---|
| Quadrant | BADHDUFLAG | Total packets | Discarded packets |
| A | 0 | 11453 | 3 |
| B | 0 | 13219 | 2 |
| C | 0 | 13718 | 2 |
| D | 0 | 17297 | 2 |
| Mode SS | |||
|---|---|---|---|
| Quadrant | BADHDUFLAG | Total packets | Discarded packets |
| A | 0 | 104 | 0 |
| B | 0 | 104 | 0 |
| C | 0 | 104 | 0 |
| D | 0 | 104 | 0 |
| Quadrant | Total seconds | Saturated seconds | Saturation percentage |
|---|---|---|---|
| A | 5096 | 10 | 0.196232% |
| B | 5096 | 226 | 4.434851% |
| C | 5096 | 71 | 1.393250% |
| D | 5096 | 751 | 14.737049% |
Noise dominated data is calculated using 1-second bins in cleaned event files. If a bin has >2000 counts, and if more than 50% of those come from <1% of pixels, then it is considered to be noise-dominated and hence unusable.
| Quadrant | # 1 sec bins | Bins with >0 counts | Bins with >2000 counts | High rate bins dominated by noise | Noise dominated (total time) | Noise dominated (detector-on time) | Marked lightcurve |
|---|---|---|---|---|---|---|---|
| A | 7160 | 5097 | 3 | 3 | 0.04% | 0.06% |  |
| B | 7160 | 5097 | 141 | 141 | 1.97% | 2.77% |  |
| C | 7160 | 5097 | 54 | 54 | 0.75% | 1.06% |  |
| D | 7160 | 5097 | 721 | 721 | 10.07% | 14.15% |  |
Top three noisy pixels from each quadrant. If the there are fewer than three noisy pixels in the level2.evt file, extra rows are filled as -1
| Pixel properties | Quadrant properties | ||||||
|---|---|---|---|---|---|---|---|
| Quadrant | DetID | PixID | Counts | Sigma | Mean | Median | Sigma |
| A | 10 | 83 | 175850 | 1462.37 | 596 | 584 | 119.9 |
| A | 15 | 223 | 146748 | 1219.55 | 596 | 584 | 119.9 |
| A | 8 | 144 | 127105 | 1055.65 | 596 | 584 | 119.9 |
| B | 5 | 172 | 743781 | 6619.76 | 589 | 573 | 112.3 |
| B | 0 | 190 | 176923 | 1570.75 | 589 | 573 | 112.3 |
| B | 15 | 32 | 27715 | 241.75 | 589 | 573 | 112.3 |
| C | 4 | 254 | 622523 | 4659.38 | 579 | 585 | 133.5 |
| C | 0 | 10 | 239539 | 1790.17 | 579 | 585 | 133.5 |
| C | 15 | 214 | 233450 | 1744.56 | 579 | 585 | 133.5 |
| D | 10 | 203 | 1394378 | 10333.09 | 548 | 531 | 134.9 |
| D | 12 | 6 | 648604 | 4804.4 | 548 | 531 | 134.9 |
| D | 13 | 171 | 116815 | 862.06 | 548 | 531 | 134.9 |
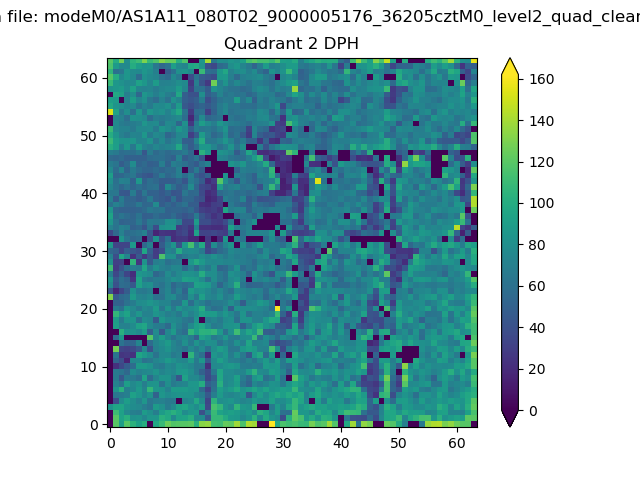
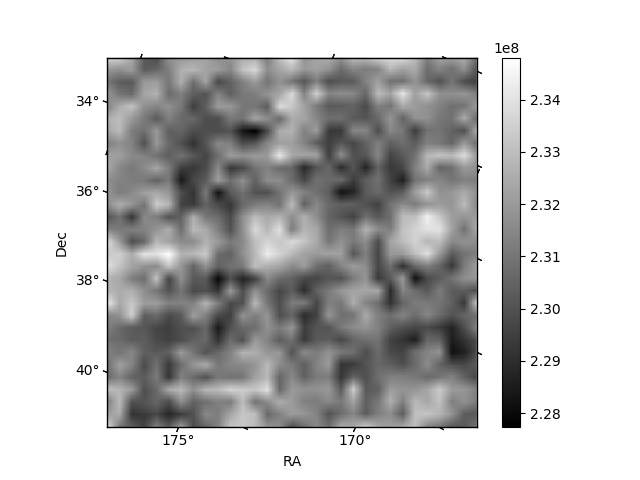
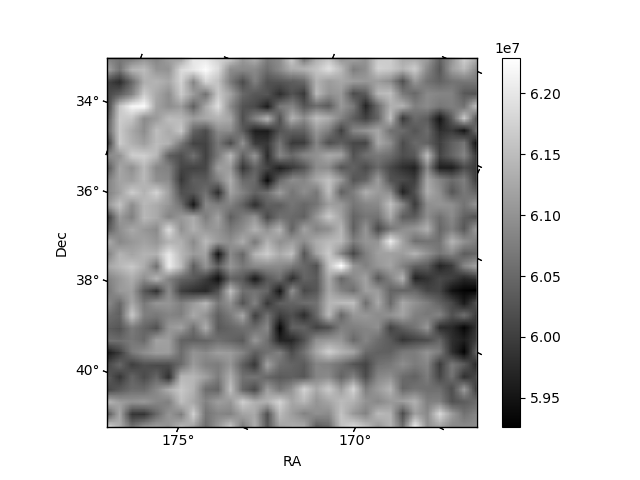
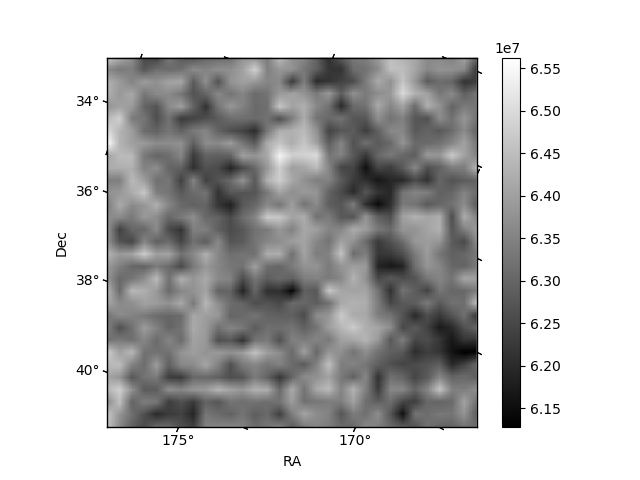
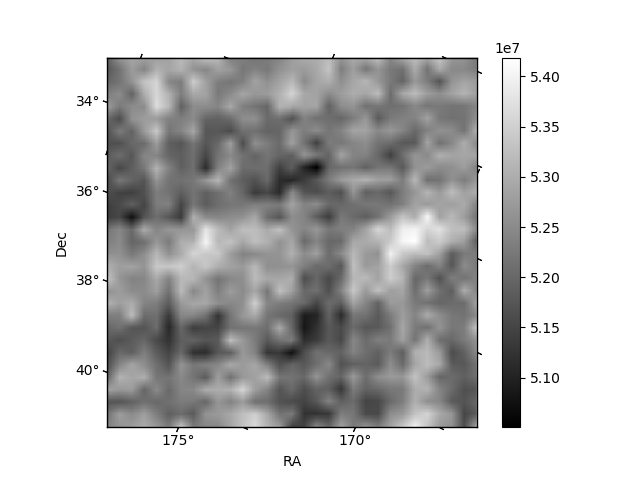
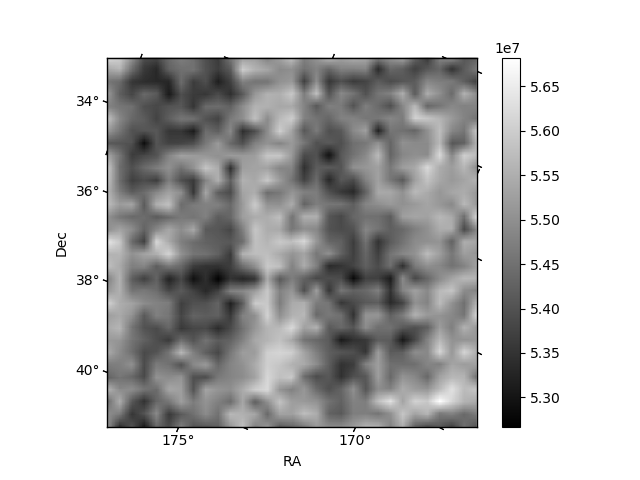
Histogram calculated using DETX and DETY for each event in the final _common_clean file
| Quadrant A | 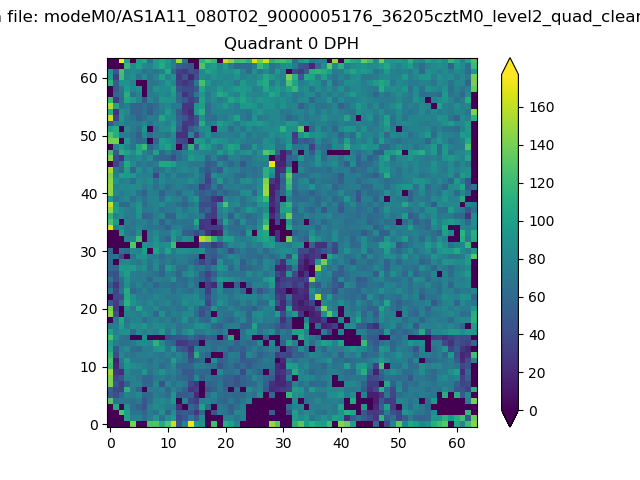 |
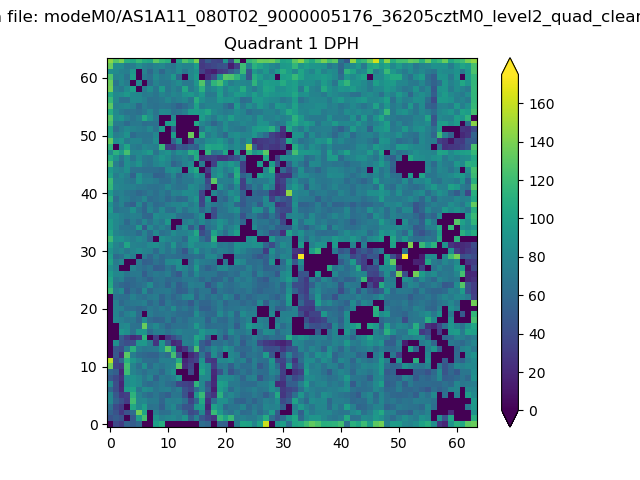 |
Quadrant B |
|---|---|---|---|
| Quadrant D | 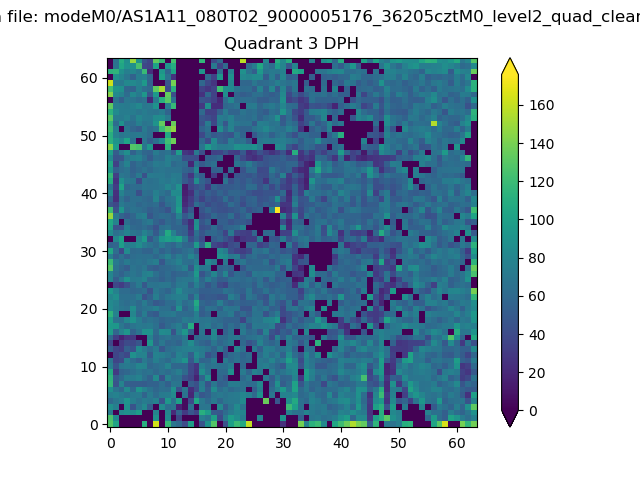 |
 |
Quadrant C |
| Plot type | Count rate plots | Images |
|---|---|---|
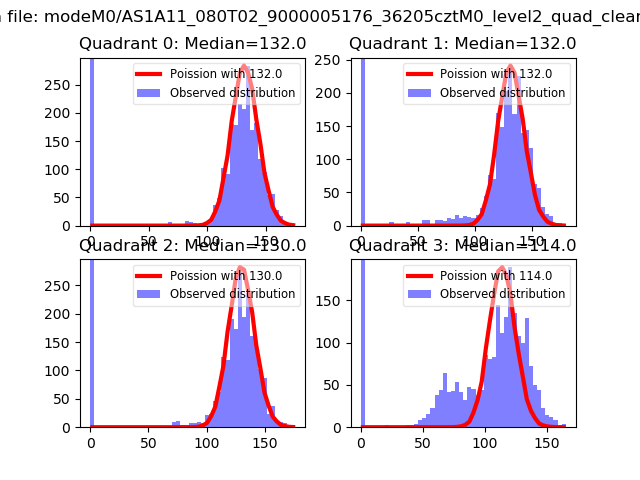
| Comparison with Poisson distribution Blue bars denote a histogram of data divided into 1 sec bins. Red curve is a Poisson curve with rate = median count rate of data. |
 |
 |
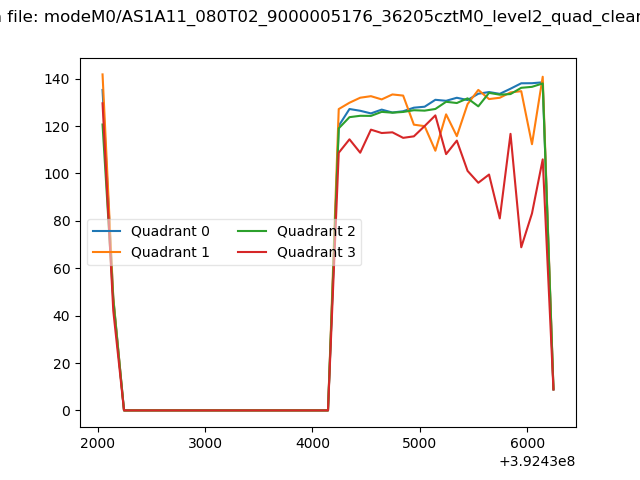
| Quadrant-wise count rates Data is divided into 100 sec bins |
 |
|
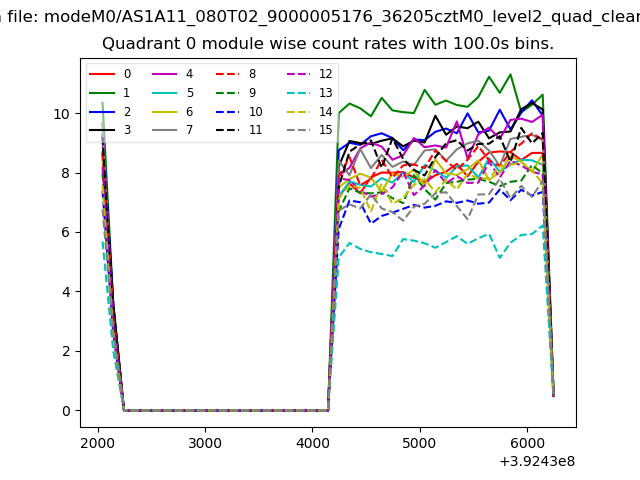
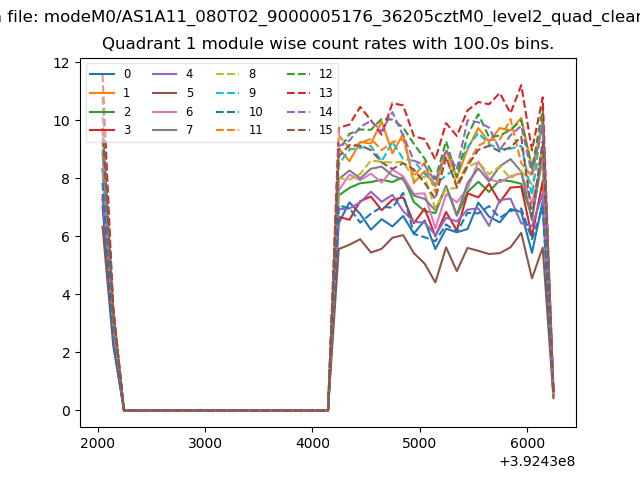
| Module-wise count rates for Quadrant A Data is divided into 100 sec bins |
 |
 |
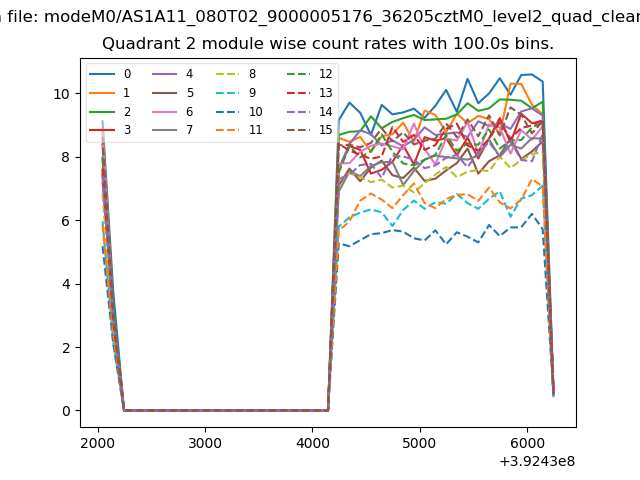
| Module-wise count rates for Quadrant B Data is divided into 100 sec bins |
 |
 |
| Module-wise count rates for Quadrant C Data is divided into 100 sec bins |
 |
 |
| Module-wise count rates for Quadrant D Data is divided into 100 sec bins |
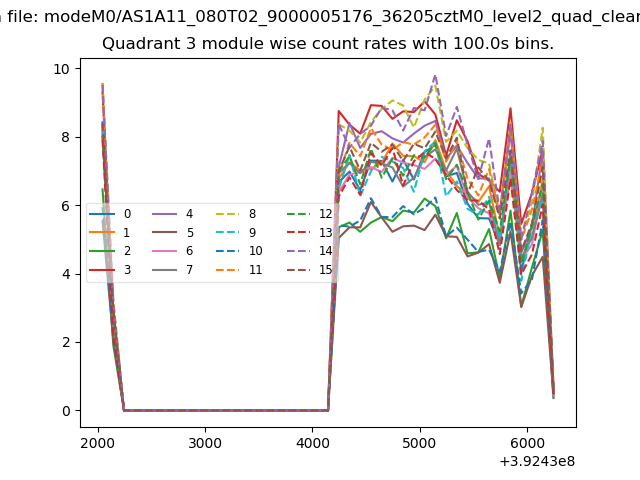 |
 |
| Parameter | Plot |
|---|---|
| CZT HV Monitor | 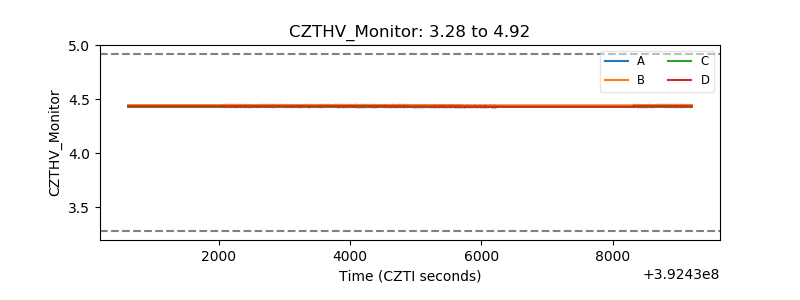 |
| D_VDD | 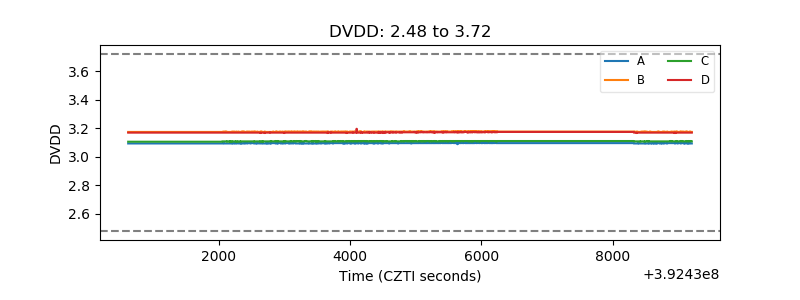 |
| Temperature 1 | 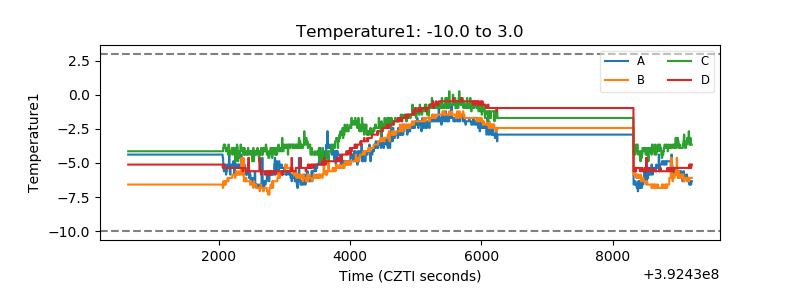 |
| Veto HV Monitor | 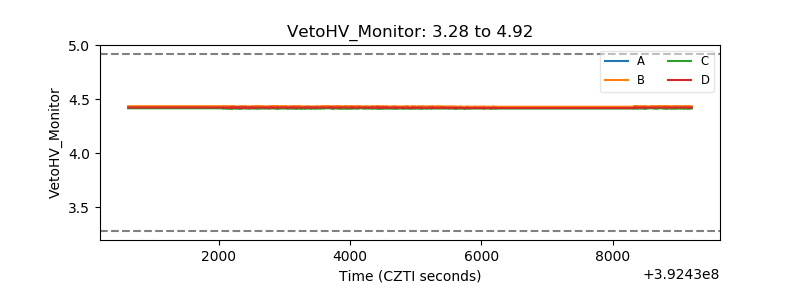 |
| Veto LLD | 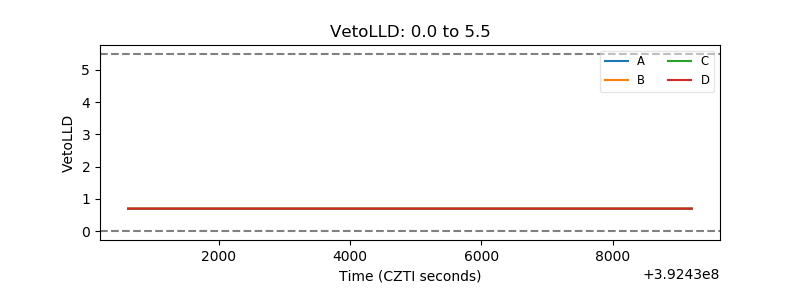 |
| Alpha Counter | 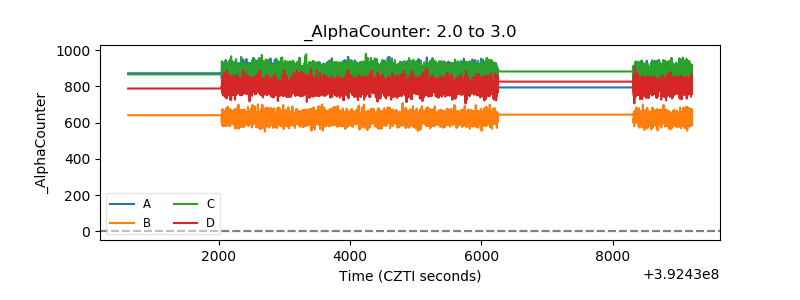 |
| _CPM_Rate | 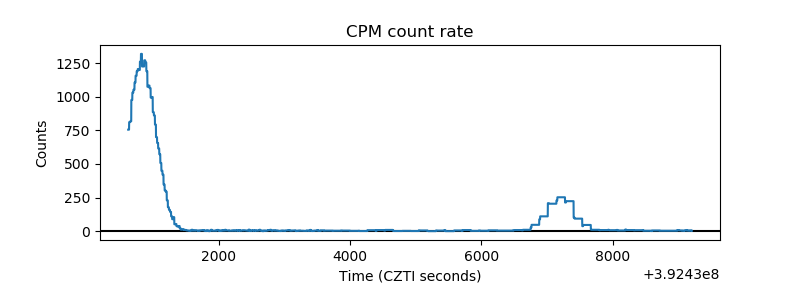 |
| CZT Counter | 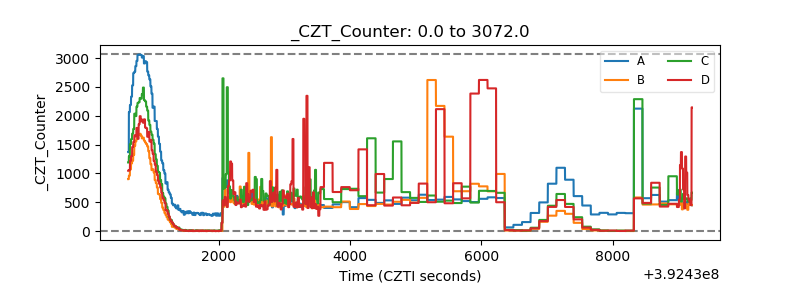 |
| +2.5 Volts monitor | 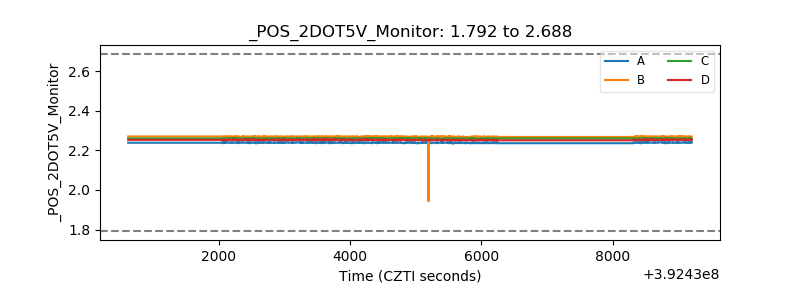 |
| +5 Volts monitor | 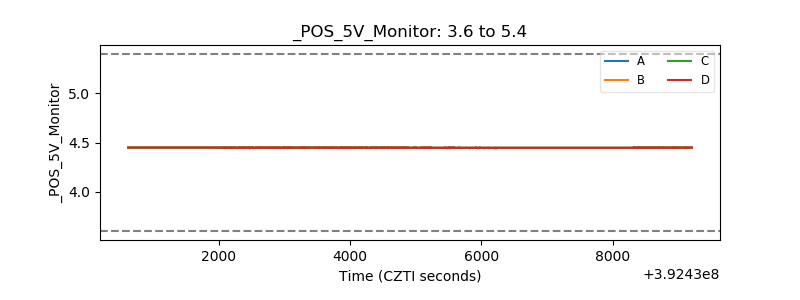 |
| _ROLL_ROT | 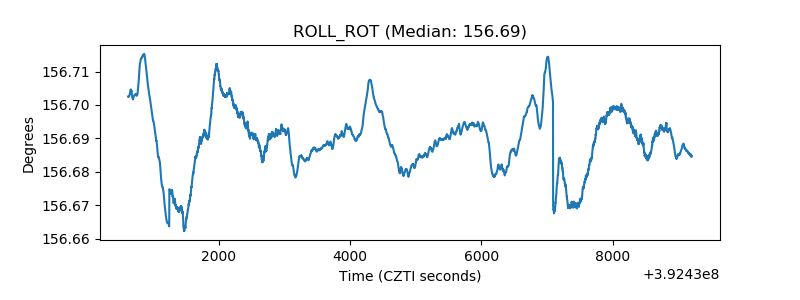 |
| _Roll_DEC | 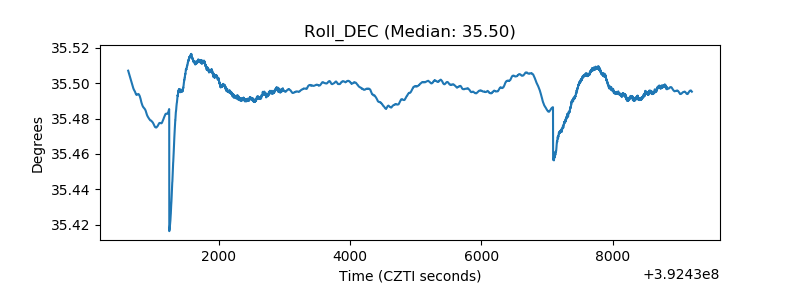 |
| _Roll_RA | 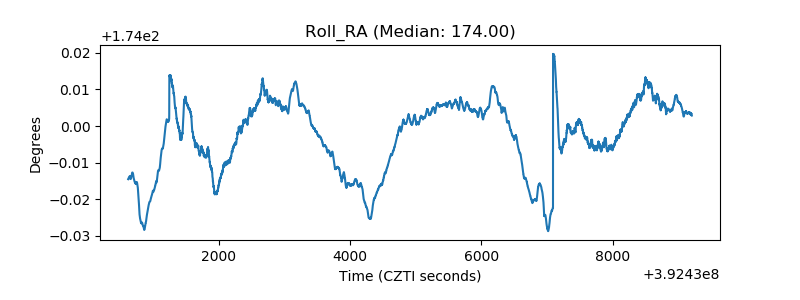 |
| Veto Counter | 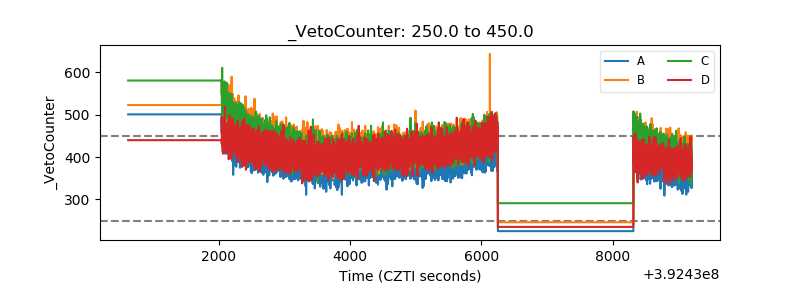 |