| Param | Original file | Final file |
|---|---|---|
| Filename | modeM0/AS1T05_009T04_9000005174_36204cztM0_level2.evt | modeM0/AS1T05_009T04_9000005174_36204cztM0_level2_quad_clean.evt |
| Size (bytes) | 222,387,840 | 56,957,760 |
| Size | 212.1 MB | 54.3 MB |
| Events in quadrant A | 1,389,029 | 377,415 |
| Events in quadrant B | 1,459,858 | 389,362 |
| Events in quadrant C | 1,702,165 | 391,342 |
| Events in quadrant D | 1,986,038 | 360,486 |
| Mode SS | |||
|---|---|---|---|
| Quadrant | BADHDUFLAG | Total packets | Discarded packets |
| A | 0 | 58 | 0 |
| B | 0 | 58 | 0 |
| C | 0 | 58 | 0 |
| D | 0 | 58 | 0 |
| Mode M9 | |||
|---|---|---|---|
| Quadrant | BADHDUFLAG | Total packets | Discarded packets |
| A | 0 | 14 | 0 |
| B | 0 | 14 | 0 |
| C | 0 | 14 | 0 |
| D | 0 | 15 | 0 |
| Mode M0 | |||
|---|---|---|---|
| Quadrant | BADHDUFLAG | Total packets | Discarded packets |
| A | 0 | 6031 | 1 |
| B | 0 | 6260 | 1 |
| C | 0 | 6822 | 1 |
| D | 0 | 7994 | 1 |
| Quadrant | Total seconds | Saturated seconds | Saturation percentage |
|---|---|---|---|
| A | 2886 | 7 | 0.242550% |
| B | 2886 | 10 | 0.346500% |
| C | 2886 | 30 | 1.039501% |
| D | 2886 | 131 | 4.539155% |
Noise dominated data is calculated using 1-second bins in cleaned event files. If a bin has >2000 counts, and if more than 50% of those come from <1% of pixels, then it is considered to be noise-dominated and hence unusable.
| Quadrant | # 1 sec bins | Bins with >0 counts | Bins with >2000 counts | High rate bins dominated by noise | Noise dominated (total time) | Noise dominated (detector-on time) | Marked lightcurve |
|---|---|---|---|---|---|---|---|
| A | 2886 | 2886 | 3 | 3 | 0.10% | 0.10% | 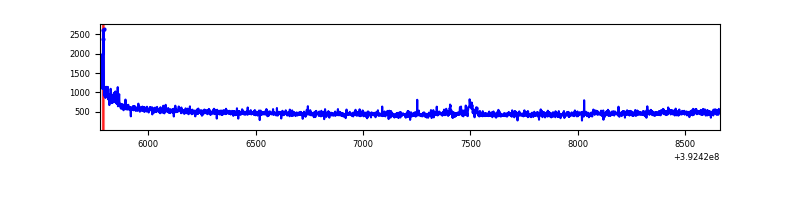 |
| B | 2886 | 2886 | 5 | 5 | 0.17% | 0.17% | 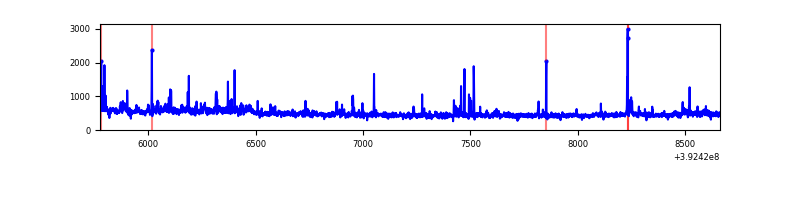 |
| C | 2886 | 2886 | 30 | 30 | 1.04% | 1.04% | 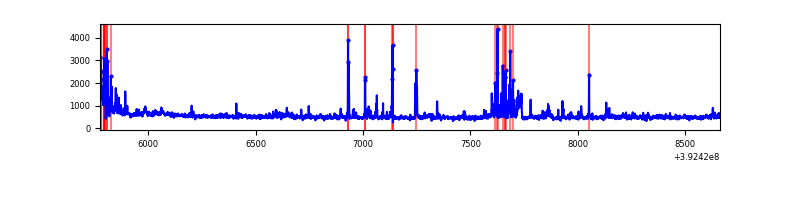 |
| D | 2886 | 2886 | 141 | 141 | 4.89% | 4.89% | 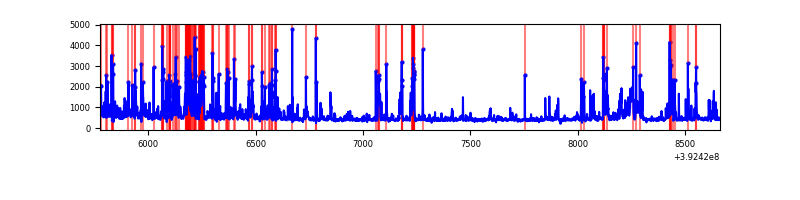 |
Top three noisy pixels from each quadrant. If the there are fewer than three noisy pixels in the level2.evt file, extra rows are filled as -1
| Pixel properties | Quadrant properties | ||||||
|---|---|---|---|---|---|---|---|
| Quadrant | DetID | PixID | Counts | Sigma | Mean | Median | Sigma |
| A | 10 | 83 | 88388 | 1357.72 | 320 | 314 | 64.9 |
| A | 8 | 144 | 30776 | 469.59 | 320 | 314 | 64.9 |
| A | 15 | 223 | 24038 | 365.72 | 320 | 314 | 64.9 |
| B | 0 | 190 | 78708 | 1254.82 | 325 | 316 | 62.5 |
| B | 5 | 172 | 68574 | 1092.6 | 325 | 316 | 62.5 |
| B | 5 | 255 | 12724 | 198.61 | 325 | 316 | 62.5 |
| C | 4 | 254 | 186848 | 2514.5 | 318 | 321 | 74.2 |
| C | 15 | 214 | 129817 | 1745.69 | 318 | 321 | 74.2 |
| C | 0 | 10 | 97619 | 1311.64 | 318 | 321 | 74.2 |
| D | 12 | 6 | 538229 | 7132.21 | 306 | 299 | 75.4 |
| D | 2 | 153 | 65329 | 862.21 | 306 | 299 | 75.4 |
| D | 13 | 249 | 58492 | 771.56 | 306 | 299 | 75.4 |
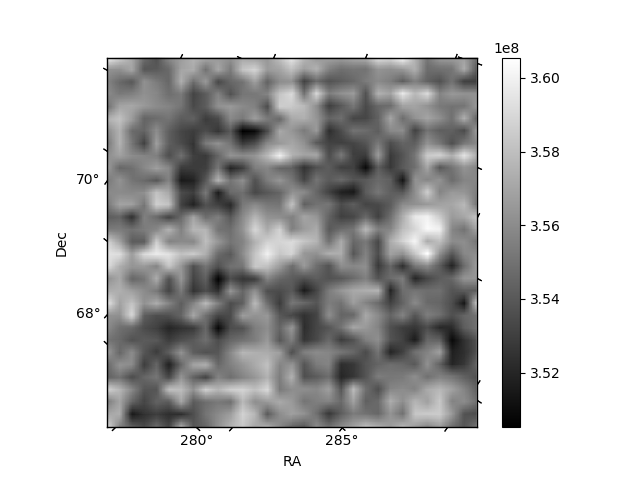
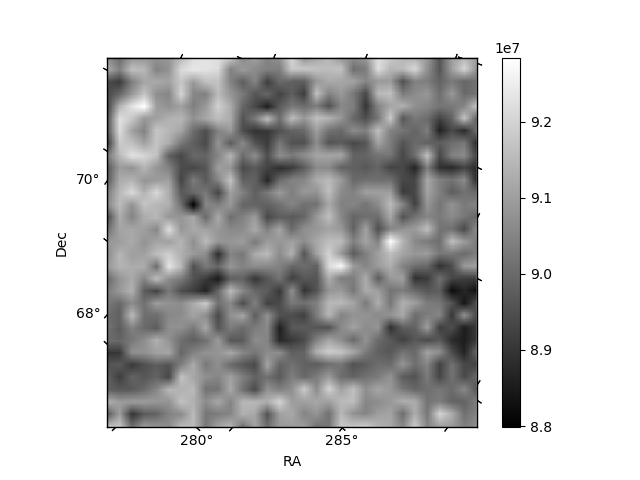
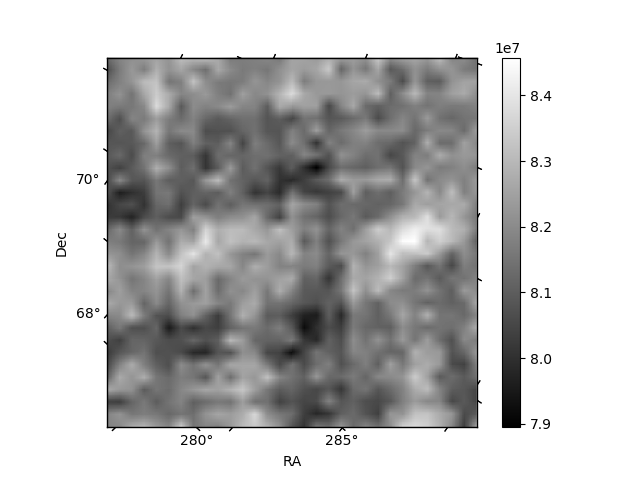
Histogram calculated using DETX and DETY for each event in the final _common_clean file
| Quadrant A | 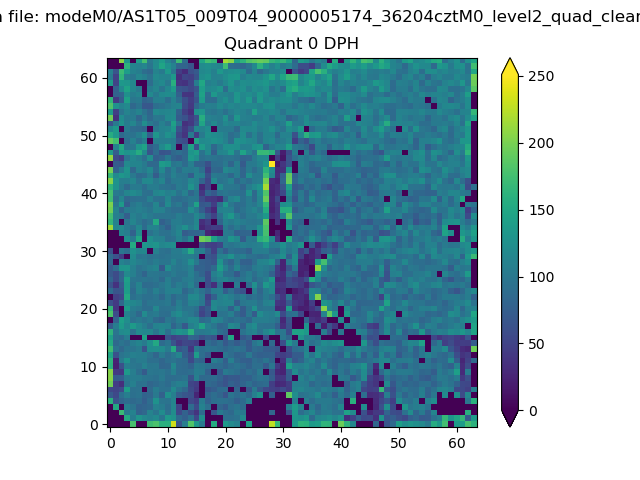 |
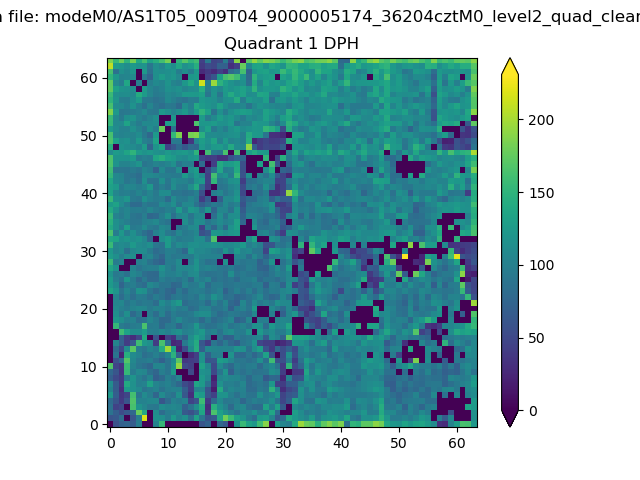 |
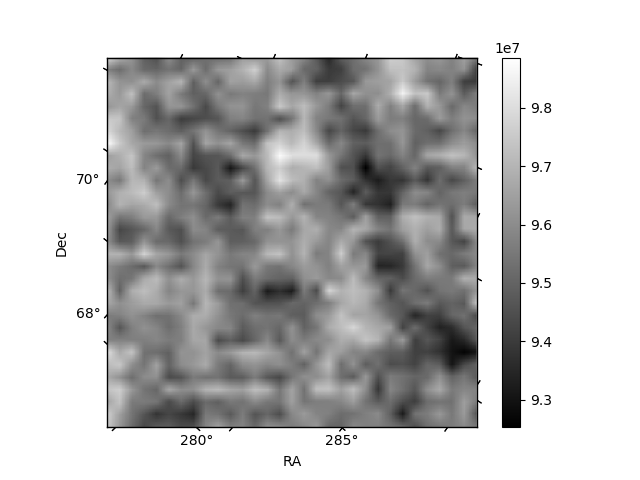
Quadrant B |
|---|---|---|---|
| Quadrant D | 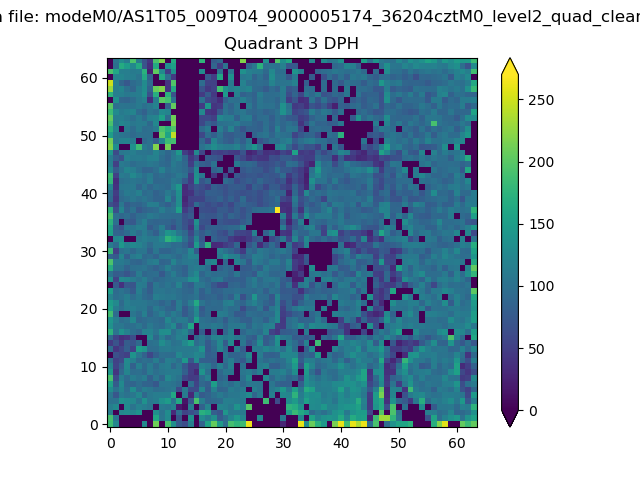 |
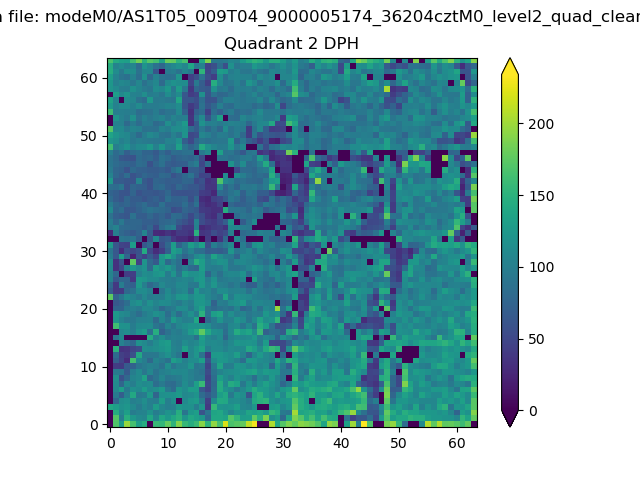 |
Quadrant C |
| Plot type | Count rate plots | Images |
|---|---|---|
| Comparison with Poisson distribution Blue bars denote a histogram of data divided into 1 sec bins. Red curve is a Poisson curve with rate = median count rate of data. |
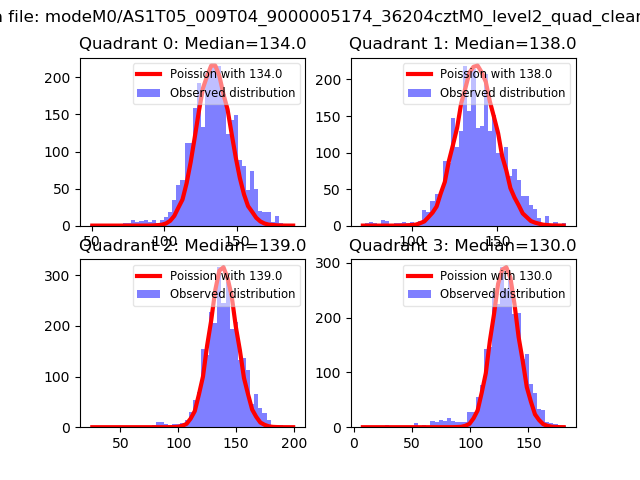 |
 |
| Quadrant-wise count rates Data is divided into 100 sec bins |
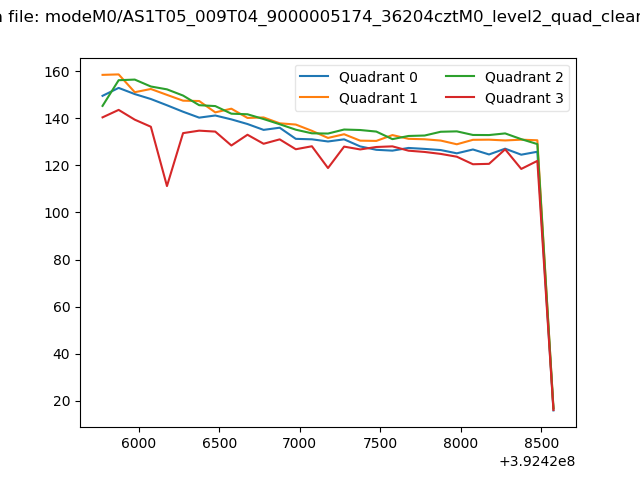 |
|
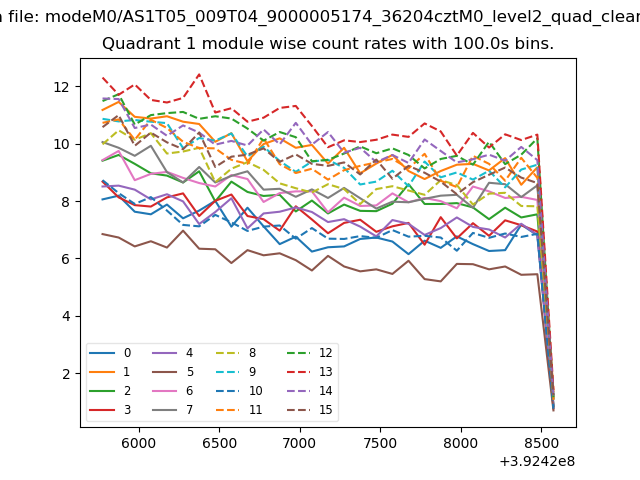
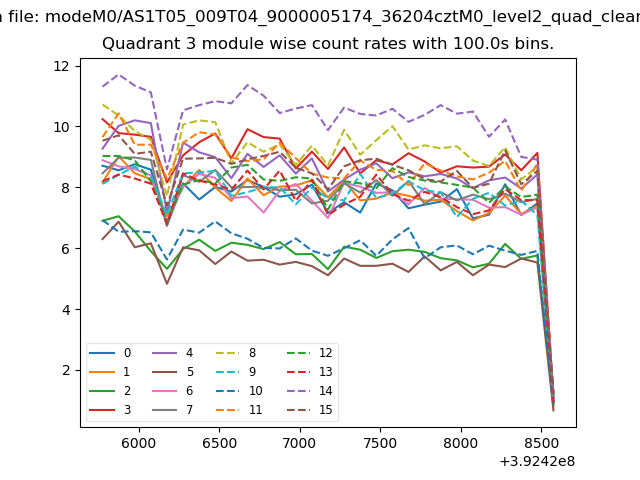
| Module-wise count rates for Quadrant A Data is divided into 100 sec bins |
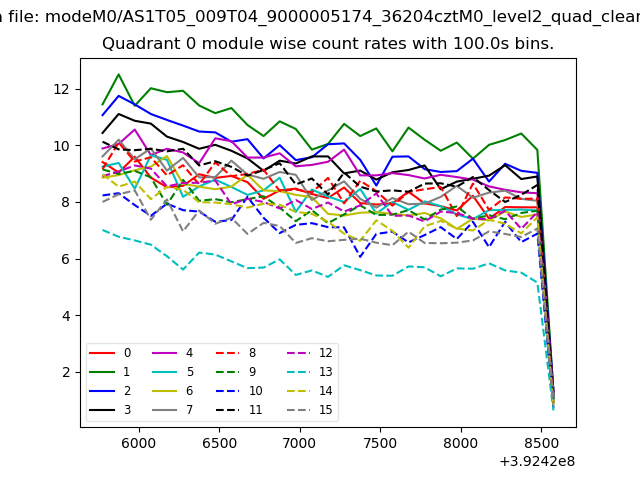 |
 |
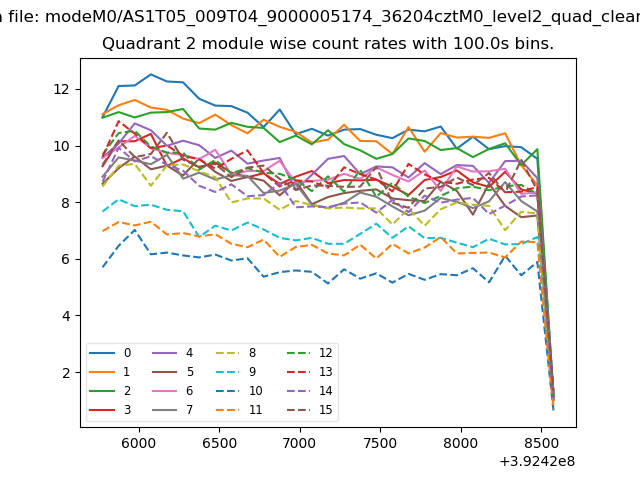
| Module-wise count rates for Quadrant B Data is divided into 100 sec bins |
 |
 |
| Module-wise count rates for Quadrant C Data is divided into 100 sec bins |
 |
 |
| Module-wise count rates for Quadrant D Data is divided into 100 sec bins |
 |
 |
| Parameter | Plot |
|---|---|
| CZT HV Monitor | 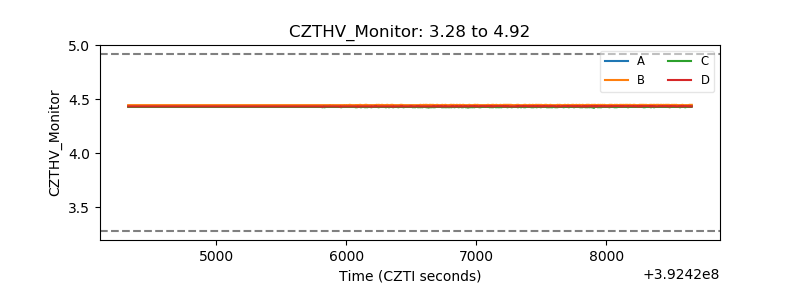 |
| D_VDD | 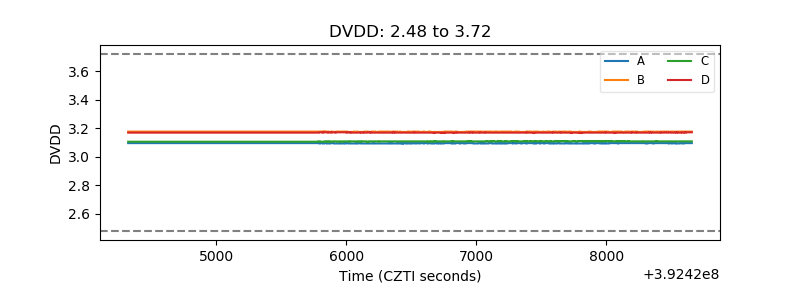 |
| Temperature 1 | 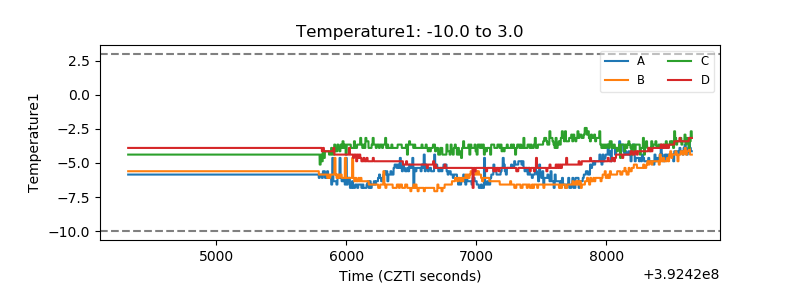 |
| Veto HV Monitor | 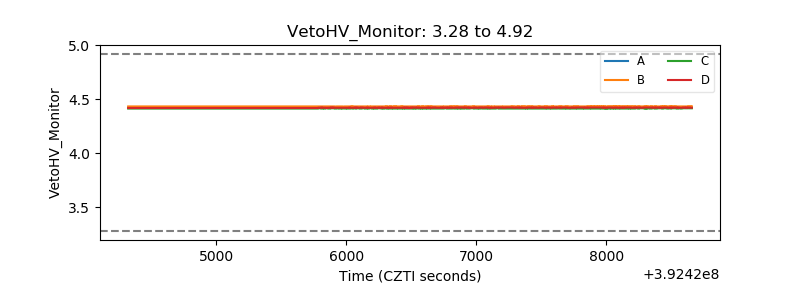 |
| Veto LLD | 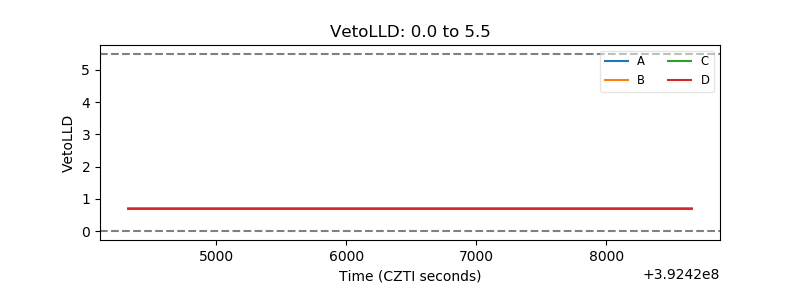 |
| Alpha Counter | 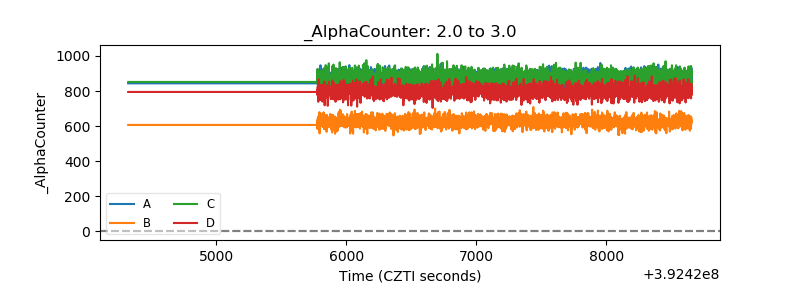 |
| _CPM_Rate | 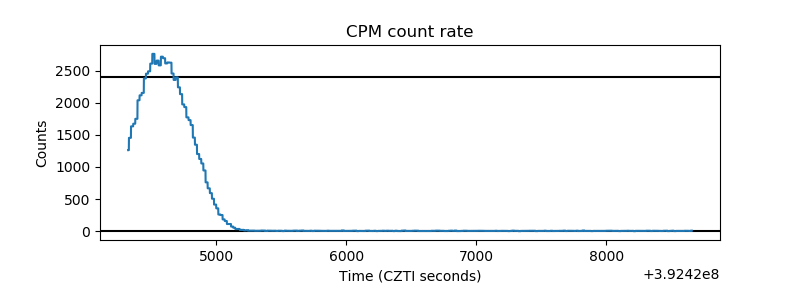 |
| CZT Counter | 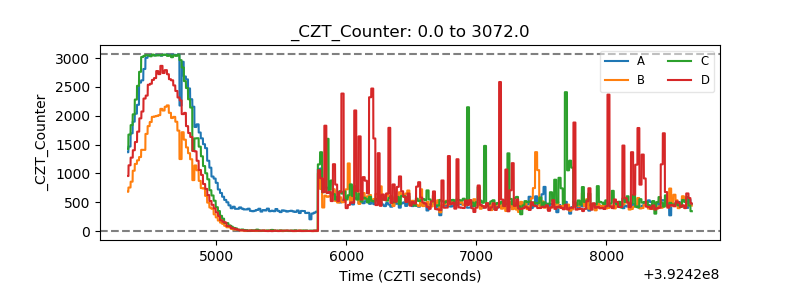 |
| +2.5 Volts monitor | 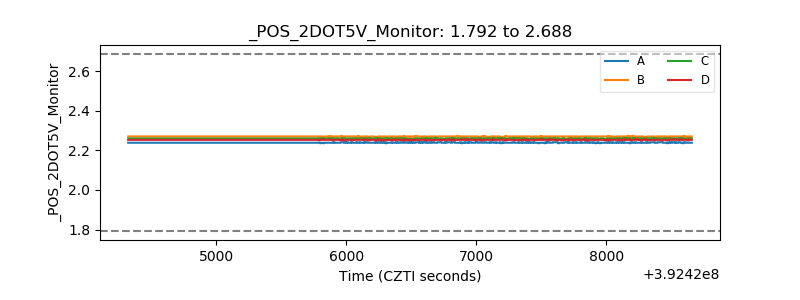 |
| +5 Volts monitor | 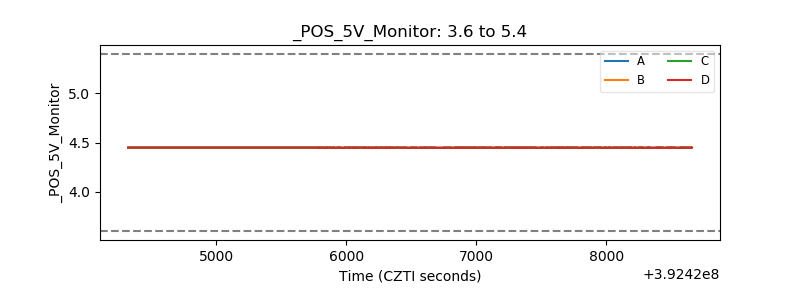 |
| _ROLL_ROT | 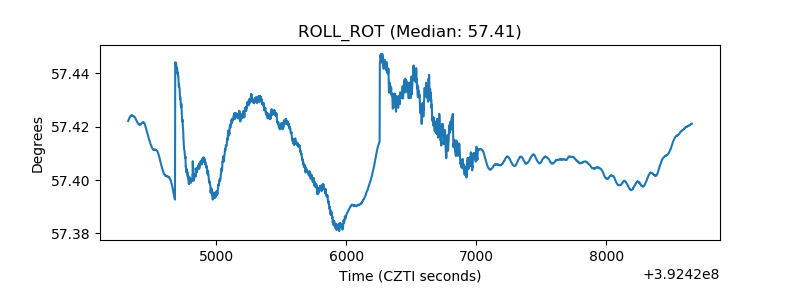 |
| _Roll_DEC | 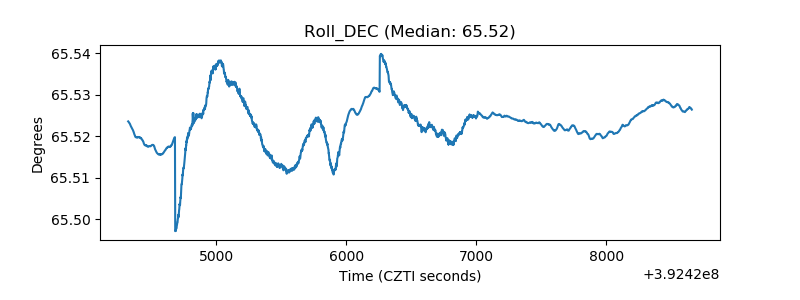 |
| _Roll_RA | 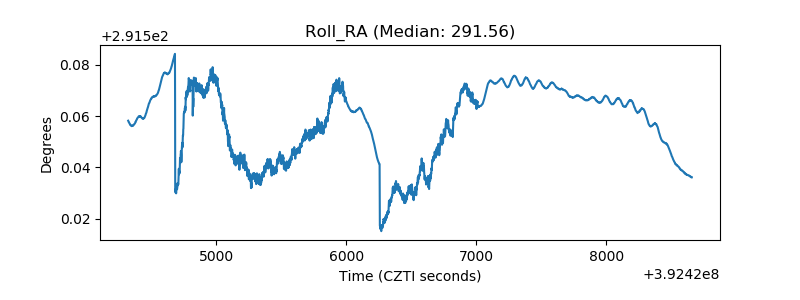 |
| Veto Counter | 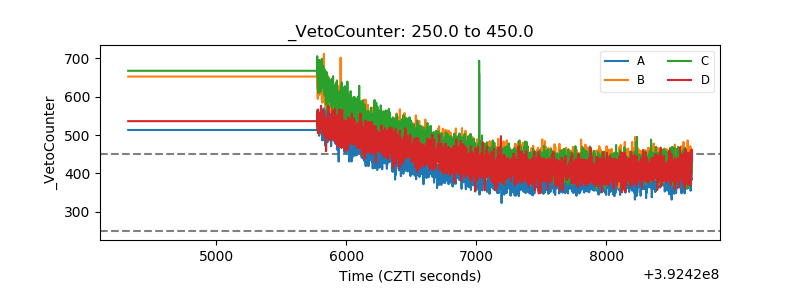 |