| Param | Original file | Final file |
|---|---|---|
| Filename | modeM0/AS1T05_009T04_9000005174cztM0_level2_bc.evt | modeM0/AS1T05_009T04_9000005174cztM0_level2_quad_clean.evt |
| Size (bytes) | 158,650,560 | 58,320,000 |
| Size | 151.3 MB | 55.6 MB |
| Events in quadrant A | 894,968 | 377,413 |
| Events in quadrant B | 1,012,962 | 389,363 |
| Events in quadrant C | 1,212,957 | 391,249 |
| Events in quadrant D | 1,438,083 | 360,252 |
| Mode SS | |||
|---|---|---|---|
| Quadrant | BADHDUFLAG | Total packets | Discarded packets |
| A | 0 | 72 | 0 |
| B | 0 | 72 | 0 |
| C | 0 | 72 | 0 |
| D | 0 | 72 | 0 |
| Mode M9 | |||
|---|---|---|---|
| Quadrant | BADHDUFLAG | Total packets | Discarded packets |
| A | 0 | 21 | 0 |
| B | 0 | 21 | 0 |
| C | 0 | 21 | 0 |
| D | 0 | 21 | 0 |
| Mode M0 | |||
|---|---|---|---|
| Quadrant | BADHDUFLAG | Total packets | Discarded packets |
| A | 0 | 7374 | 0 |
| B | 0 | 8091 | 0 |
| C | 0 | 8291 | 0 |
| D | 0 | 9793 | 0 |
| Quadrant | Total seconds | Saturated seconds | Saturation percentage |
|---|---|---|---|
| A | 3496 | 8 | 0.228833% |
| B | 3496 | 55 | 1.573227% |
| C | 3496 | 30 | 0.858124% |
| D | 3496 | 156 | 4.462243% |
Noise dominated data is calculated using 1-second bins in cleaned event files. If a bin has >2000 counts, and if more than 50% of those come from <1% of pixels, then it is considered to be noise-dominated and hence unusable.
| Quadrant | # 1 sec bins | Bins with >0 counts | Bins with >2000 counts | High rate bins dominated by noise | Noise dominated (total time) | Noise dominated (detector-on time) | Marked lightcurve |
|---|---|---|---|---|---|---|---|
| A | 5589 | 3497 | 0 | 0 | 0.00% | 0.00% | 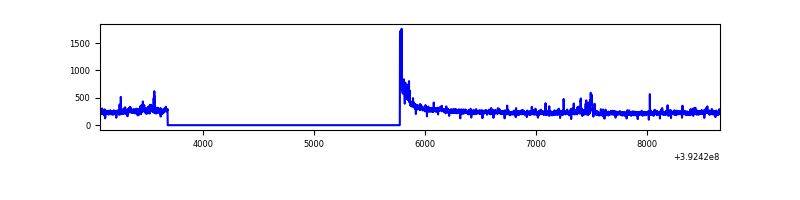 |
| B | 5589 | 3496 | 4 | 4 | 0.07% | 0.11% | 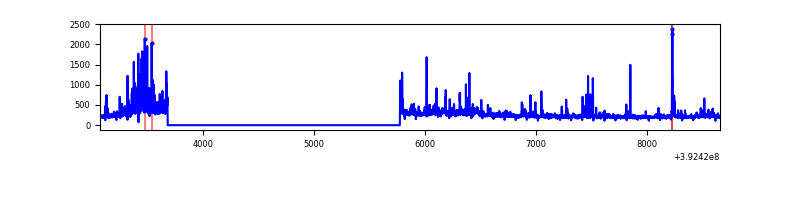 |
| C | 5589 | 3496 | 9 | 9 | 0.16% | 0.26% | 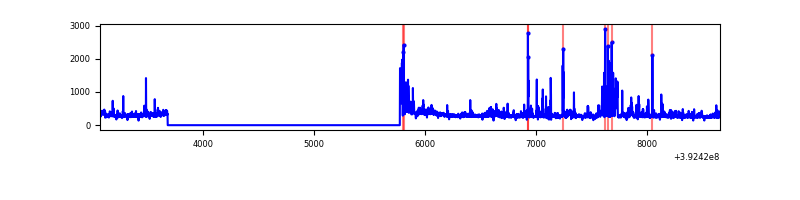 |
| D | 5589 | 3496 | 22 | 22 | 0.39% | 0.63% | 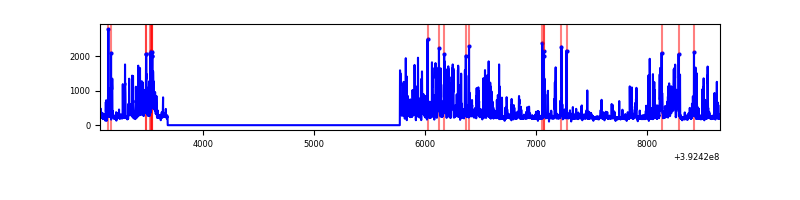 |
Top three noisy pixels from each quadrant. If the there are fewer than three noisy pixels in the level2.evt file, extra rows are filled as -1
| Pixel properties | Quadrant properties | ||||||
|---|---|---|---|---|---|---|---|
| Quadrant | DetID | PixID | Counts | Sigma | Mean | Median | Sigma |
| A | 10 | 83 | 94915 | 2215.42 | 187 | 184 | 42.8 |
| A | 8 | 144 | 39541 | 920.42 | 187 | 184 | 42.8 |
| A | 15 | 223 | 24607 | 571.17 | 187 | 184 | 42.8 |
| B | 5 | 172 | 106109 | 2679.22 | 191 | 187 | 39.5 |
| B | 0 | 190 | 103533 | 2614.06 | 191 | 187 | 39.5 |
| B | 0 | 213 | 31901 | 802.18 | 191 | 187 | 39.5 |
| C | 4 | 254 | 181886 | 3960.96 | 189 | 188 | 45.9 |
| C | 15 | 214 | 149463 | 3254.15 | 189 | 188 | 45.9 |
| C | 0 | 10 | 80216 | 1744.58 | 189 | 188 | 45.9 |
| D | 12 | 6 | 364280 | 7904.06 | 184 | 177 | 46.1 |
| D | 12 | 227 | 102409 | 2219.28 | 184 | 177 | 46.1 |
| D | 2 | 250 | 61714 | 1335.86 | 184 | 177 | 46.1 |
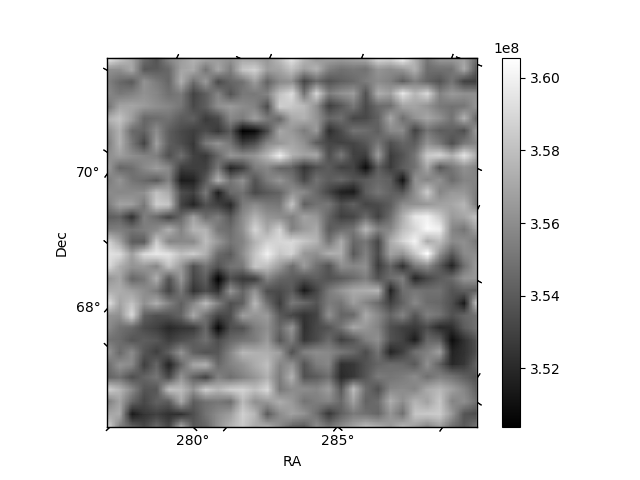
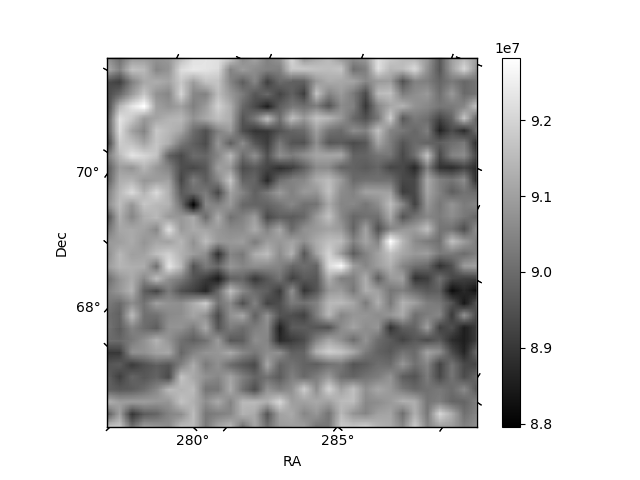
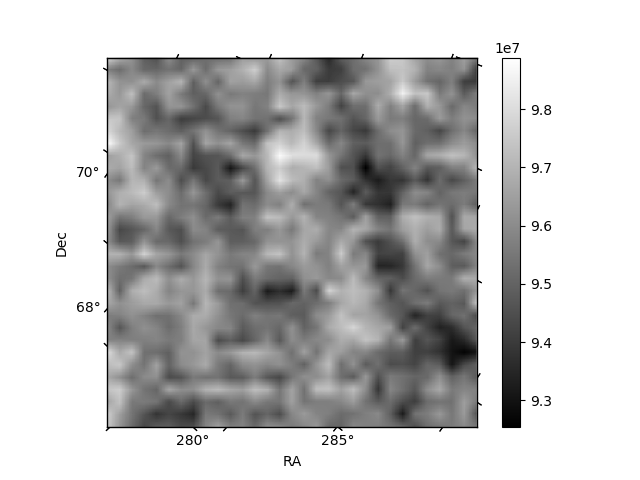
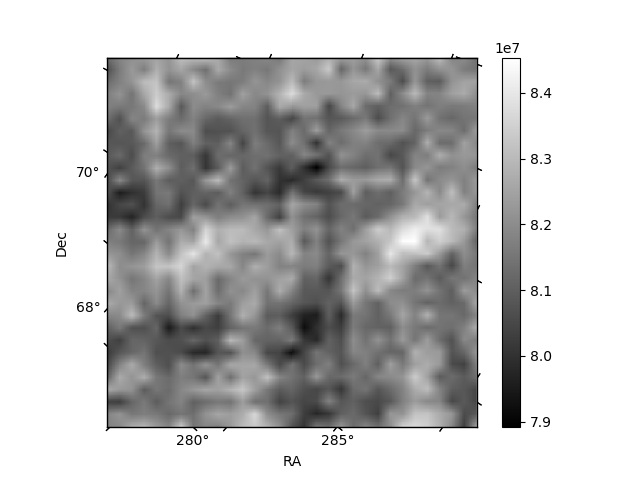
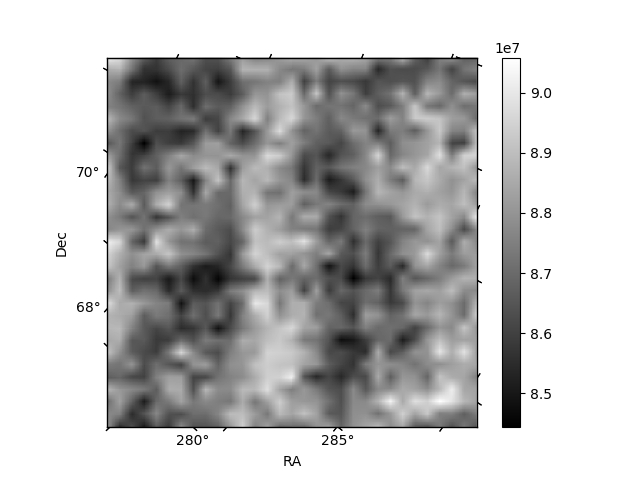
Histogram calculated using DETX and DETY for each event in the final _common_clean file
| Quadrant A | 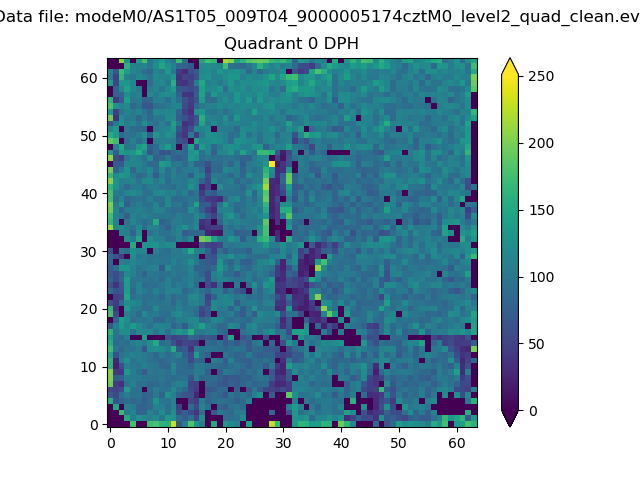 |
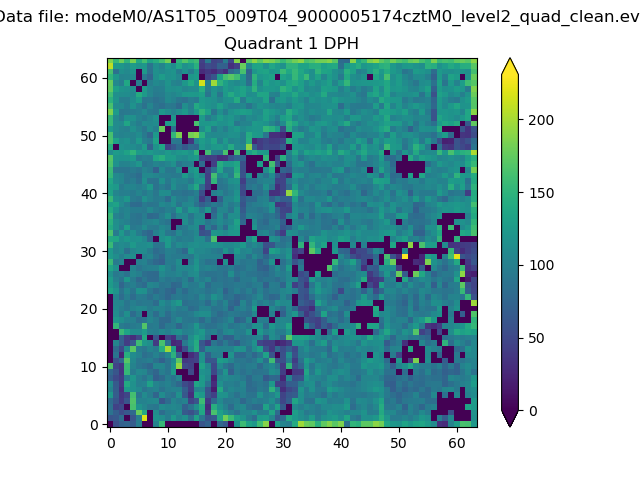 |
Quadrant B |
|---|---|---|---|
| Quadrant D | 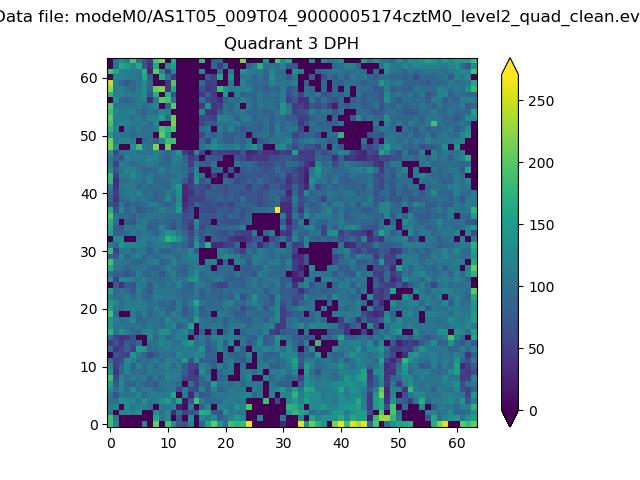 |
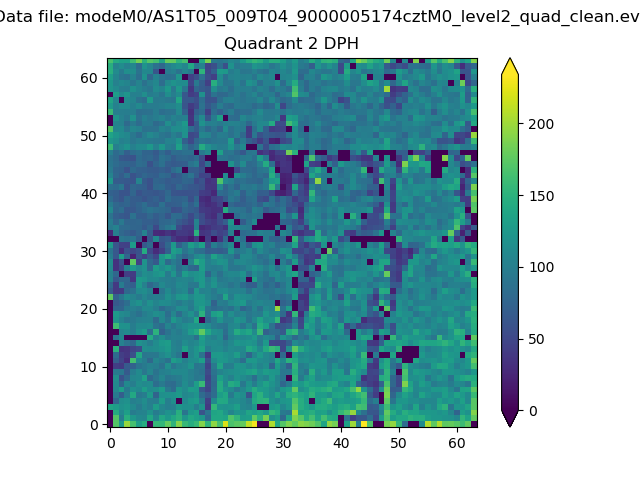 |
Quadrant C |
| Plot type | Count rate plots | Images |
|---|---|---|
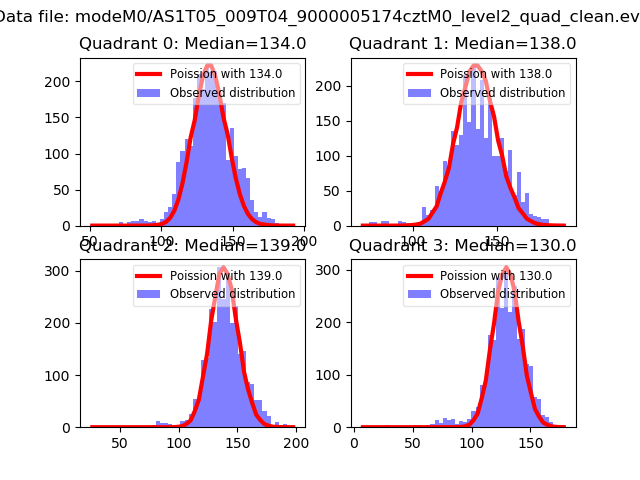
| Comparison with Poisson distribution Blue bars denote a histogram of data divided into 1 sec bins. Red curve is a Poisson curve with rate = median count rate of data. |
 |
 |
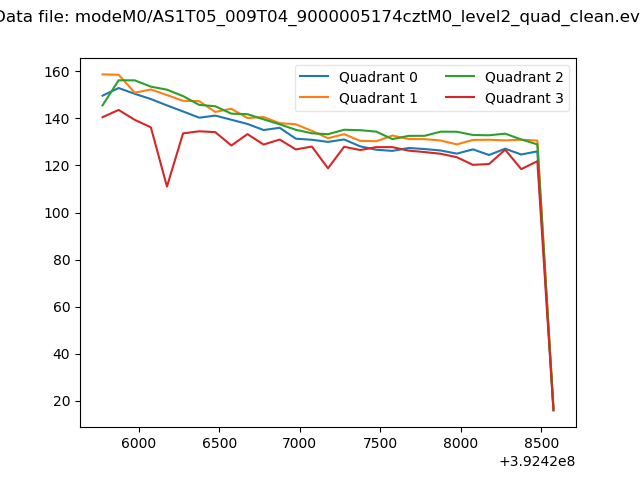
| Quadrant-wise count rates Data is divided into 100 sec bins |
 |
|
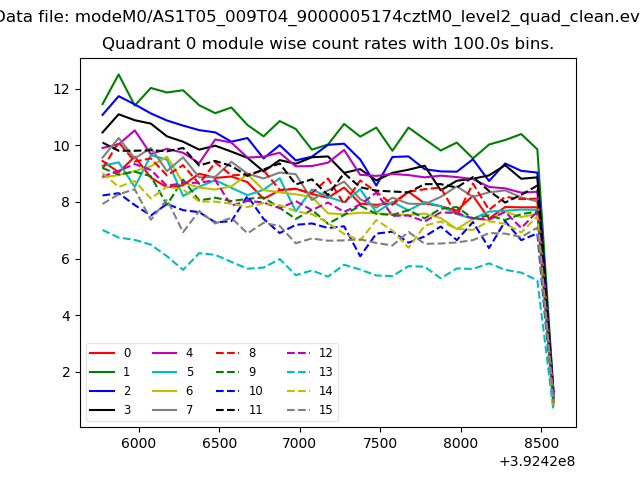
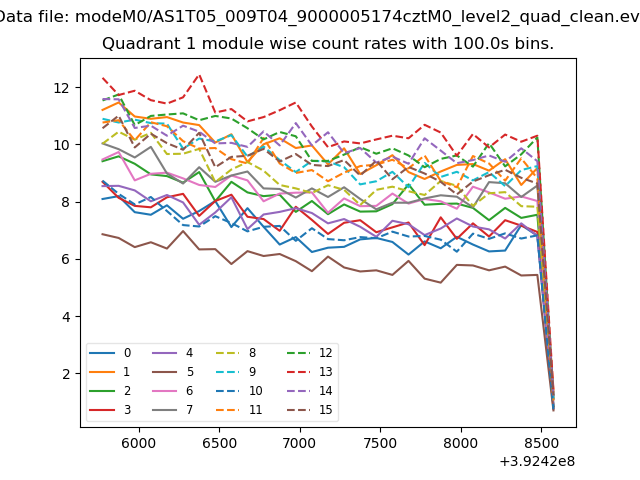
| Module-wise count rates for Quadrant A Data is divided into 100 sec bins |
 |
 |
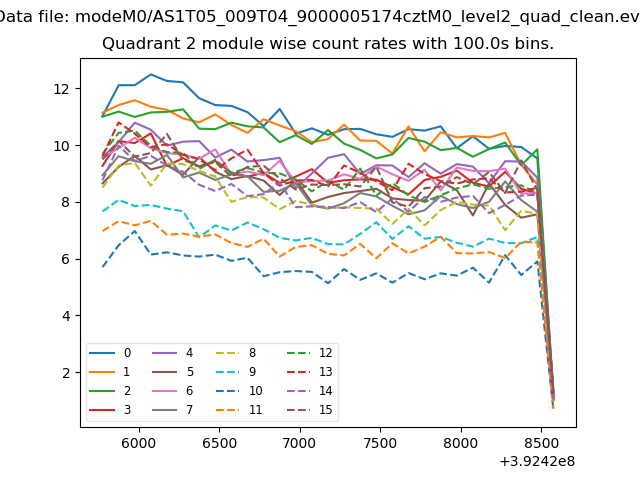
| Module-wise count rates for Quadrant B Data is divided into 100 sec bins |
 |
 |
| Module-wise count rates for Quadrant C Data is divided into 100 sec bins |
 |
 |
| Module-wise count rates for Quadrant D Data is divided into 100 sec bins |
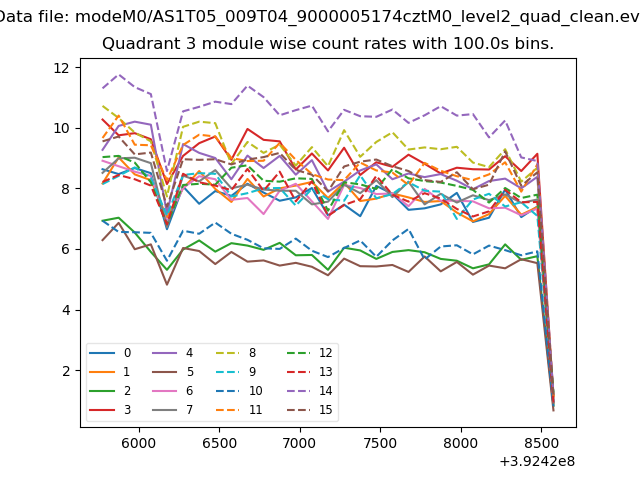 |
 |
| Parameter | Plot |
|---|---|
| CZT HV Monitor | 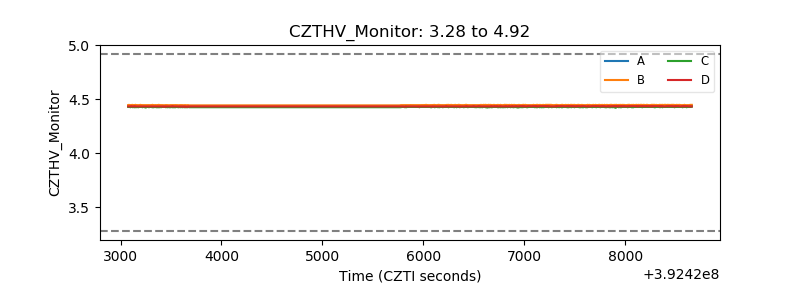 |
| D_VDD | 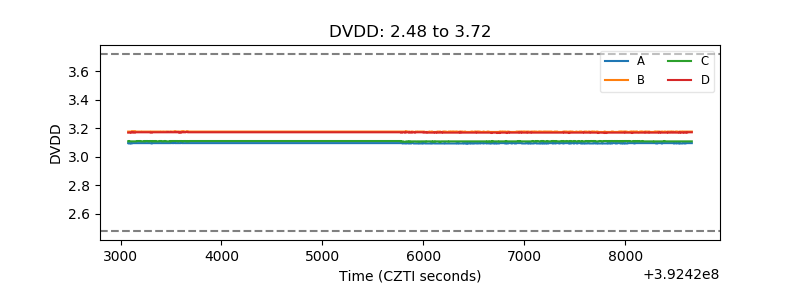 |
| Temperature 1 | 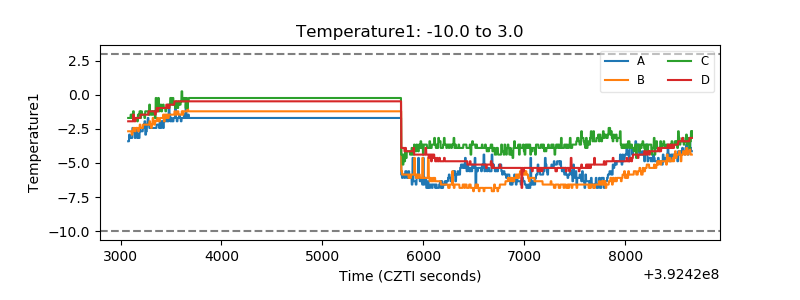 |
| Veto HV Monitor | 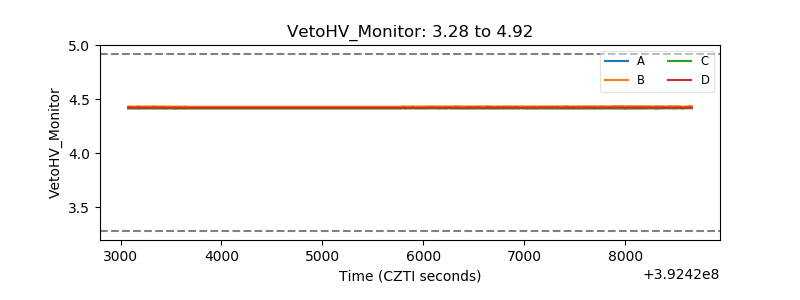 |
| Veto LLD | 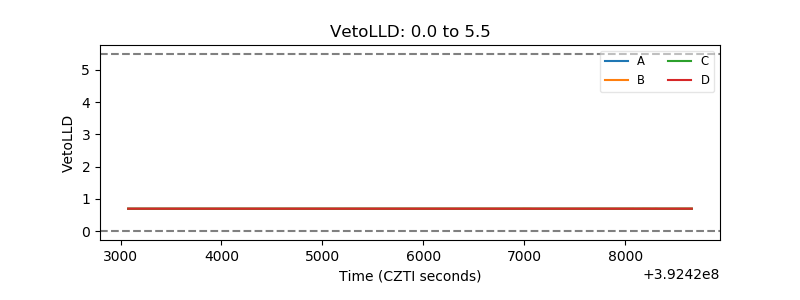 |
| Alpha Counter | 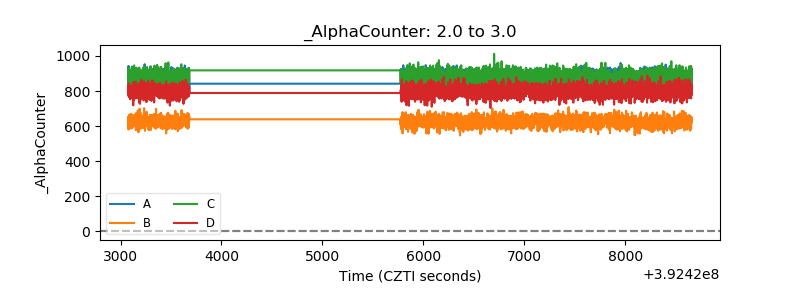 |
| _CPM_Rate | 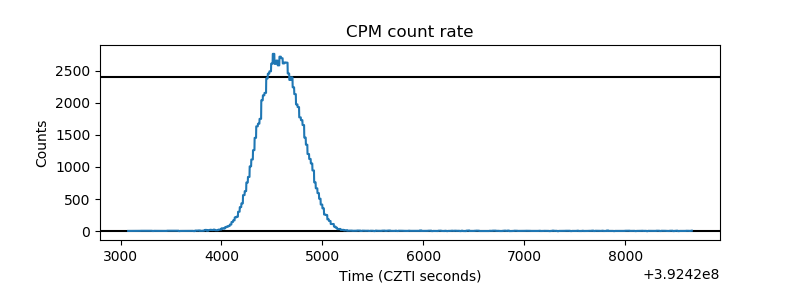 |
| CZT Counter | 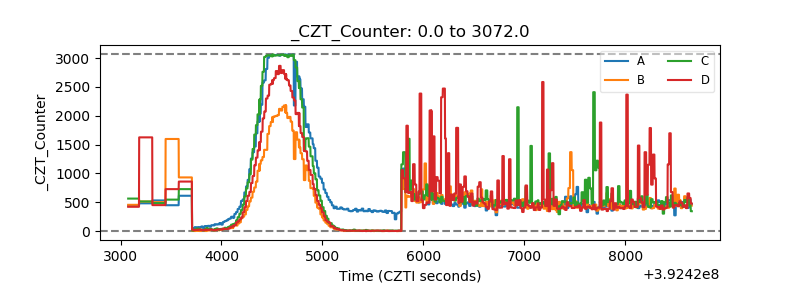 |
| +2.5 Volts monitor |  |
| +5 Volts monitor | 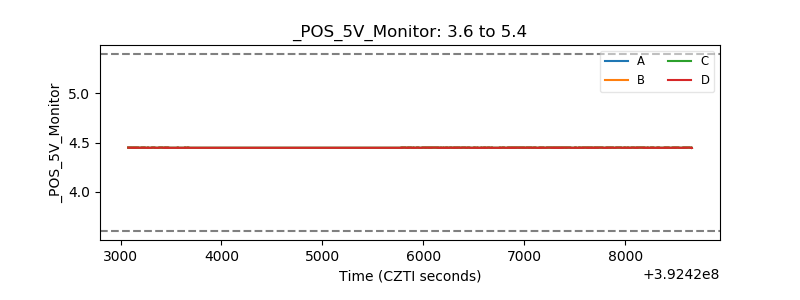 |
| _ROLL_ROT | 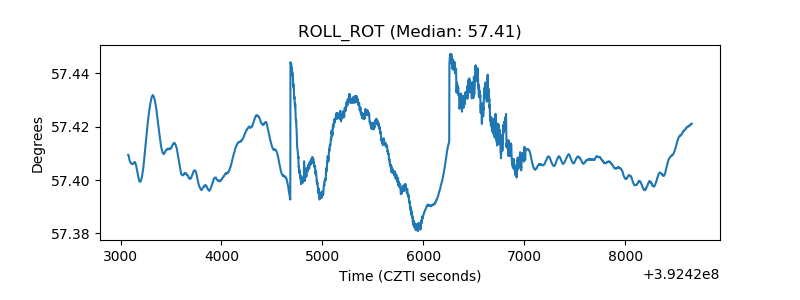 |
| _Roll_DEC | 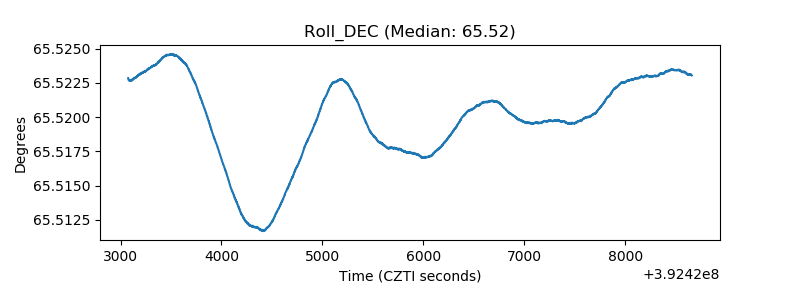 |
| _Roll_RA | 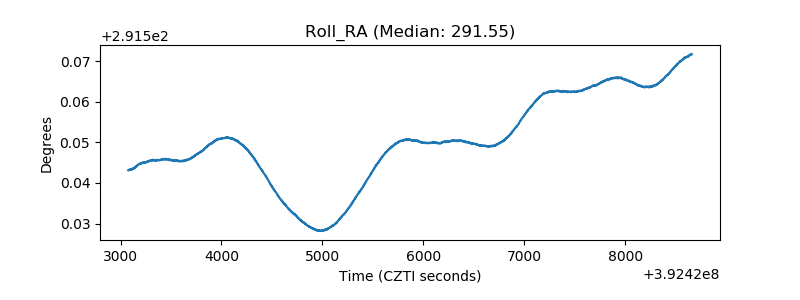 |
| Veto Counter | 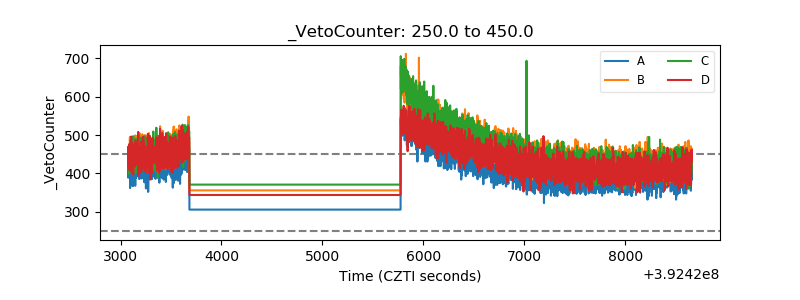 |