| Param | Original file | Final file |
|---|---|---|
| Filename | modeM0/AS1T05_009T02_9000005172_36203cztM0_level2.evt | modeM0/AS1T05_009T02_9000005172_36203cztM0_level2_quad_clean.evt |
| Size (bytes) | 280,774,080 | 67,032,000 |
| Size | 267.8 MB | 63.9 MB |
| Events in quadrant A | 1,698,915 | 451,658 |
| Events in quadrant B | 1,768,567 | 463,731 |
| Events in quadrant C | 1,911,130 | 469,247 |
| Events in quadrant D | 2,901,908 | 413,642 |
| Mode M0 | |||
|---|---|---|---|
| Quadrant | BADHDUFLAG | Total packets | Discarded packets |
| A | 0 | 7208 | 1 |
| B | 0 | 7462 | 1 |
| C | 0 | 7636 | 1 |
| D | 0 | 10883 | 1 |
| Mode SS | |||
|---|---|---|---|
| Quadrant | BADHDUFLAG | Total packets | Discarded packets |
| A | 0 | 66 | 0 |
| B | 0 | 66 | 0 |
| C | 0 | 66 | 0 |
| D | 0 | 66 | 0 |
| Mode M9 | |||
|---|---|---|---|
| Quadrant | BADHDUFLAG | Total packets | Discarded packets |
| A | 0 | 10 | 0 |
| B | 0 | 10 | 0 |
| C | 0 | 10 | 0 |
| D | 0 | 11 | 0 |
| Quadrant | Total seconds | Saturated seconds | Saturation percentage |
|---|---|---|---|
| A | 3256 | 6 | 0.184275% |
| B | 3256 | 48 | 1.474201% |
| C | 3256 | 24 | 0.737101% |
| D | 3256 | 366 | 11.240786% |
Noise dominated data is calculated using 1-second bins in cleaned event files. If a bin has >2000 counts, and if more than 50% of those come from <1% of pixels, then it is considered to be noise-dominated and hence unusable.
| Quadrant | # 1 sec bins | Bins with >0 counts | Bins with >2000 counts | High rate bins dominated by noise | Noise dominated (total time) | Noise dominated (detector-on time) | Marked lightcurve |
|---|---|---|---|---|---|---|---|
| A | 3256 | 3256 | 1 | 1 | 0.03% | 0.03% | 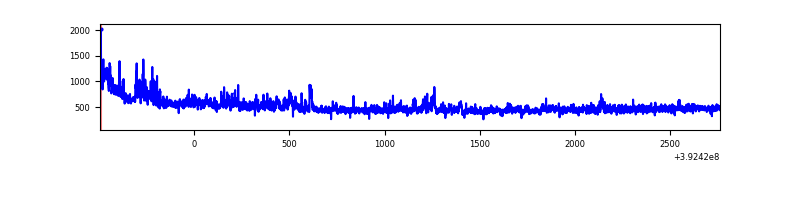 |
| B | 3256 | 3256 | 29 | 29 | 0.89% | 0.89% | 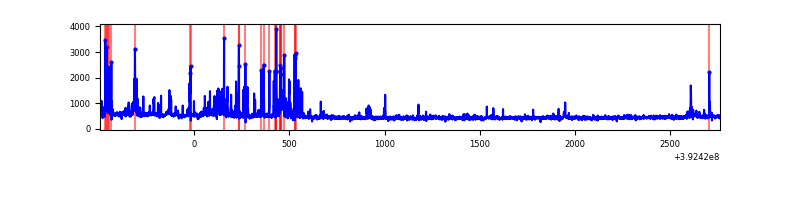 |
| C | 3256 | 3256 | 19 | 19 | 0.58% | 0.58% | 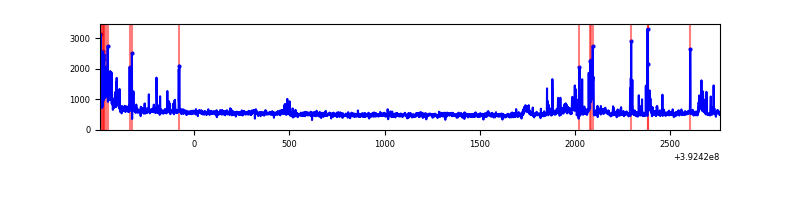 |
| D | 3256 | 3256 | 321 | 321 | 9.86% | 9.86% | 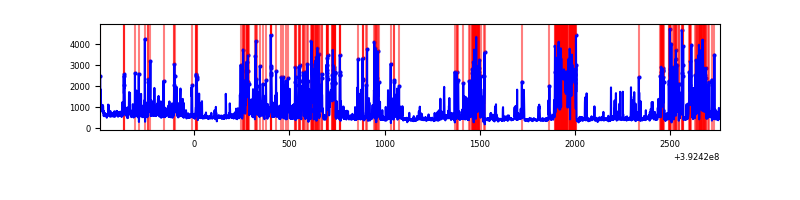 |
Top three noisy pixels from each quadrant. If the there are fewer than three noisy pixels in the level2.evt file, extra rows are filled as -1
| Pixel properties | Quadrant properties | ||||||
|---|---|---|---|---|---|---|---|
| Quadrant | DetID | PixID | Counts | Sigma | Mean | Median | Sigma |
| A | 15 | 223 | 104252 | 1387.89 | 372 | 365 | 74.9 |
| A | 10 | 83 | 95653 | 1273.01 | 372 | 365 | 74.9 |
| A | 8 | 144 | 56080 | 744.33 | 372 | 365 | 74.9 |
| B | 4 | 171 | 153477 | 2140.03 | 376 | 366 | 71.5 |
| B | 5 | 172 | 63151 | 877.54 | 376 | 366 | 71.5 |
| B | 5 | 255 | 51473 | 714.32 | 376 | 366 | 71.5 |
| C | 15 | 214 | 145308 | 1657.88 | 374 | 378 | 87.4 |
| C | 1 | 23 | 139885 | 1595.84 | 374 | 378 | 87.4 |
| C | 0 | 10 | 63414 | 721.08 | 374 | 378 | 87.4 |
| D | 12 | 6 | 914807 | 10821.92 | 347 | 339 | 84.5 |
| D | 2 | 250 | 168014 | 1984.28 | 347 | 339 | 84.5 |
| D | 12 | 233 | 157118 | 1855.34 | 347 | 339 | 84.5 |
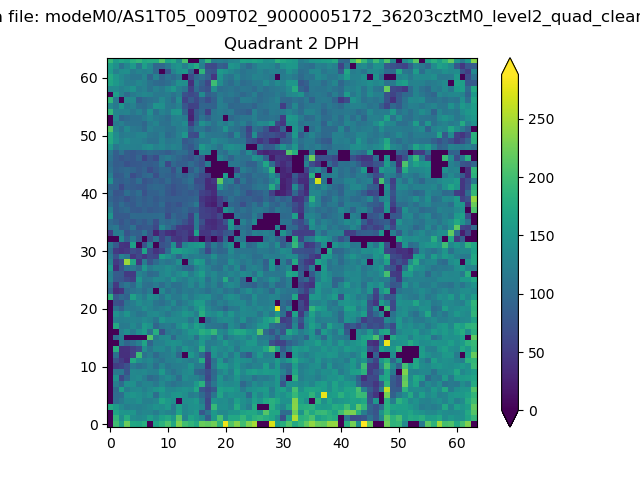
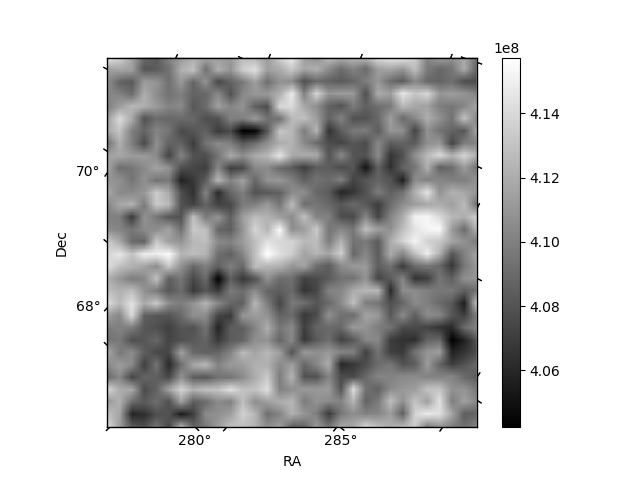
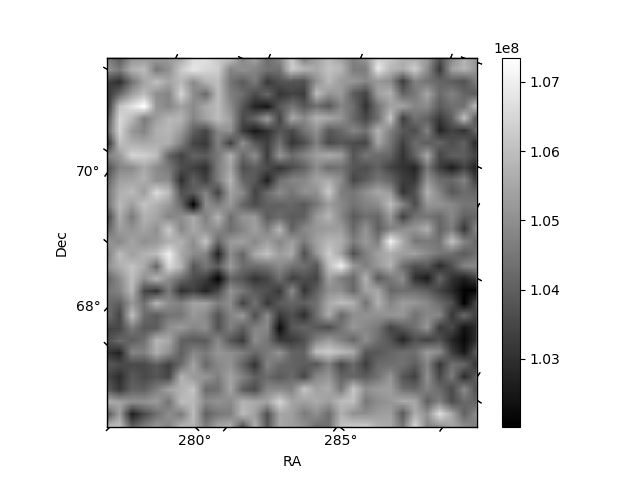
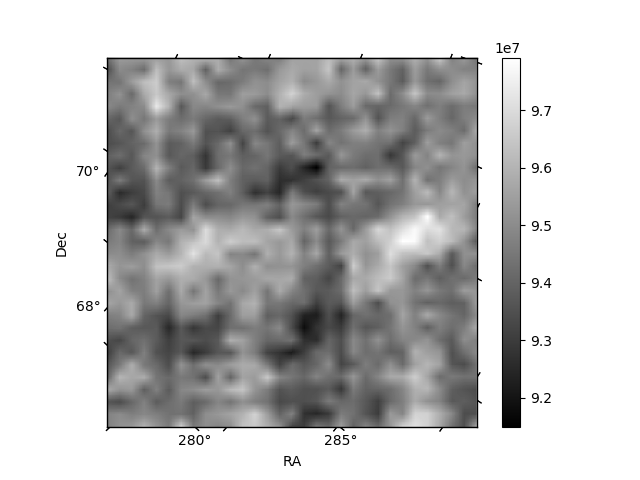
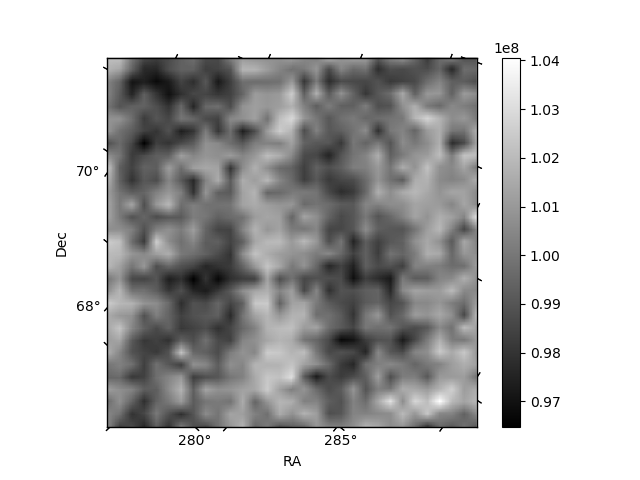
Histogram calculated using DETX and DETY for each event in the final _common_clean file
| Quadrant A | 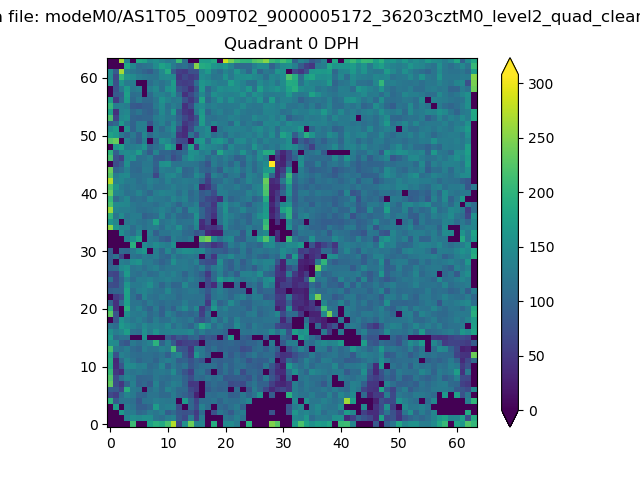 |
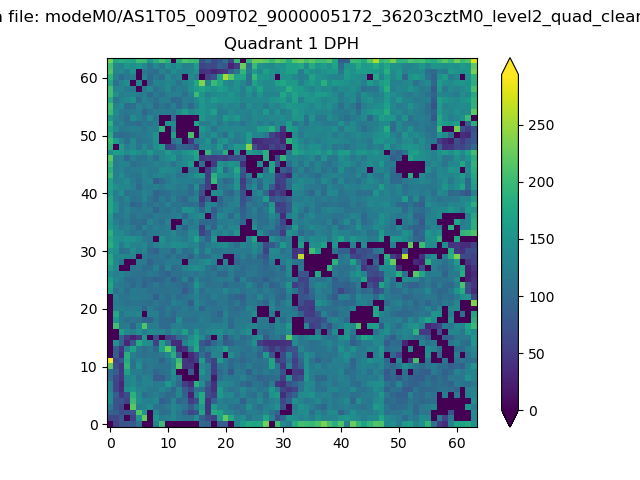 |
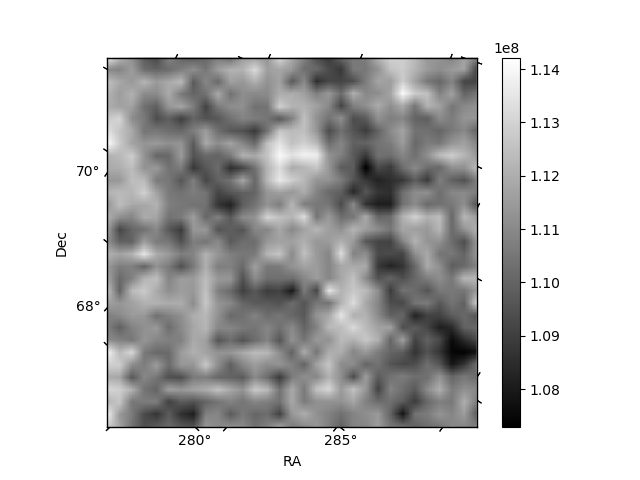
Quadrant B |
|---|---|---|---|
| Quadrant D | 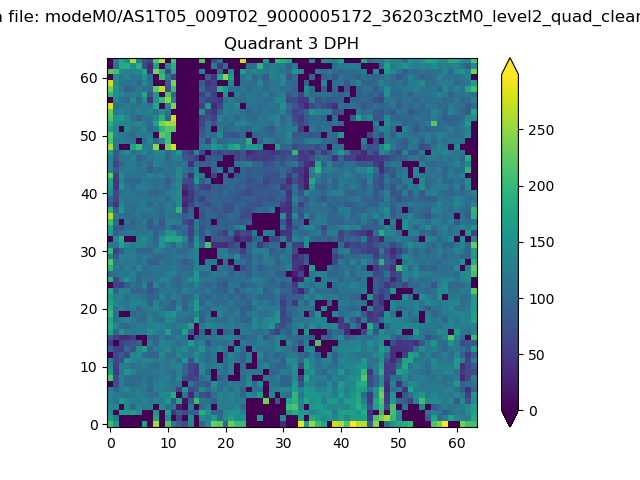 |
 |
Quadrant C |
| Plot type | Count rate plots | Images |
|---|---|---|
| Comparison with Poisson distribution Blue bars denote a histogram of data divided into 1 sec bins. Red curve is a Poisson curve with rate = median count rate of data. |
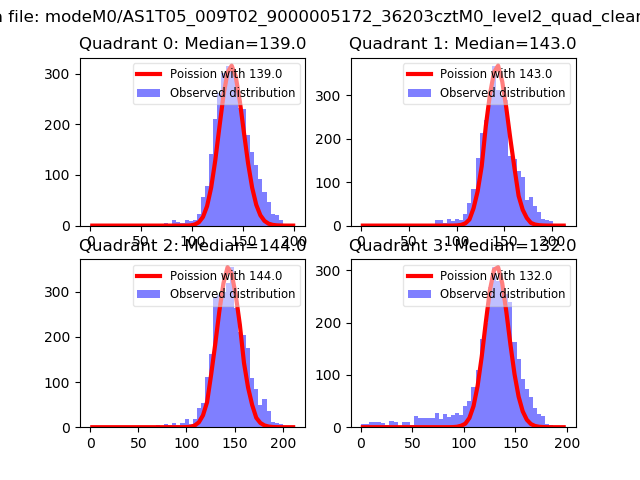 |
 |
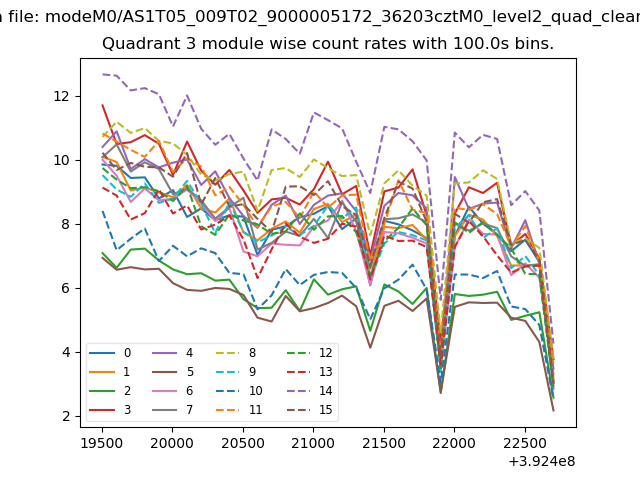
| Quadrant-wise count rates Data is divided into 100 sec bins |
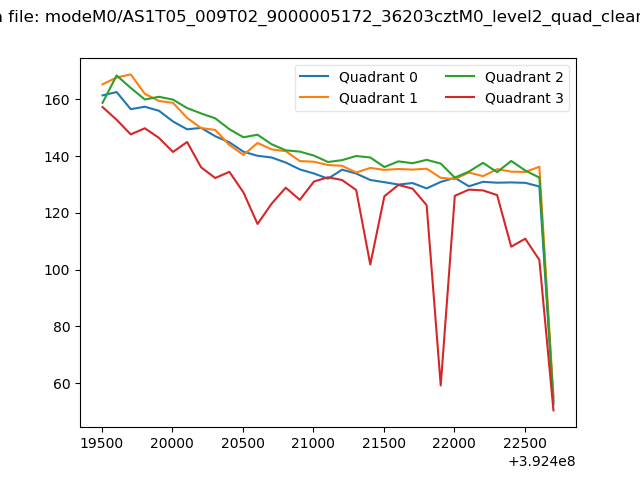 |
|
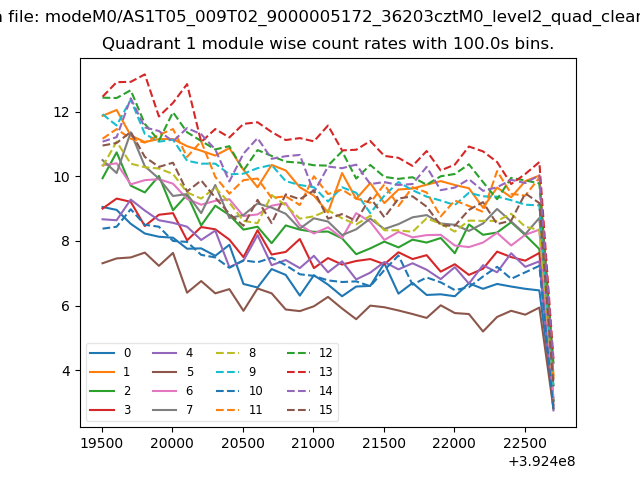
| Module-wise count rates for Quadrant A Data is divided into 100 sec bins |
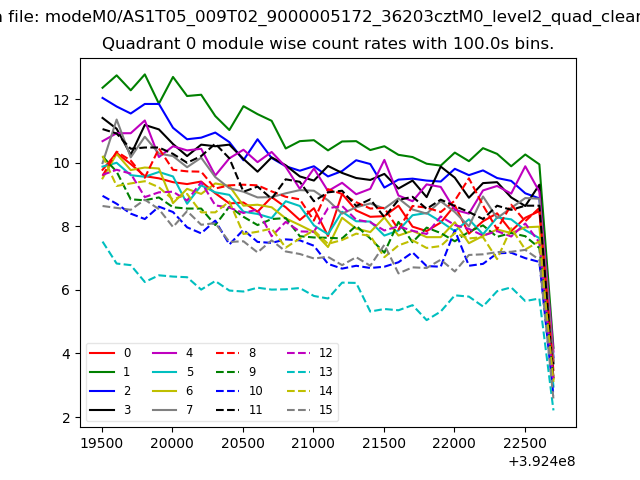 |
 |
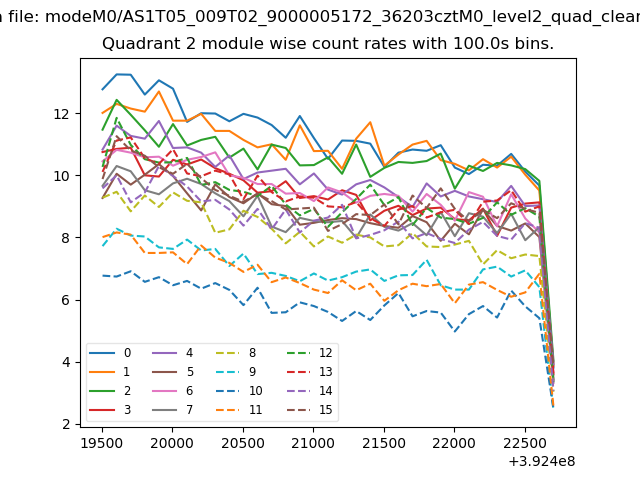
| Module-wise count rates for Quadrant B Data is divided into 100 sec bins |
 |
 |
| Module-wise count rates for Quadrant C Data is divided into 100 sec bins |
 |
 |
| Module-wise count rates for Quadrant D Data is divided into 100 sec bins |
 |
 |
| Parameter | Plot |
|---|---|
| CZT HV Monitor | 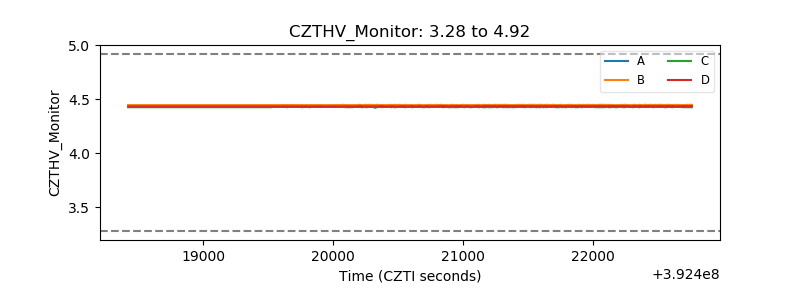 |
| D_VDD | 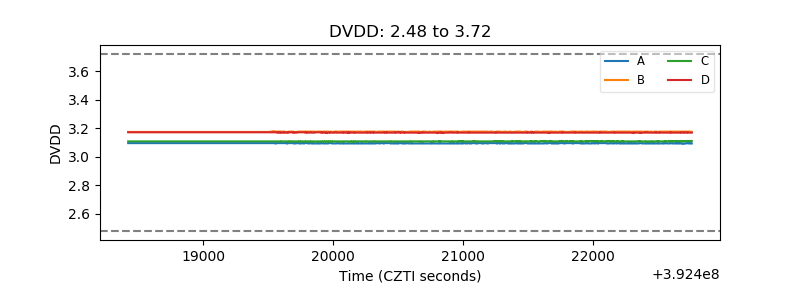 |
| Temperature 1 | 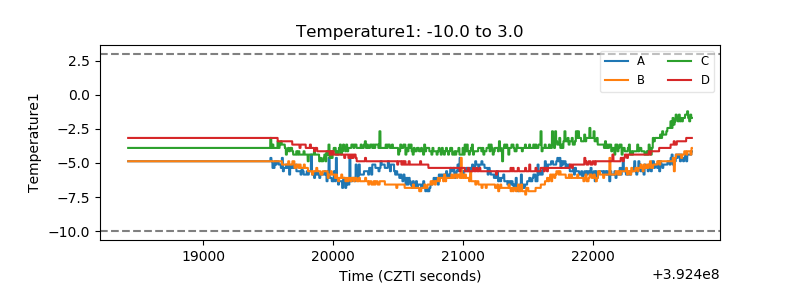 |
| Veto HV Monitor | 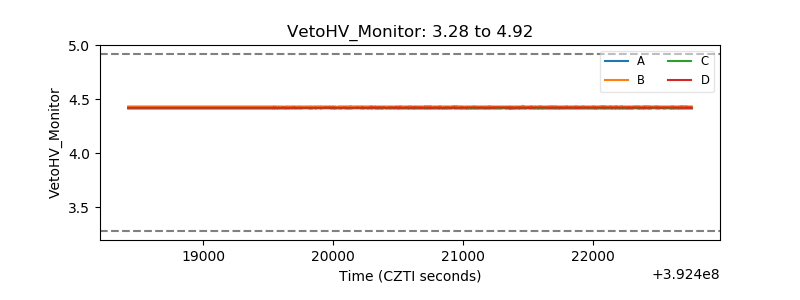 |
| Veto LLD | 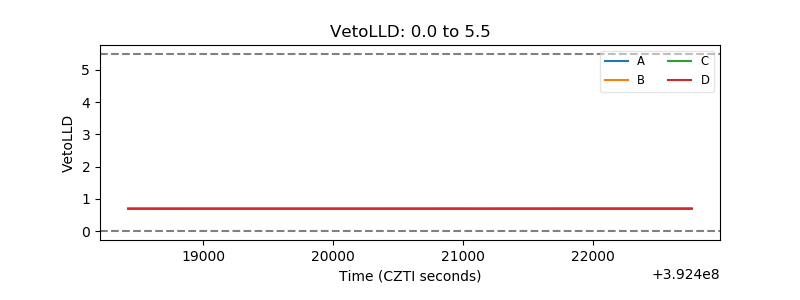 |
| Alpha Counter | 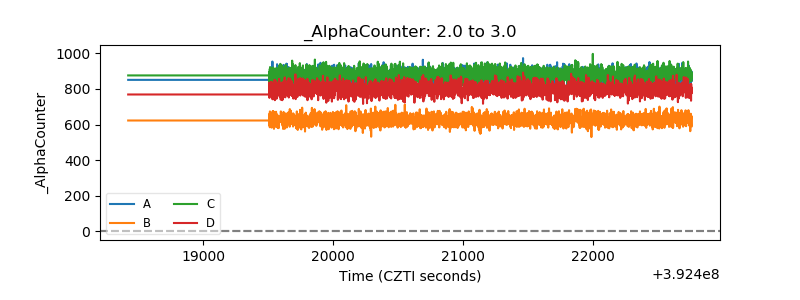 |
| _CPM_Rate | 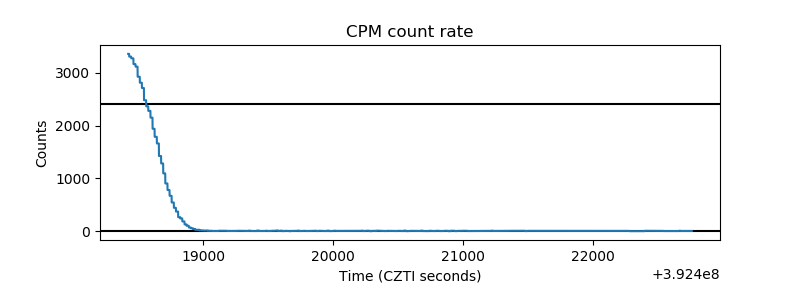 |
| CZT Counter | 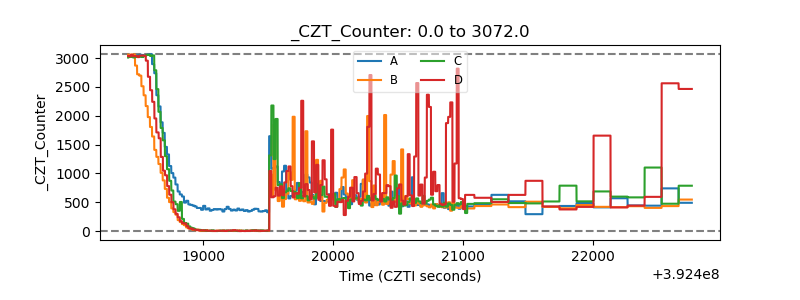 |
| +2.5 Volts monitor | 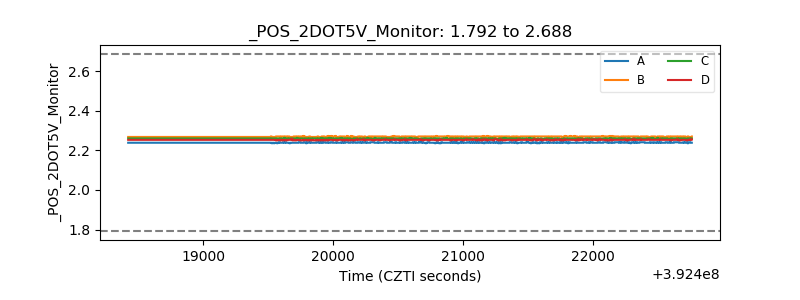 |
| +5 Volts monitor | 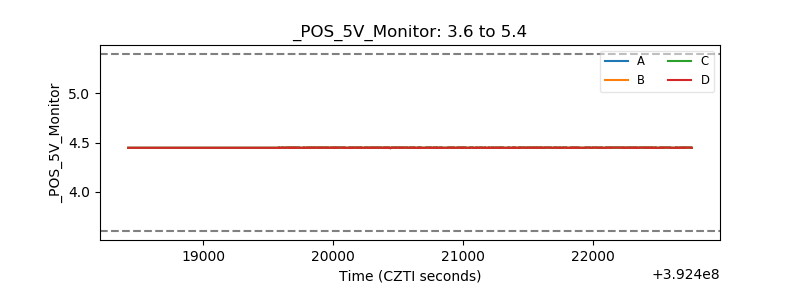 |
| _ROLL_ROT | 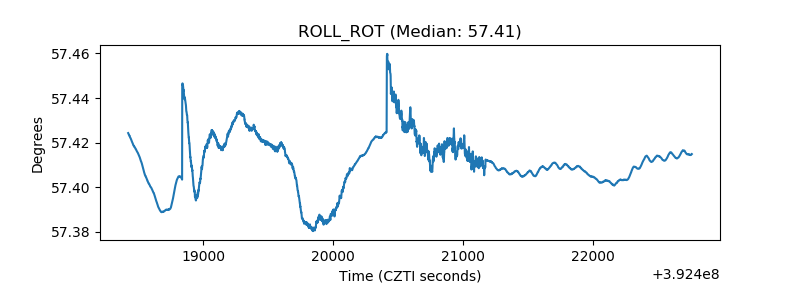 |
| _Roll_DEC | 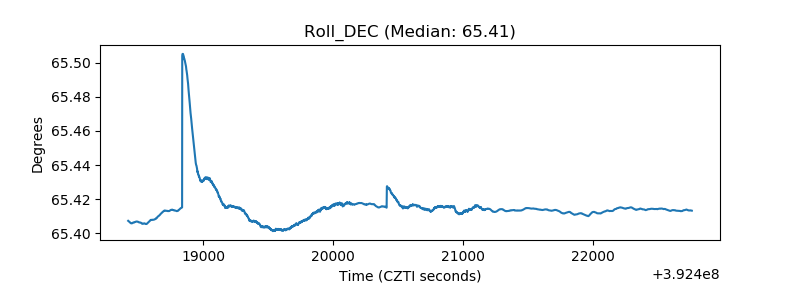 |
| _Roll_RA | 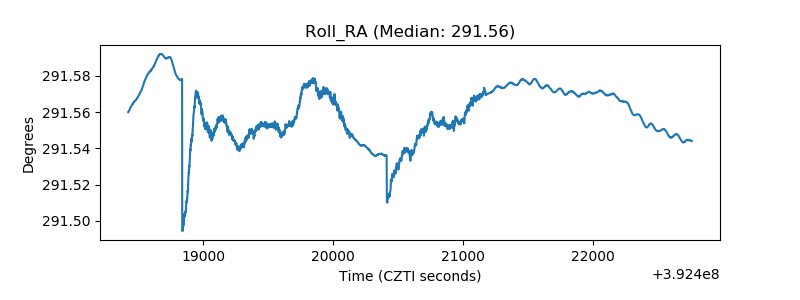 |
| Veto Counter | 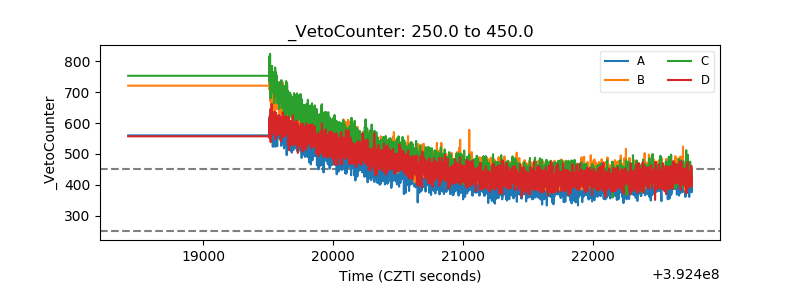 |