| Param | Original file | Final file |
|---|---|---|
| Filename | modeM0/AS1T05_009T01_9000005168_36188cztM0_level2.evt | modeM0/AS1T05_009T01_9000005168_36188cztM0_level2_quad_clean.evt |
| Size (bytes) | 276,419,520 | 68,866,560 |
| Size | 263.6 MB | 65.7 MB |
| Events in quadrant A | 1,598,438 | 461,191 |
| Events in quadrant B | 1,878,055 | 472,854 |
| Events in quadrant C | 2,598,974 | 466,212 |
| Events in quadrant D | 2,066,551 | 446,933 |
| Mode M0 | |||
|---|---|---|---|
| Quadrant | BADHDUFLAG | Total packets | Discarded packets |
| A | 0 | 6983 | 1 |
| B | 0 | 7766 | 1 |
| C | 0 | 9910 | 1 |
| D | 0 | 8448 | 1 |
| Mode SS | |||
|---|---|---|---|
| Quadrant | BADHDUFLAG | Total packets | Discarded packets |
| A | 0 | 66 | 0 |
| B | 0 | 66 | 0 |
| C | 0 | 66 | 0 |
| D | 0 | 66 | 0 |
| Mode M9 | |||
|---|---|---|---|
| Quadrant | BADHDUFLAG | Total packets | Discarded packets |
| A | 0 | 7 | 0 |
| B | 0 | 7 | 0 |
| C | 0 | 7 | 0 |
| D | 0 | 8 | 0 |
| Quadrant | Total seconds | Saturated seconds | Saturation percentage |
|---|---|---|---|
| A | 3360 | 3 | 0.089286% |
| B | 3360 | 54 | 1.607143% |
| C | 3360 | 218 | 6.488095% |
| D | 3360 | 100 | 2.976190% |
Noise dominated data is calculated using 1-second bins in cleaned event files. If a bin has >2000 counts, and if more than 50% of those come from <1% of pixels, then it is considered to be noise-dominated and hence unusable.
| Quadrant | # 1 sec bins | Bins with >0 counts | Bins with >2000 counts | High rate bins dominated by noise | Noise dominated (total time) | Noise dominated (detector-on time) | Marked lightcurve |
|---|---|---|---|---|---|---|---|
| A | 3360 | 3360 | 1 | 1 | 0.03% | 0.03% | 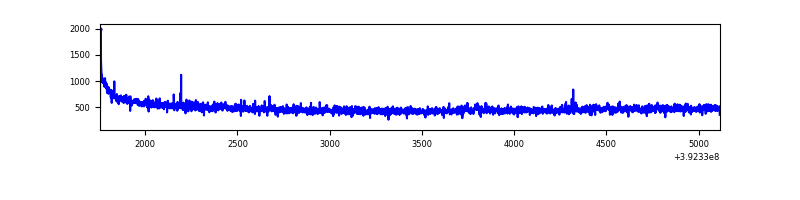 |
| B | 3360 | 3360 | 43 | 43 | 1.28% | 1.28% | 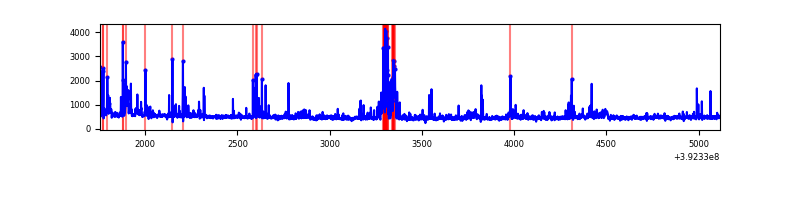 |
| C | 3360 | 3360 | 188 | 188 | 5.60% | 5.60% | 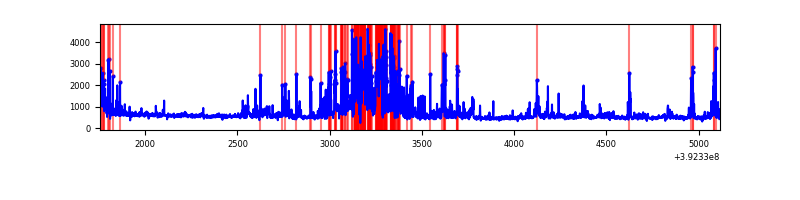 |
| D | 3360 | 3360 | 100 | 100 | 2.98% | 2.98% | 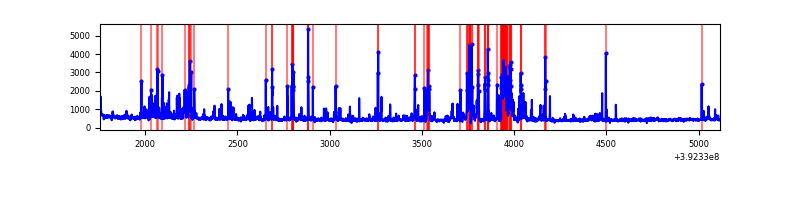 |
Top three noisy pixels from each quadrant. If the there are fewer than three noisy pixels in the level2.evt file, extra rows are filled as -1
| Pixel properties | Quadrant properties | ||||||
|---|---|---|---|---|---|---|---|
| Quadrant | DetID | PixID | Counts | Sigma | Mean | Median | Sigma |
| A | 10 | 83 | 98570 | 1272.83 | 382 | 375 | 77.1 |
| A | 8 | 144 | 20486 | 260.68 | 382 | 375 | 77.1 |
| A | 13 | 254 | 6223 | 75.8 | 382 | 375 | 77.1 |
| B | 0 | 213 | 145105 | 1984.45 | 385 | 376 | 72.9 |
| B | 5 | 172 | 81771 | 1116.05 | 385 | 376 | 72.9 |
| B | 5 | 236 | 64106 | 873.83 | 385 | 376 | 72.9 |
| C | 0 | 207 | 805861 | 9251.34 | 375 | 379 | 87.1 |
| C | 15 | 214 | 148308 | 1699.03 | 375 | 379 | 87.1 |
| C | 0 | 10 | 97507 | 1115.56 | 375 | 379 | 87.1 |
| D | 12 | 6 | 193392 | 2119.67 | 372 | 362 | 91.1 |
| D | 13 | 249 | 151275 | 1657.18 | 372 | 362 | 91.1 |
| D | 13 | 171 | 95333 | 1042.88 | 372 | 362 | 91.1 |
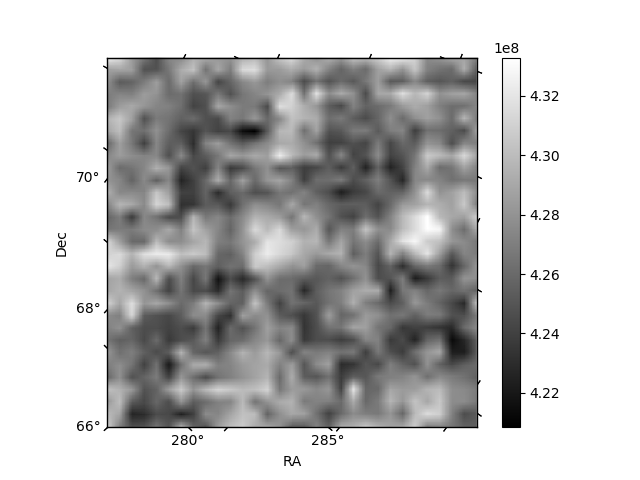
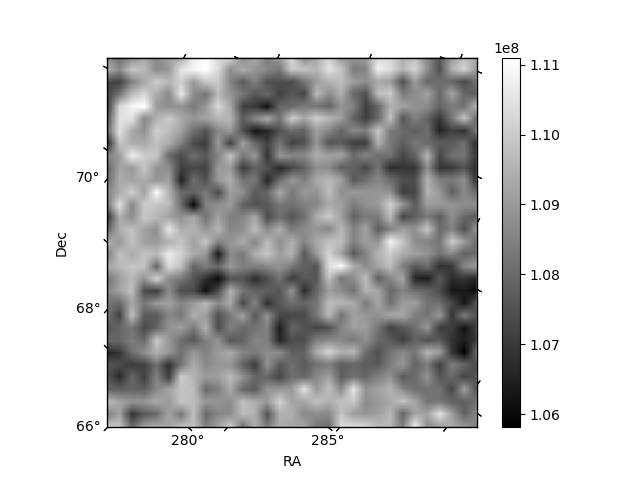
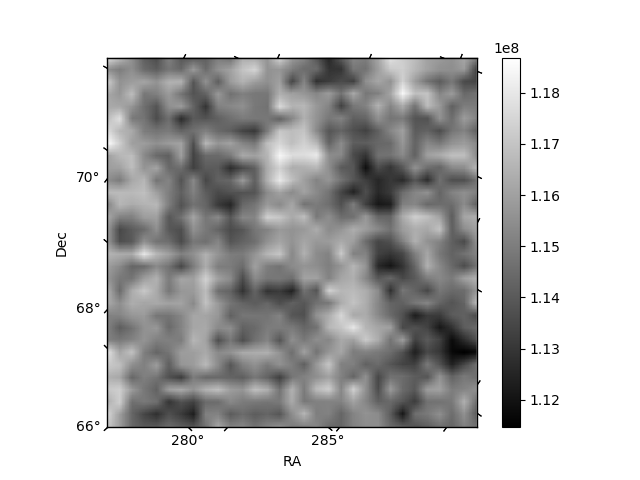
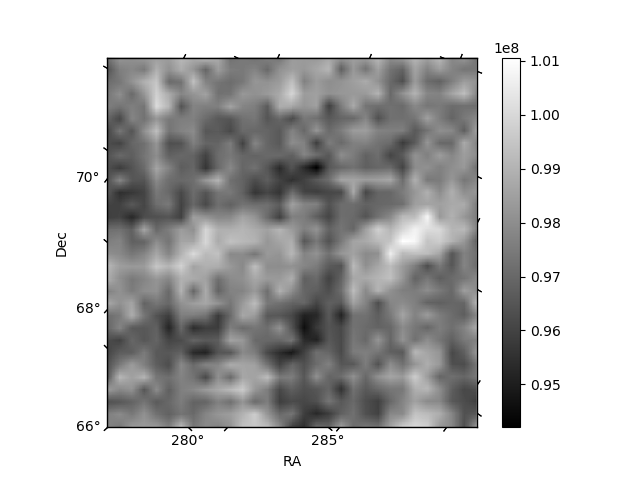
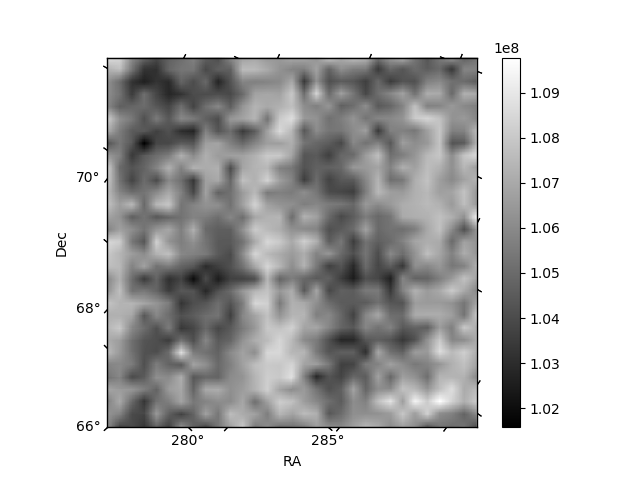
Histogram calculated using DETX and DETY for each event in the final _common_clean file
| Quadrant A | 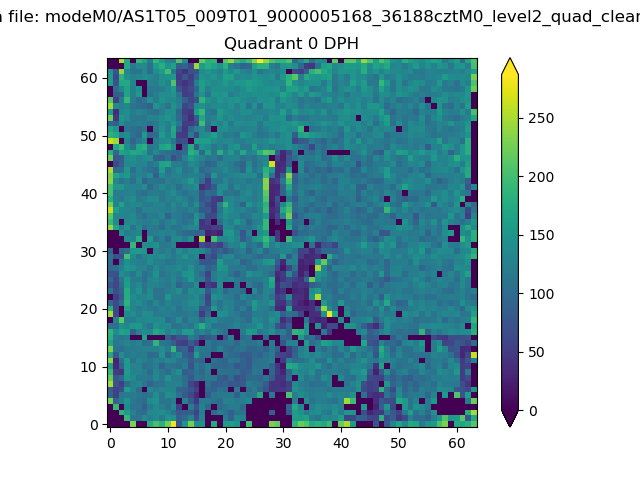 |
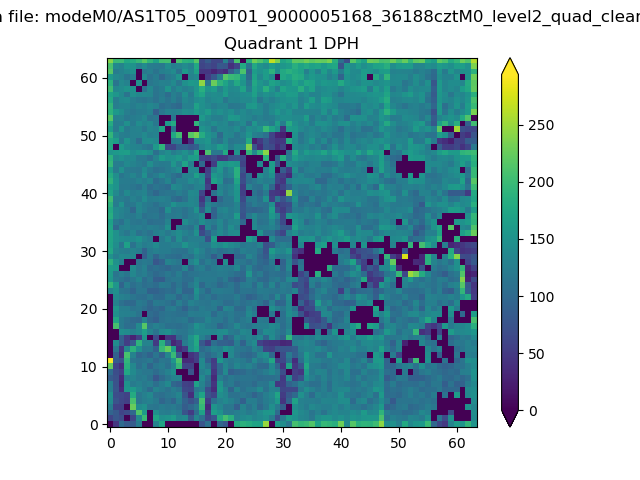 |
Quadrant B |
|---|---|---|---|
| Quadrant D | 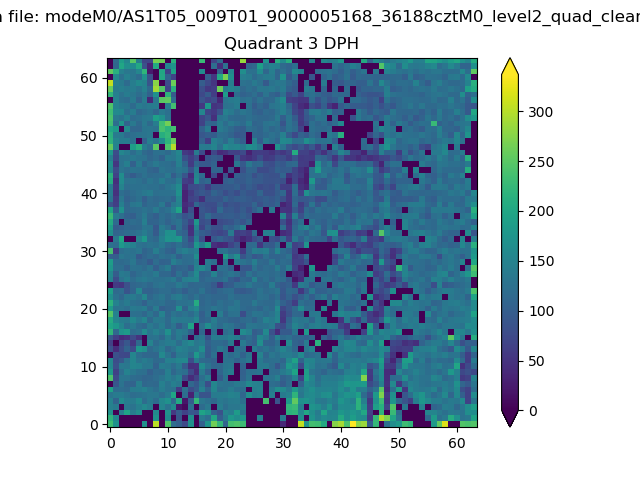 |
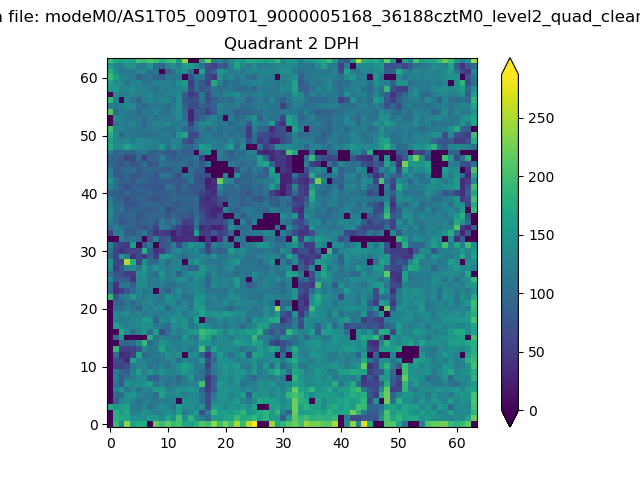 |
Quadrant C |
| Plot type | Count rate plots | Images |
|---|---|---|
| Comparison with Poisson distribution Blue bars denote a histogram of data divided into 1 sec bins. Red curve is a Poisson curve with rate = median count rate of data. |
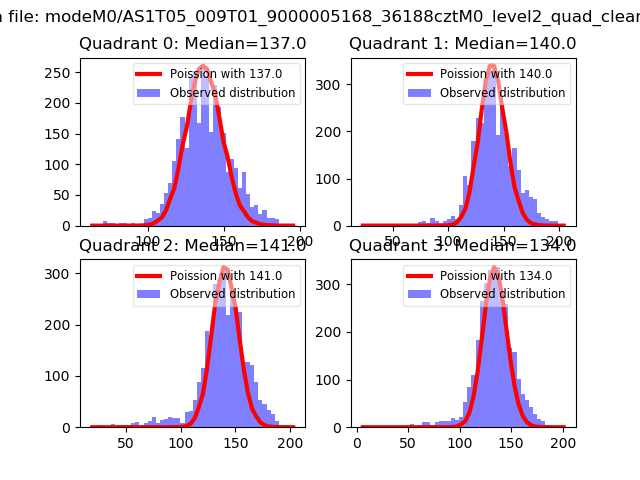 |
 |
| Quadrant-wise count rates Data is divided into 100 sec bins |
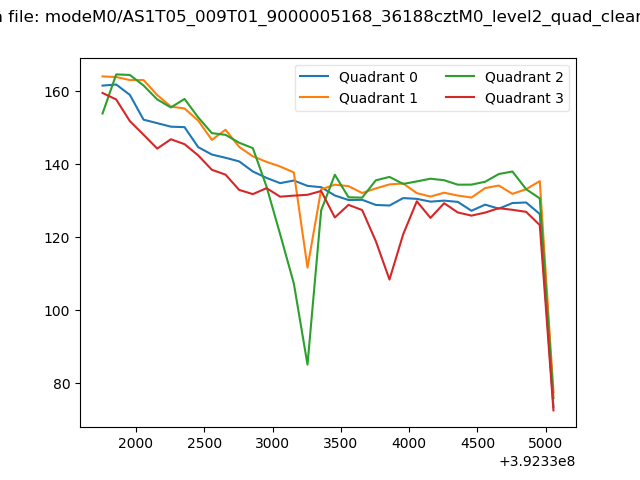 |
|
| Module-wise count rates for Quadrant A Data is divided into 100 sec bins |
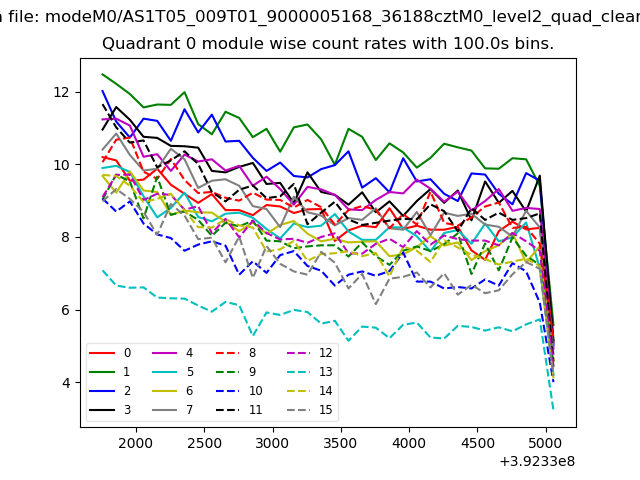 |
 |
| Module-wise count rates for Quadrant B Data is divided into 100 sec bins |
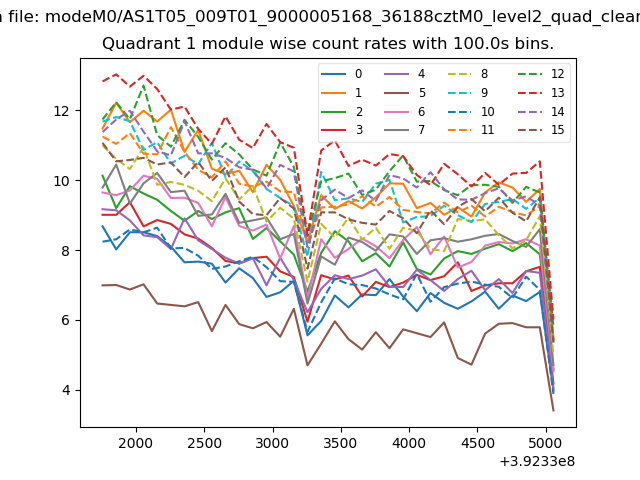 |
 |
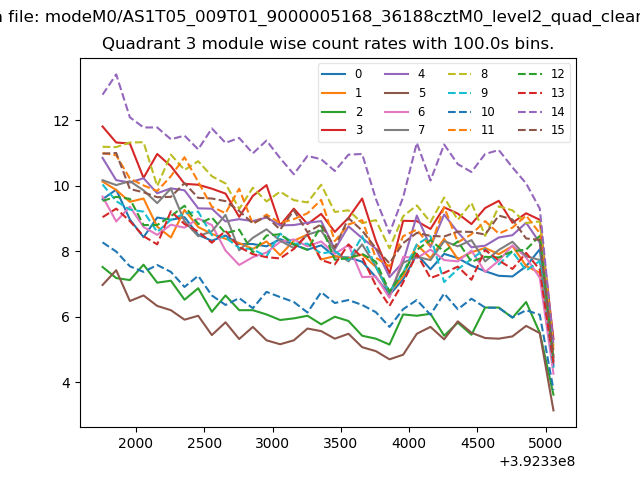
| Module-wise count rates for Quadrant C Data is divided into 100 sec bins |
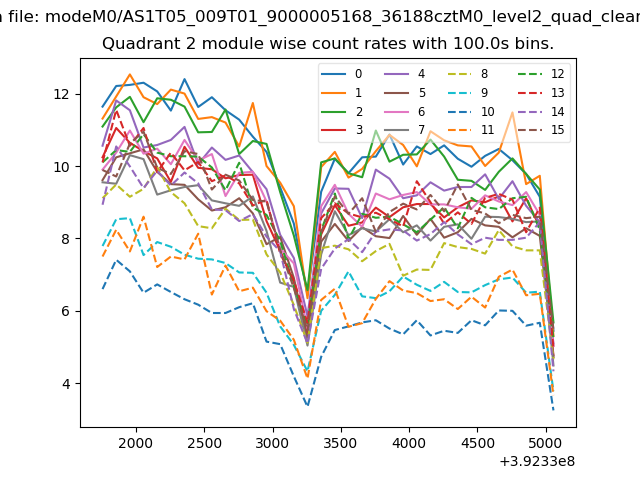 |
 |
| Module-wise count rates for Quadrant D Data is divided into 100 sec bins |
 |
 |
| Parameter | Plot |
|---|---|
| CZT HV Monitor | 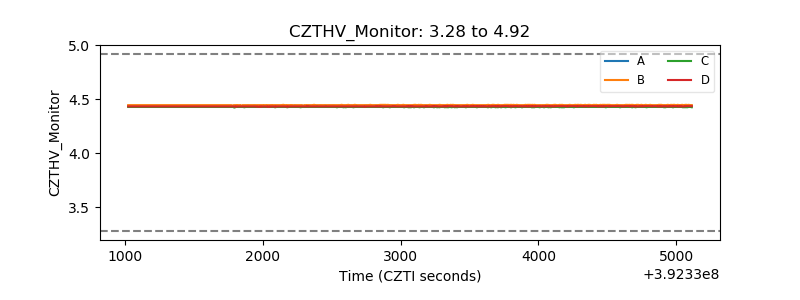 |
| D_VDD | 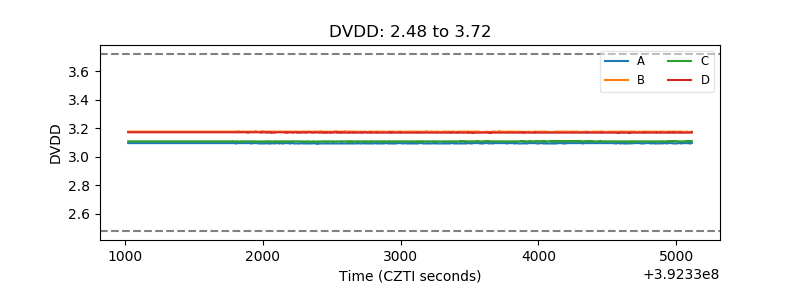 |
| Temperature 1 | 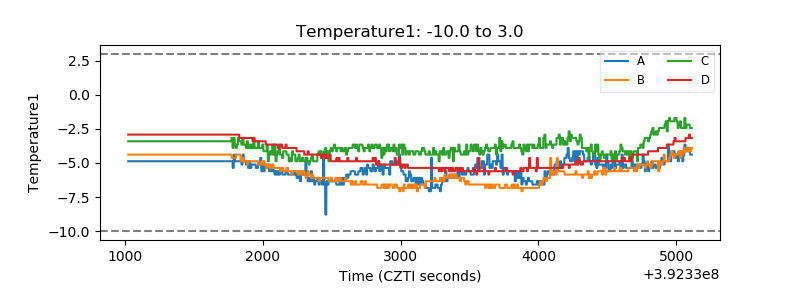 |
| Veto HV Monitor | 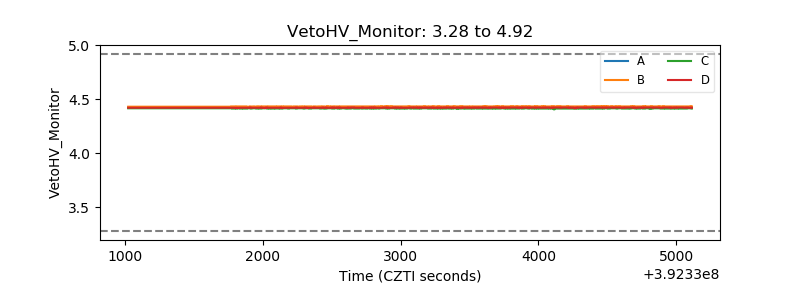 |
| Veto LLD | 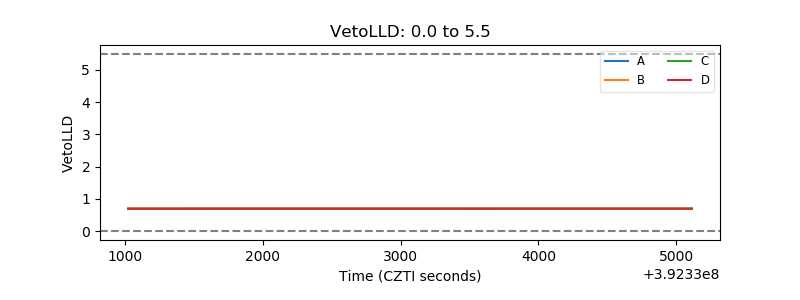 |
| Alpha Counter | 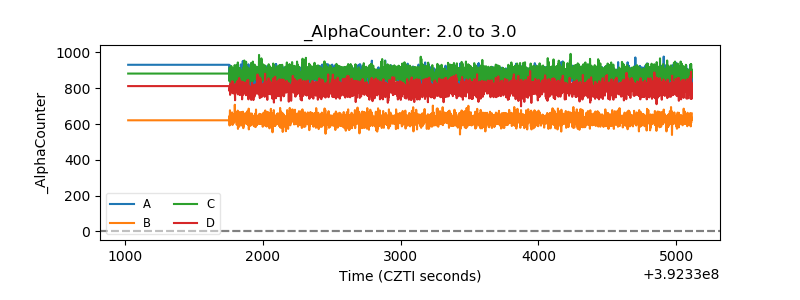 |
| _CPM_Rate | 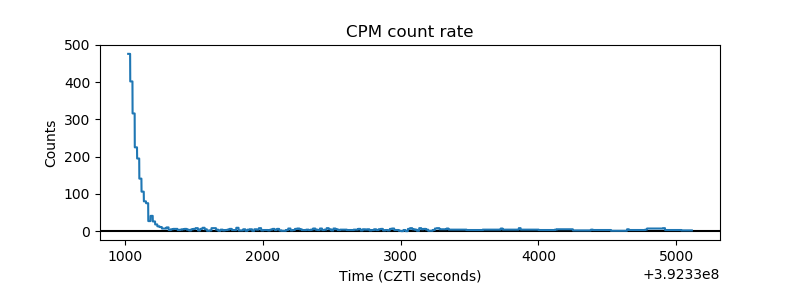 |
| CZT Counter | 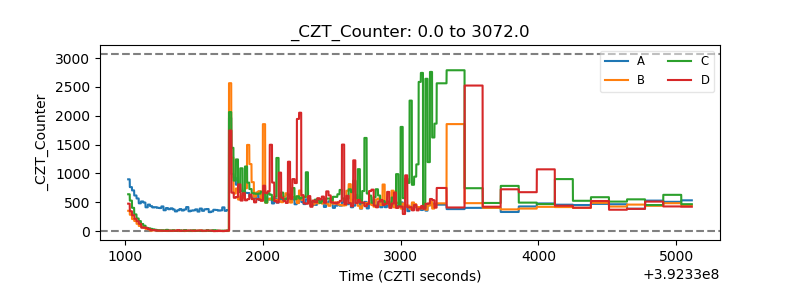 |
| +2.5 Volts monitor | 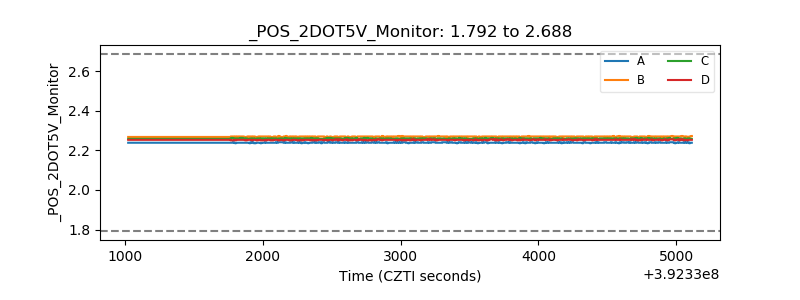 |
| +5 Volts monitor | 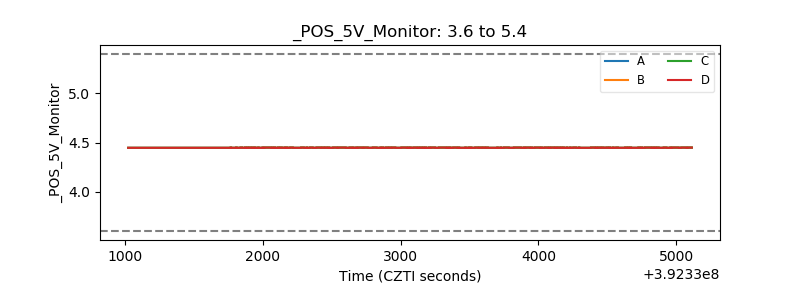 |
| _ROLL_ROT | 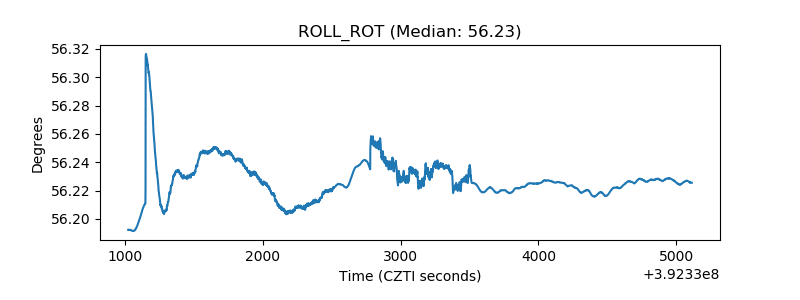 |
| _Roll_DEC | 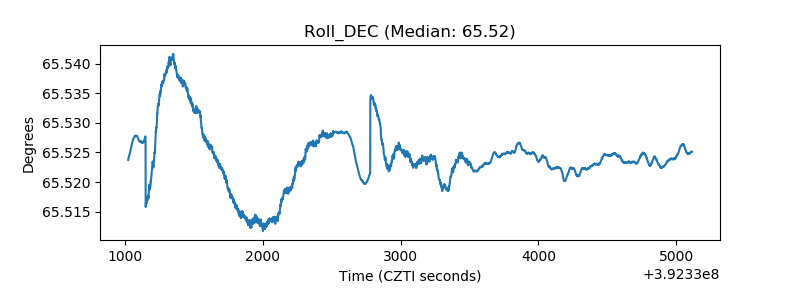 |
| _Roll_RA | 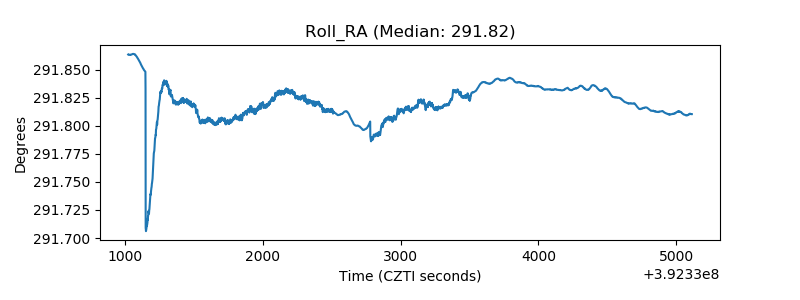 |
| Veto Counter | 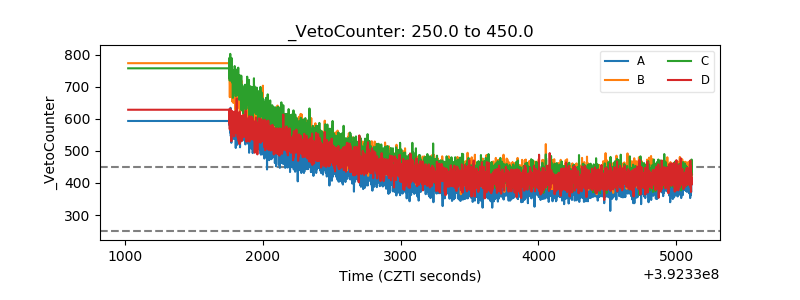 |