| Param | Original file | Final file |
|---|---|---|
| Filename | modeM0/AS1A11_097T17_9000005170_36198cztM0_level2.evt | modeM0/AS1A11_097T17_9000005170_36198cztM0_level2_quad_clean.evt |
| Size (bytes) | 561,968,640 | 83,050,560 |
| Size | 535.9 MB | 79.2 MB |
| Events in quadrant A | 2,947,953 | 552,397 |
| Events in quadrant B | 2,809,200 | 560,851 |
| Events in quadrant C | 3,148,027 | 555,127 |
| Events in quadrant D | 7,738,695 | 458,118 |
| Mode SS | |||
|---|---|---|---|
| Quadrant | BADHDUFLAG | Total packets | Discarded packets |
| A | 0 | 112 | 0 |
| B | 0 | 112 | 0 |
| C | 0 | 112 | 0 |
| D | 0 | 112 | 0 |
| Mode M0 | |||
|---|---|---|---|
| Quadrant | BADHDUFLAG | Total packets | Discarded packets |
| A | 0 | 12536 | 3 |
| B | 0 | 11952 | 2 |
| C | 0 | 12677 | 2 |
| D | 0 | 26761 | 2 |
| Mode M9 | |||
|---|---|---|---|
| Quadrant | BADHDUFLAG | Total packets | Discarded packets |
| A | 0 | 29 | 0 |
| B | 0 | 29 | 0 |
| C | 0 | 29 | 0 |
| D | 0 | 30 | 0 |
| Quadrant | Total seconds | Saturated seconds | Saturation percentage |
|---|---|---|---|
| A | 5547 | 24 | 0.432666% |
| B | 5547 | 33 | 0.594916% |
| C | 5547 | 74 | 1.334054% |
| D | 5547 | 1388 | 25.022535% |
Noise dominated data is calculated using 1-second bins in cleaned event files. If a bin has >2000 counts, and if more than 50% of those come from <1% of pixels, then it is considered to be noise-dominated and hence unusable.
| Quadrant | # 1 sec bins | Bins with >0 counts | Bins with >2000 counts | High rate bins dominated by noise | Noise dominated (total time) | Noise dominated (detector-on time) | Marked lightcurve |
|---|---|---|---|---|---|---|---|
| A | 7190 | 5548 | 0 | 0 | 0.00% | 0.00% | 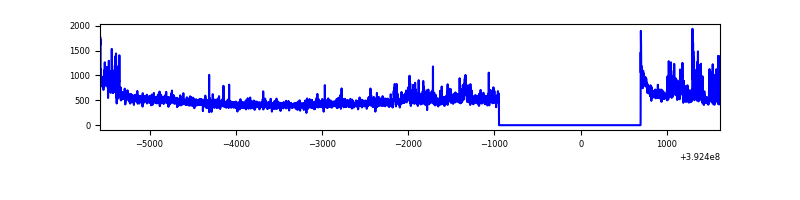 |
| B | 7190 | 5548 | 15 | 15 | 0.21% | 0.27% | 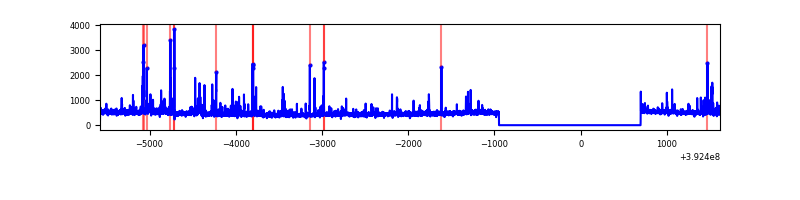 |
| C | 7190 | 5548 | 42 | 42 | 0.58% | 0.76% | 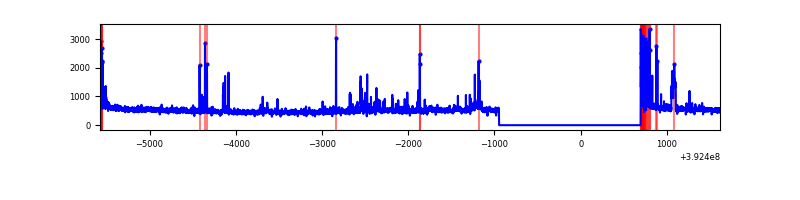 |
| D | 7190 | 5548 | 1463 | 1463 | 20.35% | 26.37% | 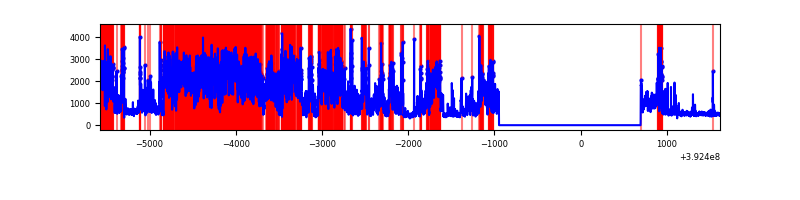 |
Top three noisy pixels from each quadrant. If the there are fewer than three noisy pixels in the level2.evt file, extra rows are filled as -1
| Pixel properties | Quadrant properties | ||||||
|---|---|---|---|---|---|---|---|
| Quadrant | DetID | PixID | Counts | Sigma | Mean | Median | Sigma |
| A | 15 | 223 | 272900 | 2111.51 | 637 | 623 | 128.9 |
| A | 10 | 83 | 179563 | 1387.68 | 637 | 623 | 128.9 |
| A | 8 | 144 | 22859 | 172.44 | 637 | 623 | 128.9 |
| B | 5 | 172 | 225281 | 1846.47 | 634 | 617 | 121.7 |
| B | 4 | 171 | 43720 | 354.26 | 634 | 617 | 121.7 |
| B | 12 | 111 | 15344 | 121.04 | 634 | 617 | 121.7 |
| C | 15 | 214 | 251765 | 1708.84 | 627 | 633 | 147.0 |
| C | 0 | 10 | 172030 | 1166.28 | 627 | 633 | 147.0 |
| C | 15 | 208 | 136487 | 924.43 | 627 | 633 | 147.0 |
| D | 12 | 227 | 4391119 | 30712.64 | 578 | 560 | 143.0 |
| D | 12 | 235 | 430900 | 3010.29 | 578 | 560 | 143.0 |
| D | 12 | 6 | 275379 | 1922.4 | 578 | 560 | 143.0 |
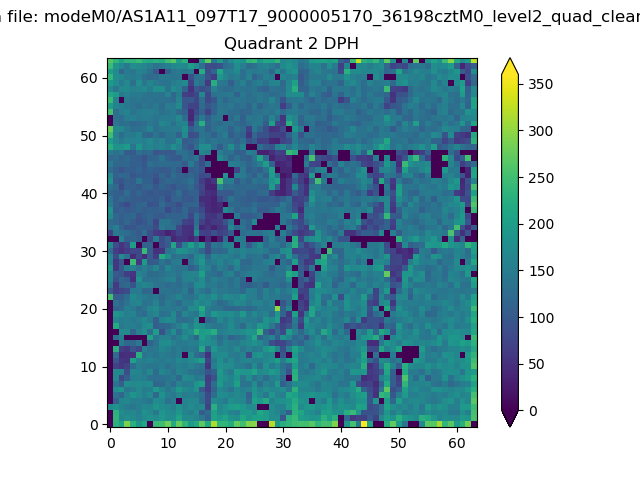
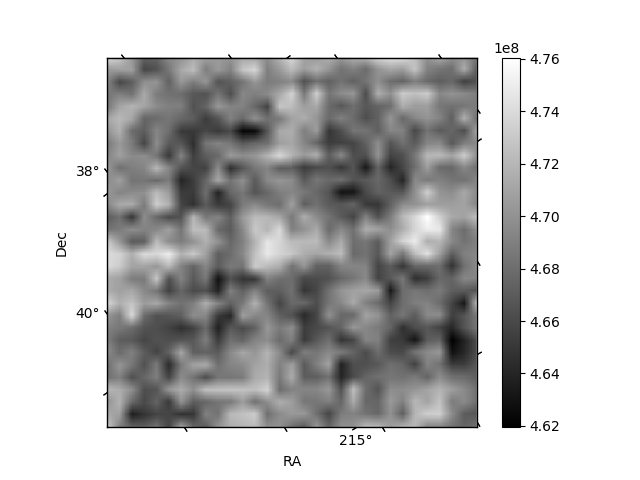
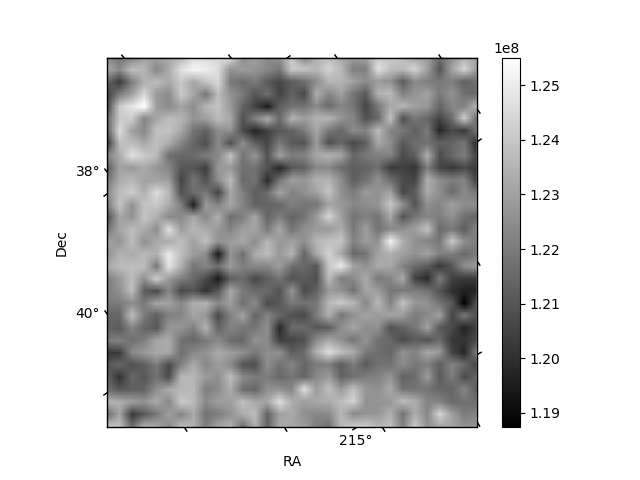
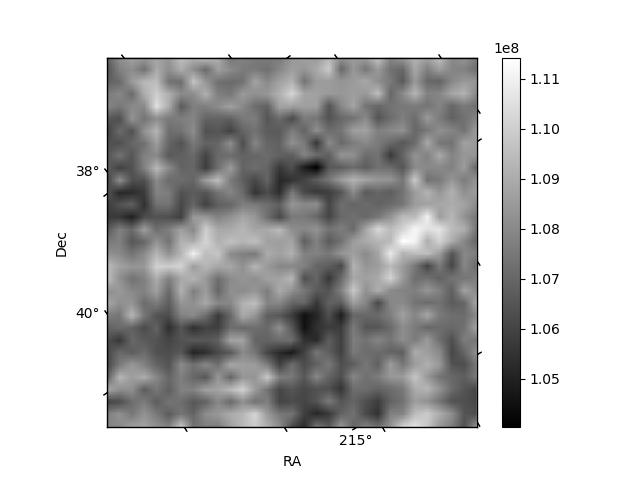
Histogram calculated using DETX and DETY for each event in the final _common_clean file
| Quadrant A | 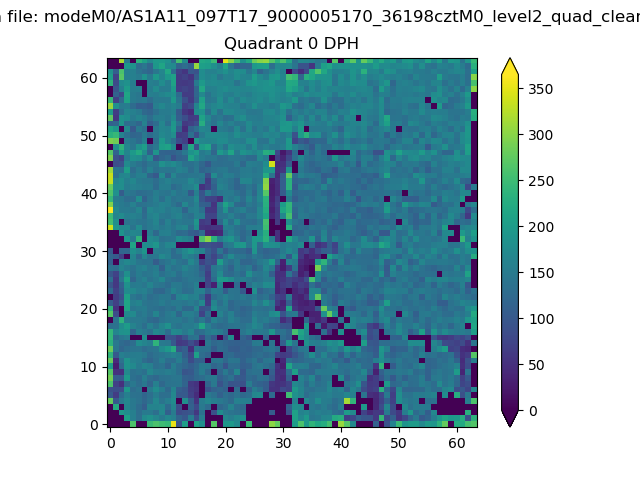 |
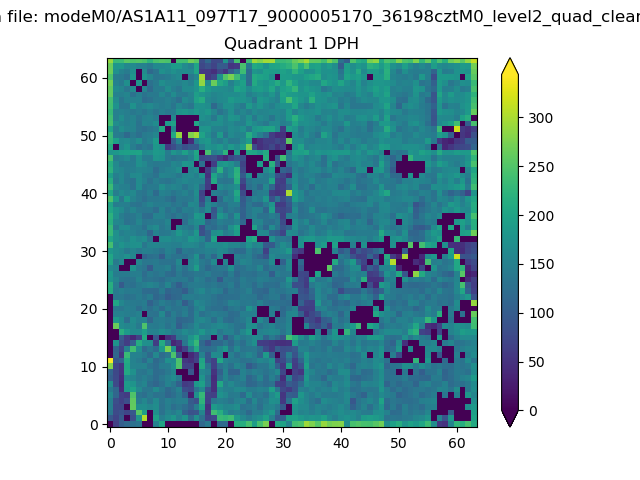 |
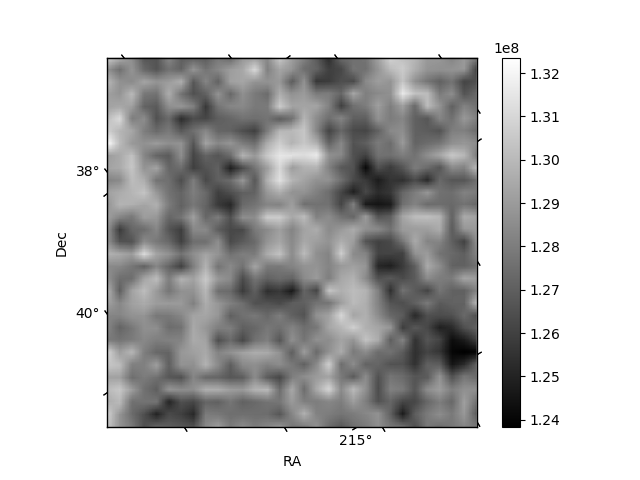
Quadrant B |
|---|---|---|---|
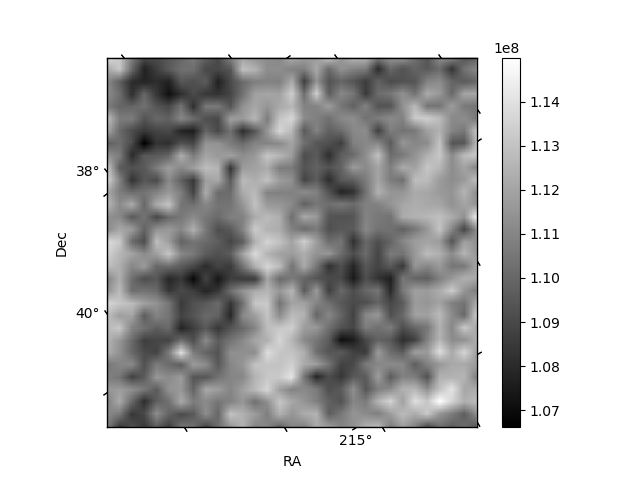
| Quadrant D | 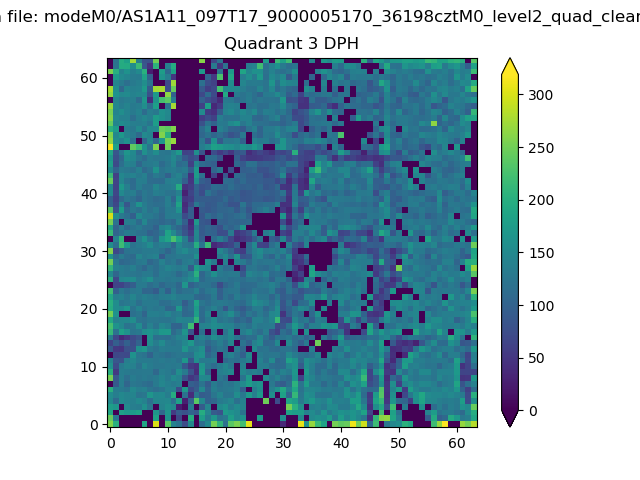 |
 |
Quadrant C |
| Plot type | Count rate plots | Images |
|---|---|---|
| Comparison with Poisson distribution Blue bars denote a histogram of data divided into 1 sec bins. Red curve is a Poisson curve with rate = median count rate of data. |
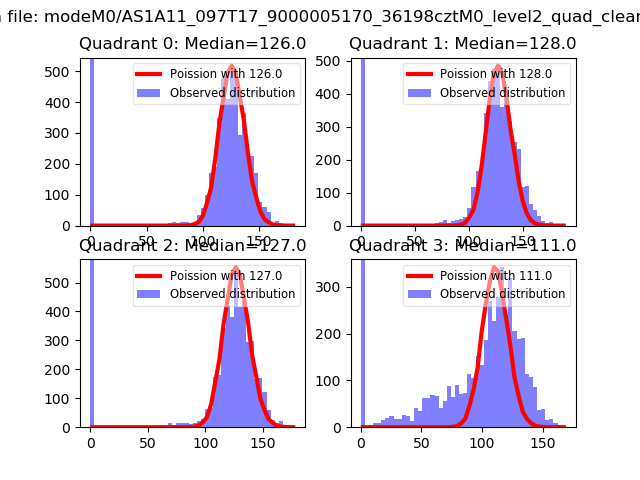 |
 |
| Quadrant-wise count rates Data is divided into 100 sec bins |
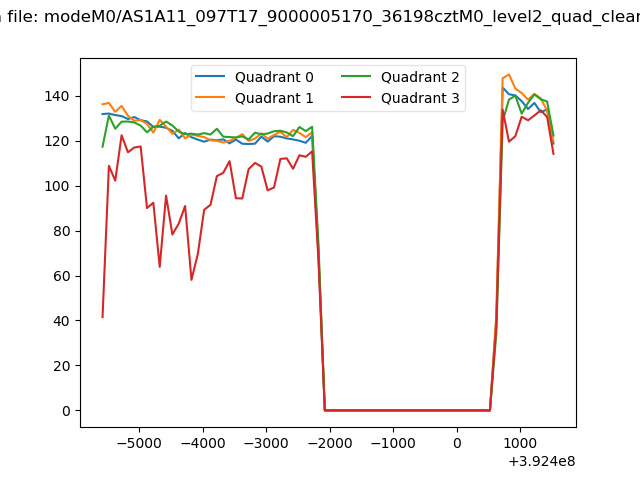 |
|
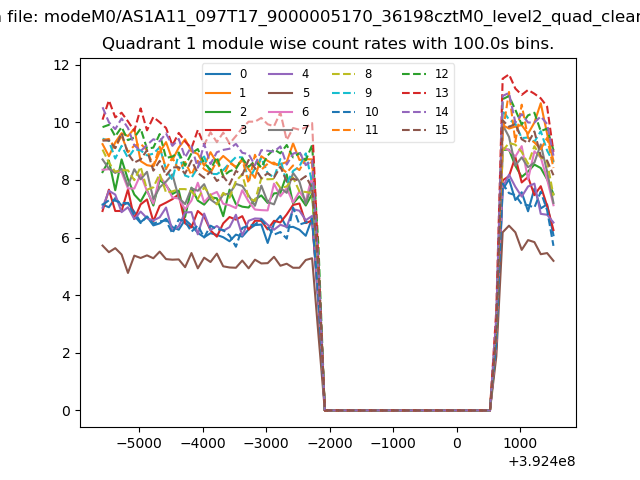
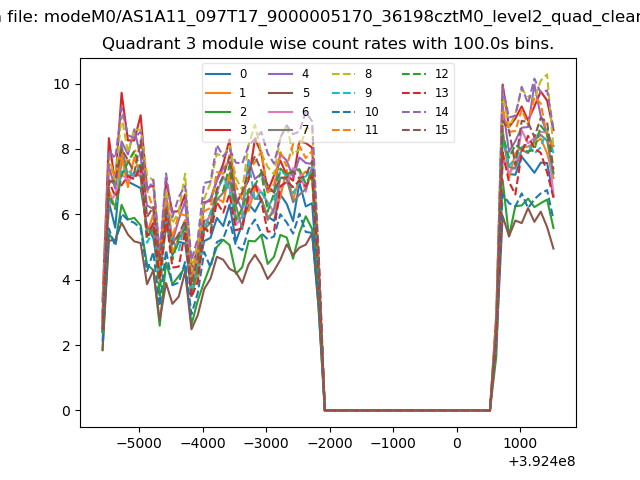
| Module-wise count rates for Quadrant A Data is divided into 100 sec bins |
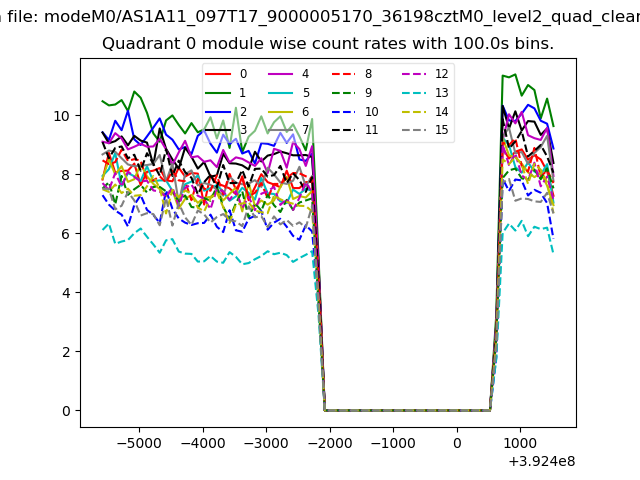 |
 |
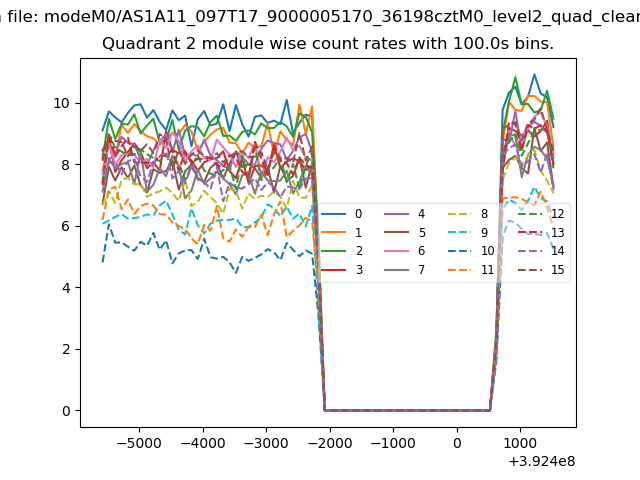
| Module-wise count rates for Quadrant B Data is divided into 100 sec bins |
 |
 |
| Module-wise count rates for Quadrant C Data is divided into 100 sec bins |
 |
 |
| Module-wise count rates for Quadrant D Data is divided into 100 sec bins |
 |
 |
| Parameter | Plot |
|---|---|
| CZT HV Monitor |  |
| D_VDD | 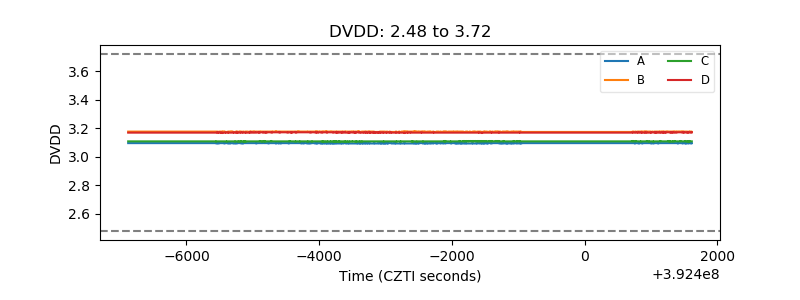 |
| Temperature 1 | 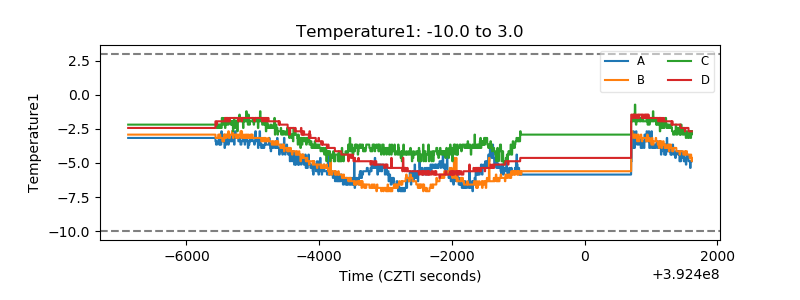 |
| Veto HV Monitor | 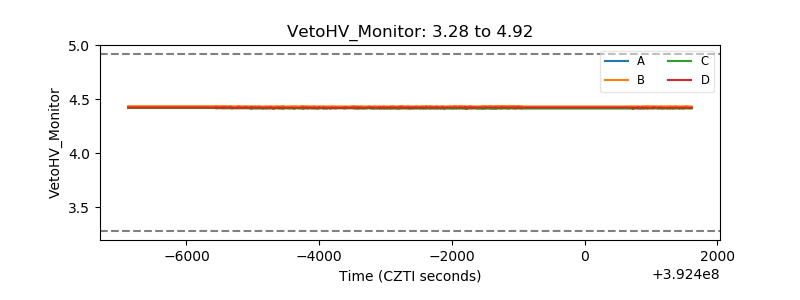 |
| Veto LLD | 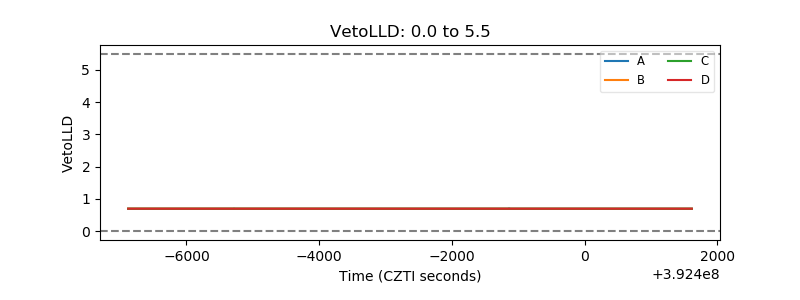 |
| Alpha Counter | 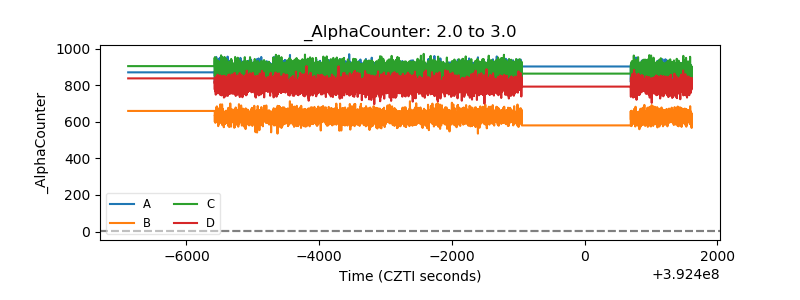 |
| _CPM_Rate | 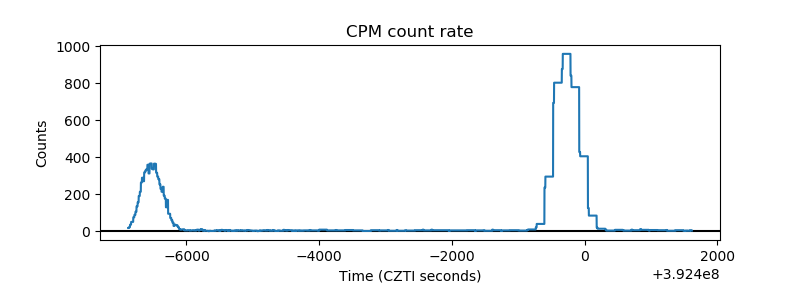 |
| CZT Counter | 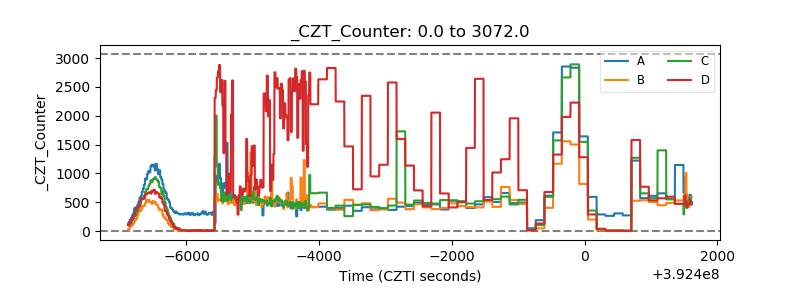 |
| +2.5 Volts monitor | 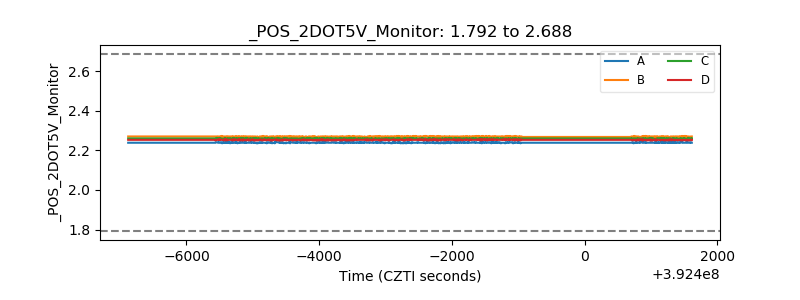 |
| +5 Volts monitor | 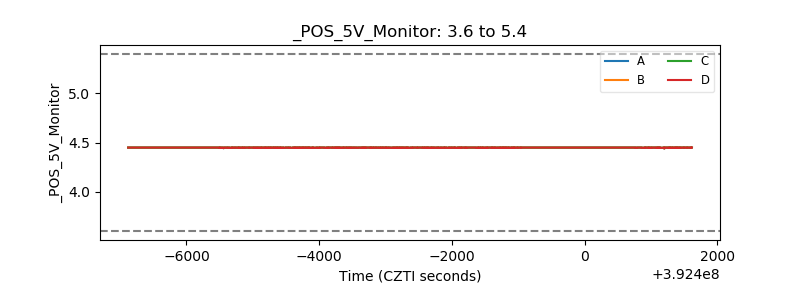 |
| _ROLL_ROT | 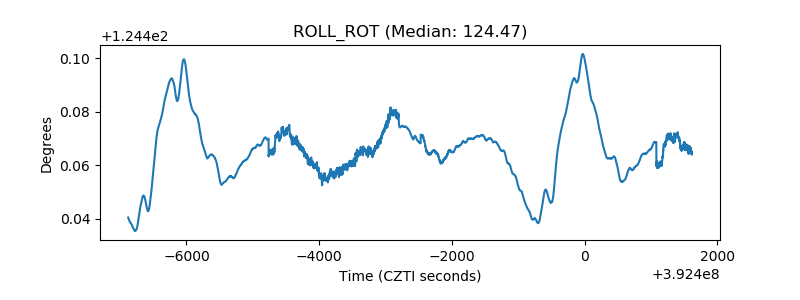 |
| _Roll_DEC | 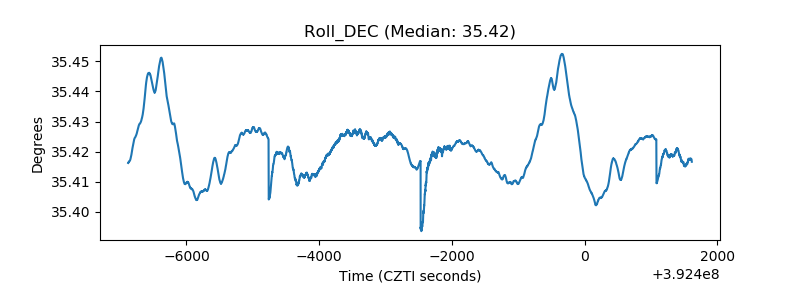 |
| _Roll_RA | 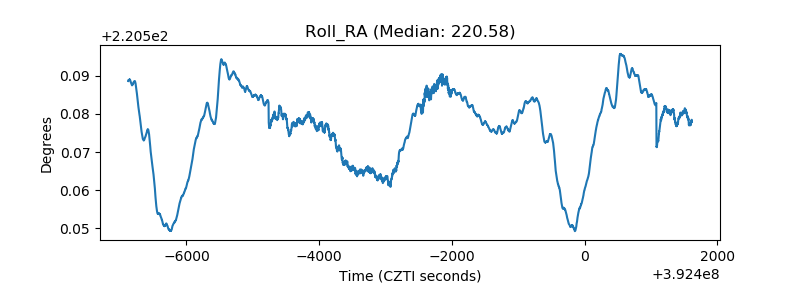 |
| Veto Counter | 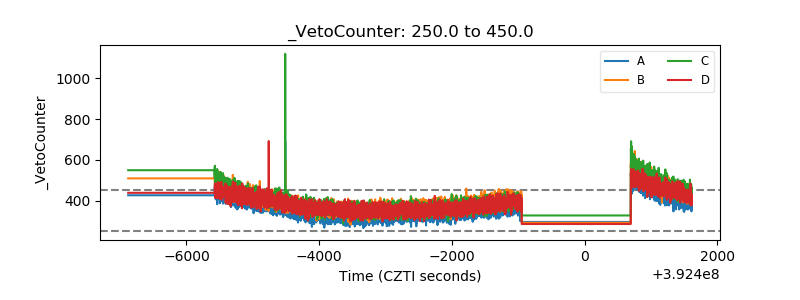 |