| Param | Original file | Final file |
|---|---|---|
| Filename | modeM0/AS1A11_097T17_9000005170_36197cztM0_level2.evt | modeM0/AS1A11_097T17_9000005170_36197cztM0_level2_quad_clean.evt |
| Size (bytes) | 1,646,801,280 | 233,913,600 |
| Size | 1.5 GB | 223.1 MB |
| Events in quadrant A | 7,781,238 | 1,579,957 |
| Events in quadrant B | 8,889,468 | 1,590,203 |
| Events in quadrant C | 19,356,841 | 1,337,119 |
| Events in quadrant D | 12,754,195 | 1,457,698 |
| Mode SS | |||
|---|---|---|---|
| Quadrant | BADHDUFLAG | Total packets | Discarded packets |
| A | 0 | 332 | 0 |
| B | 0 | 332 | 0 |
| C | 0 | 332 | 0 |
| D | 0 | 332 | 0 |
| Mode M0 | |||
|---|---|---|---|
| Quadrant | BADHDUFLAG | Total packets | Discarded packets |
| A | 0 | 33561 | 5 |
| B | 0 | 36827 | 4 |
| C | 0 | 68086 | 4 |
| D | 0 | 48843 | 4 |
| Mode M9 | |||
|---|---|---|---|
| Quadrant | BADHDUFLAG | Total packets | Discarded packets |
| A | 0 | 55 | 0 |
| B | 0 | 55 | 0 |
| C | 0 | 55 | 0 |
| D | 0 | 55 | 0 |
| Quadrant | Total seconds | Saturated seconds | Saturation percentage |
|---|---|---|---|
| A | 16212 | 31 | 0.191216% |
| B | 16212 | 305 | 1.881322% |
| C | 16212 | 4111 | 25.357760% |
| D | 16212 | 1127 | 6.951641% |
Noise dominated data is calculated using 1-second bins in cleaned event files. If a bin has >2000 counts, and if more than 50% of those come from <1% of pixels, then it is considered to be noise-dominated and hence unusable.
| Quadrant | # 1 sec bins | Bins with >0 counts | Bins with >2000 counts | High rate bins dominated by noise | Noise dominated (total time) | Noise dominated (detector-on time) | Marked lightcurve |
|---|---|---|---|---|---|---|---|
| A | 21734 | 16216 | 4 | 4 | 0.02% | 0.02% | 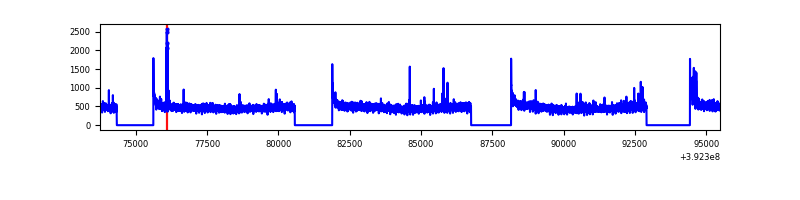 |
| B | 21734 | 16216 | 189 | 189 | 0.87% | 1.17% | 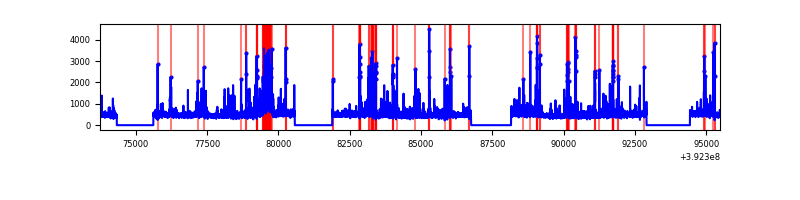 |
| C | 21734 | 16215 | 3720 | 3720 | 17.12% | 22.94% | 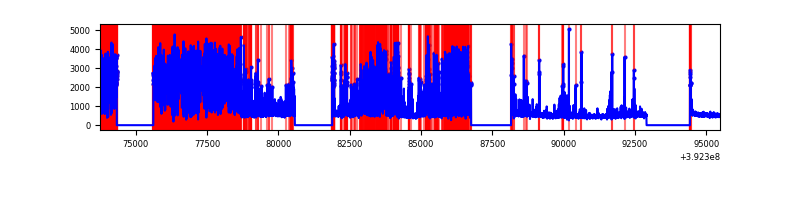 |
| D | 21734 | 16216 | 1038 | 1038 | 4.78% | 6.40% | 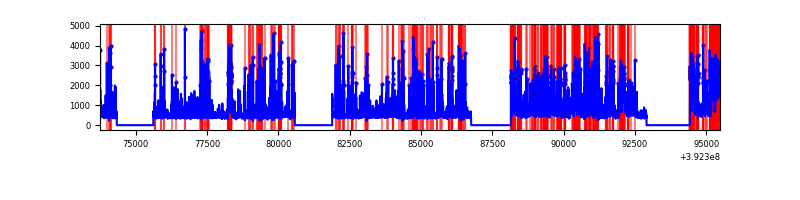 |
Top three noisy pixels from each quadrant. If the there are fewer than three noisy pixels in the level2.evt file, extra rows are filled as -1
| Pixel properties | Quadrant properties | ||||||
|---|---|---|---|---|---|---|---|
| Quadrant | DetID | PixID | Counts | Sigma | Mean | Median | Sigma |
| A | 10 | 83 | 432956 | 1171.26 | 1852 | 1813 | 368.1 |
| A | 15 | 223 | 82227 | 218.46 | 1852 | 1813 | 368.1 |
| A | 9 | 143 | 45250 | 118.0 | 1852 | 1813 | 368.1 |
| B | 5 | 172 | 733034 | 2071.41 | 1838 | 1785 | 353.0 |
| B | 4 | 171 | 656126 | 1853.55 | 1838 | 1785 | 353.0 |
| B | 5 | 236 | 104871 | 292.01 | 1838 | 1785 | 353.0 |
| C | 4 | 254 | 11679055 | 32748.7 | 1550 | 1562 | 356.6 |
| C | 15 | 214 | 620403 | 1735.5 | 1550 | 1562 | 356.6 |
| C | 15 | 208 | 476538 | 1332.04 | 1550 | 1562 | 356.6 |
| D | 12 | 227 | 2454733 | 5716.14 | 1767 | 1719 | 429.1 |
| D | 12 | 6 | 1110877 | 2584.62 | 1767 | 1719 | 429.1 |
| D | 12 | 233 | 569745 | 1323.64 | 1767 | 1719 | 429.1 |
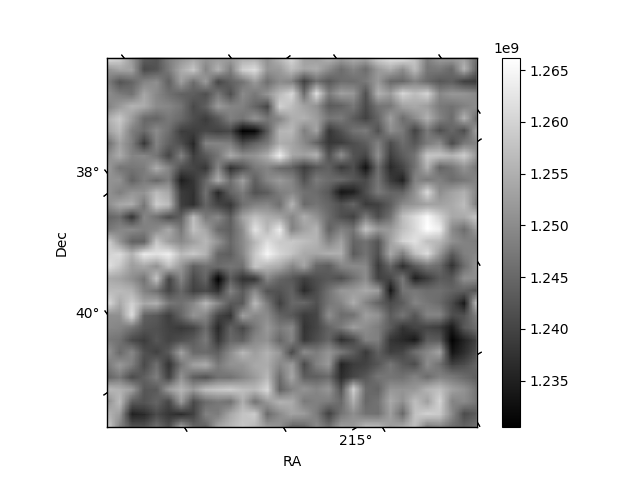
Histogram calculated using DETX and DETY for each event in the final _common_clean file
| Quadrant A | 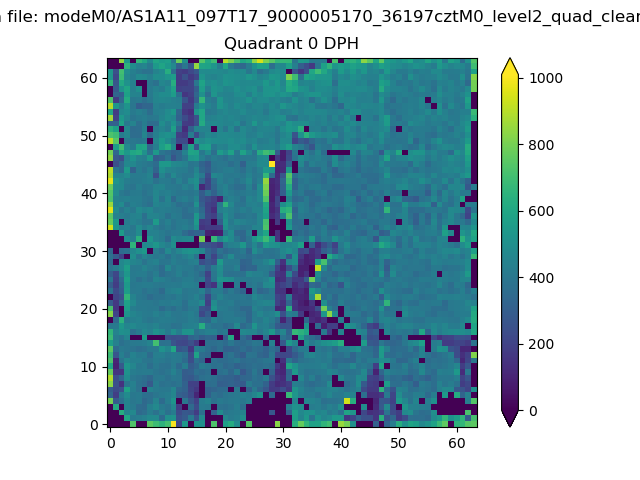 |
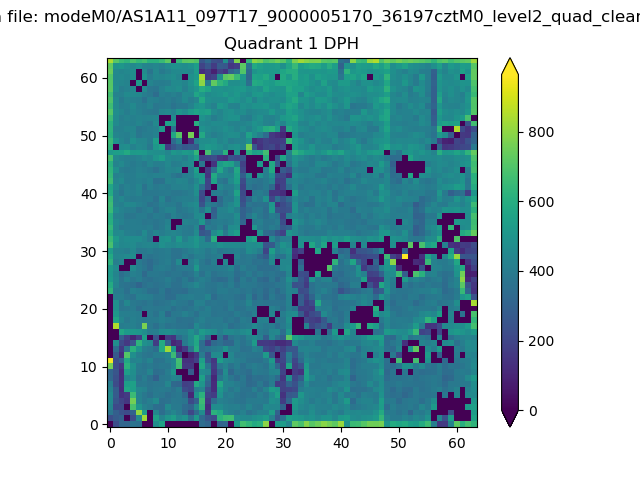 |
Quadrant B |
|---|---|---|---|
| Quadrant D | 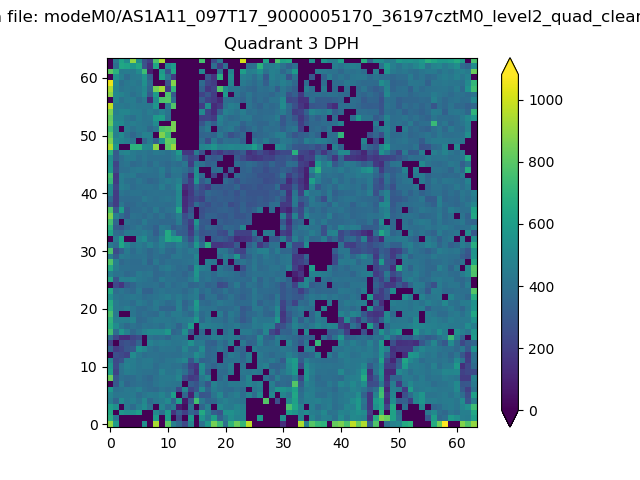 |
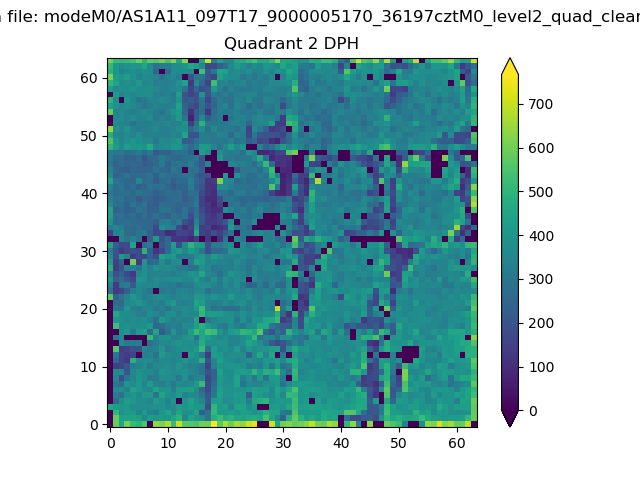 |
Quadrant C |
| Plot type | Count rate plots | Images |
|---|---|---|
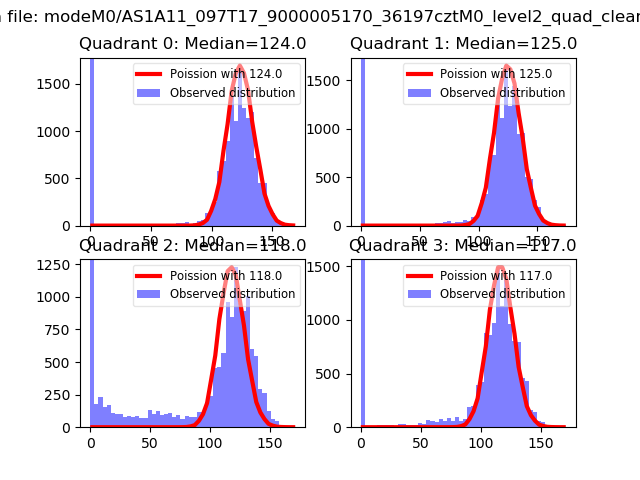
| Comparison with Poisson distribution Blue bars denote a histogram of data divided into 1 sec bins. Red curve is a Poisson curve with rate = median count rate of data. |
 |
 |
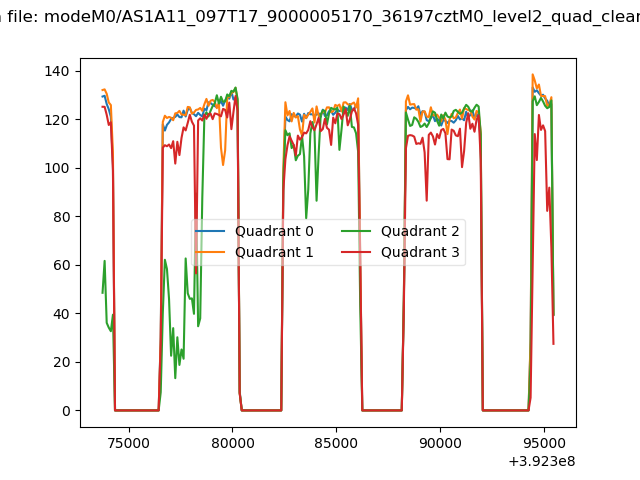
| Quadrant-wise count rates Data is divided into 100 sec bins |
 |
|
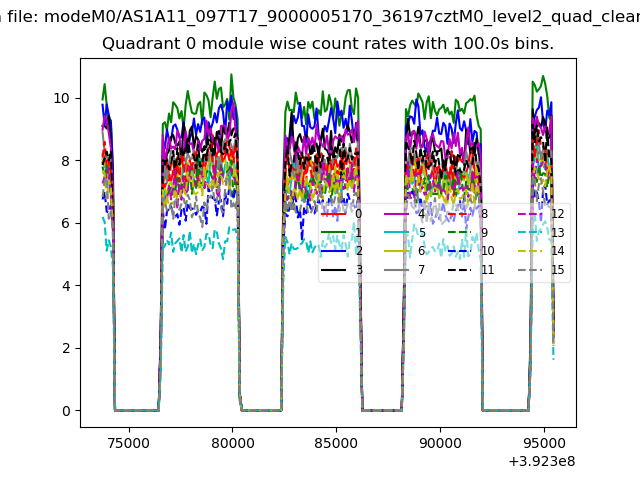
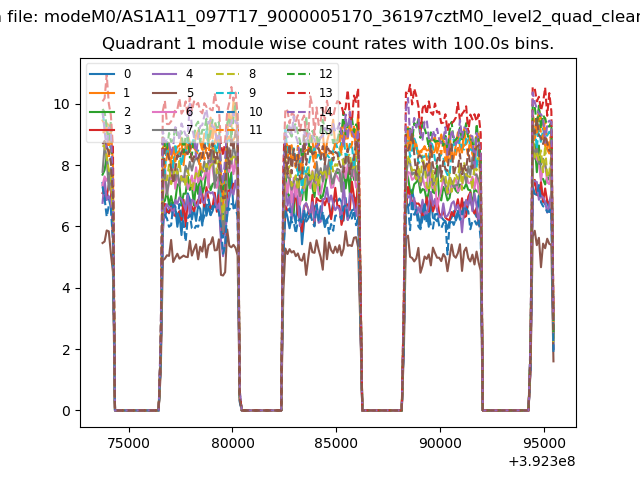
| Module-wise count rates for Quadrant A Data is divided into 100 sec bins |
 |
 |
| Module-wise count rates for Quadrant B Data is divided into 100 sec bins |
 |
 |
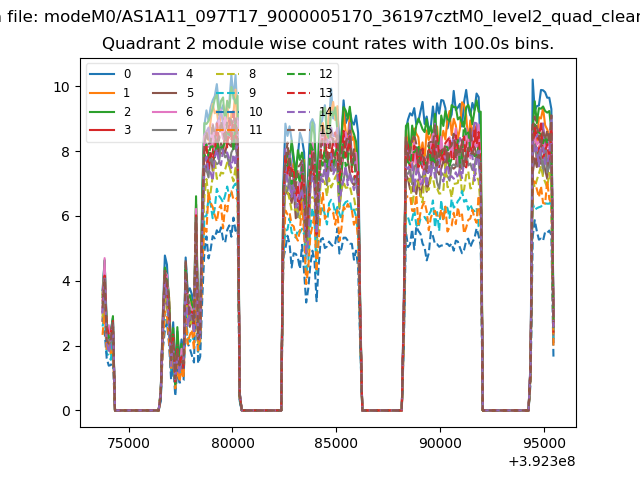
| Module-wise count rates for Quadrant C Data is divided into 100 sec bins |
 |
 |
| Module-wise count rates for Quadrant D Data is divided into 100 sec bins |
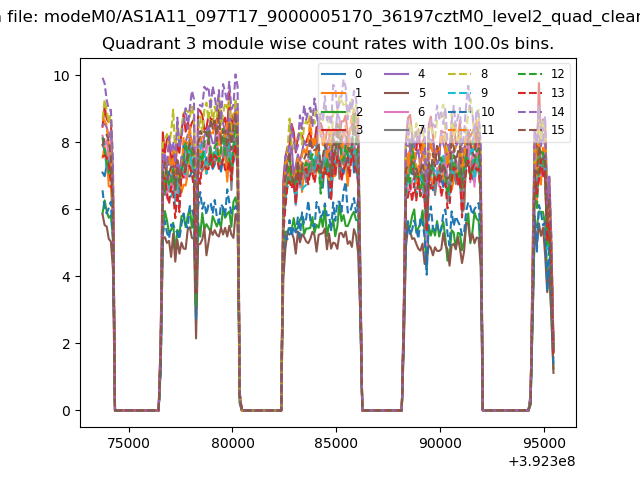 |
 |
| Parameter | Plot |
|---|---|
| CZT HV Monitor | 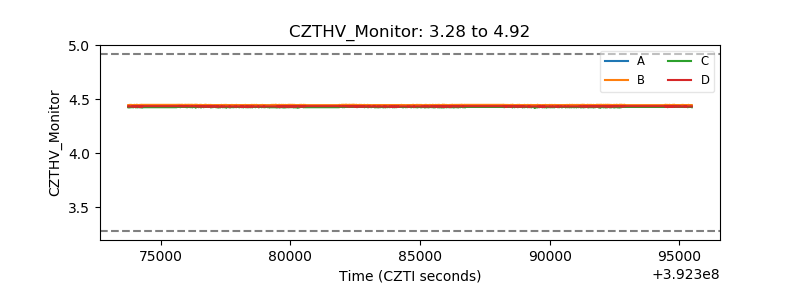 |
| D_VDD | 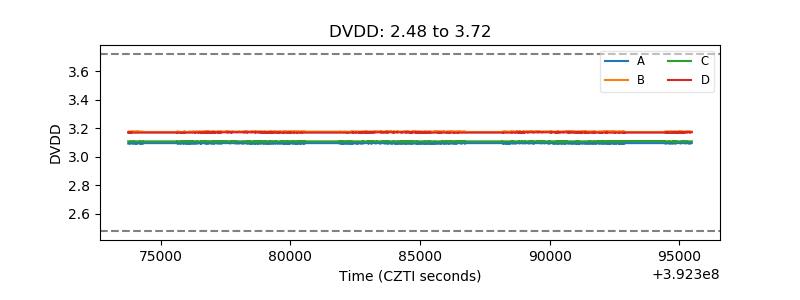 |
| Temperature 1 | 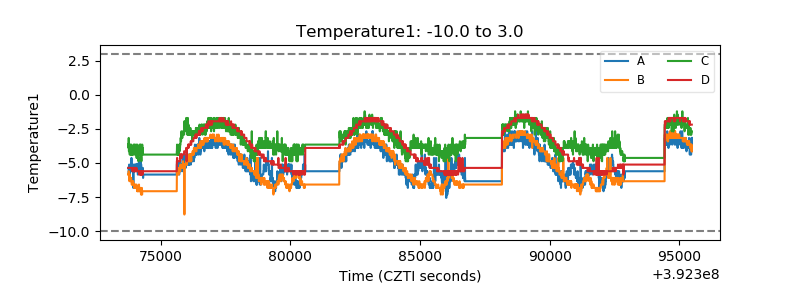 |
| Veto HV Monitor | 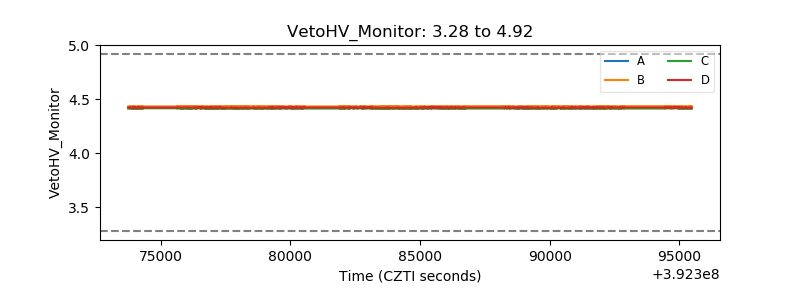 |
| Veto LLD | 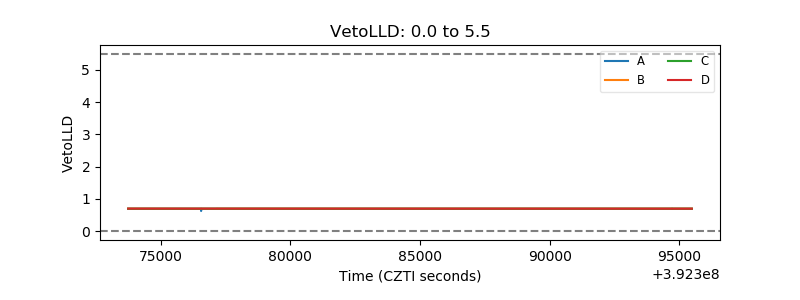 |
| Alpha Counter | 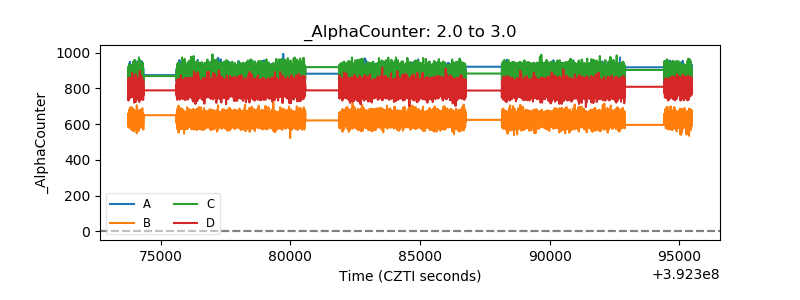 |
| _CPM_Rate | 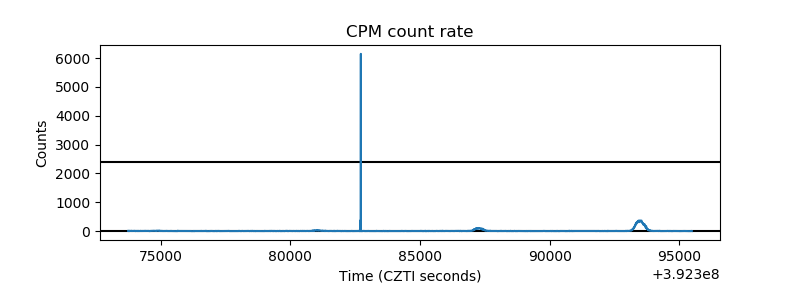 |
| CZT Counter | 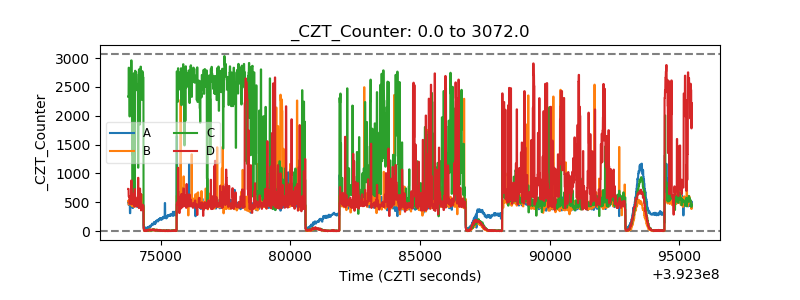 |
| +2.5 Volts monitor |  |
| +5 Volts monitor | 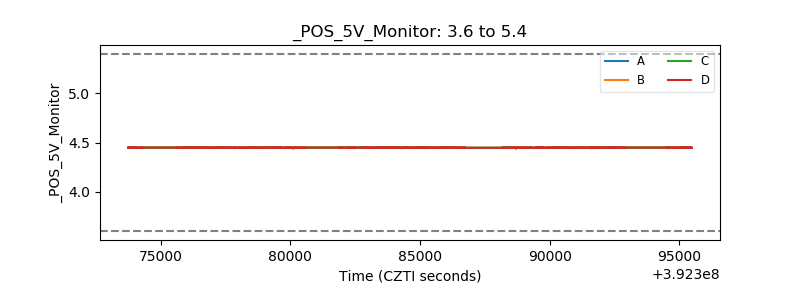 |
| _ROLL_ROT | 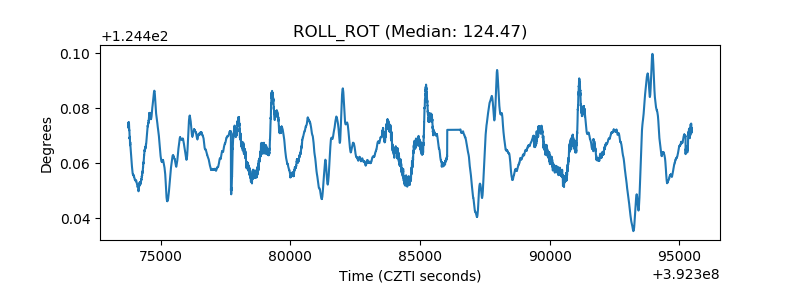 |
| _Roll_DEC | 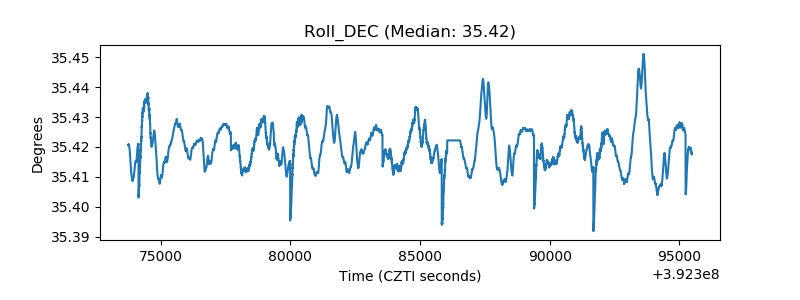 |
| _Roll_RA | 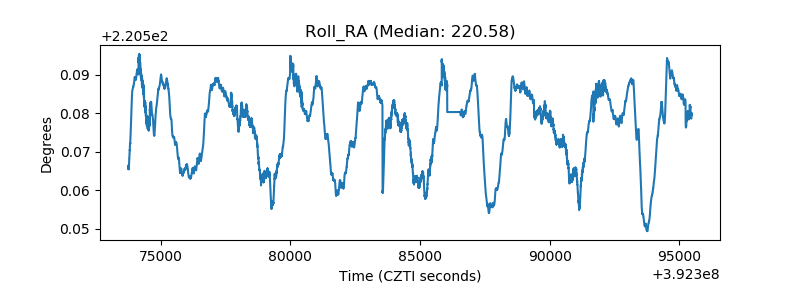 |
| Veto Counter | 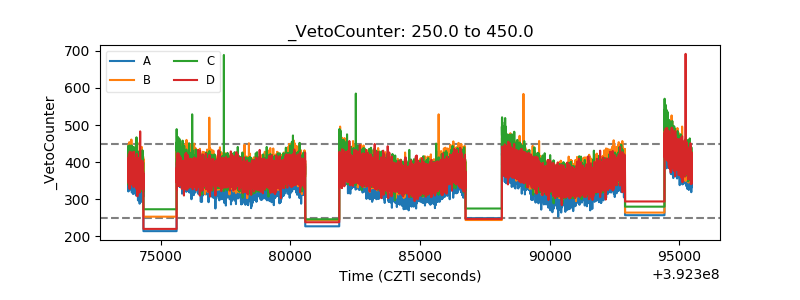 |