| Param | Original file | Final file |
|---|---|---|
| Filename | modeM0/AS1A11_097T17_9000005170_36194cztM0_level2.evt | modeM0/AS1A11_097T17_9000005170_36194cztM0_level2_quad_clean.evt |
| Size (bytes) | 800,412,480 | 71,634,240 |
| Size | 763.3 MB | 68.3 MB |
| Events in quadrant A | 3,046,598 | 480,445 |
| Events in quadrant B | 3,056,904 | 489,220 |
| Events in quadrant C | 13,375,492 | 313,543 |
| Events in quadrant D | 4,335,095 | 444,382 |
| Mode SS | |||
|---|---|---|---|
| Quadrant | BADHDUFLAG | Total packets | Discarded packets |
| A | 0 | 132 | 0 |
| B | 0 | 132 | 0 |
| C | 0 | 132 | 0 |
| D | 0 | 132 | 0 |
| Mode M0 | |||
|---|---|---|---|
| Quadrant | BADHDUFLAG | Total packets | Discarded packets |
| A | 0 | 13048 | 3 |
| B | 0 | 13186 | 2 |
| C | 0 | 44046 | 2 |
| D | 0 | 17097 | 2 |
| Mode M9 | |||
|---|---|---|---|
| Quadrant | BADHDUFLAG | Total packets | Discarded packets |
| A | 0 | 26 | 0 |
| B | 0 | 26 | 0 |
| C | 0 | 26 | 0 |
| D | 0 | 26 | 0 |
| Quadrant | Total seconds | Saturated seconds | Saturation percentage |
|---|---|---|---|
| A | 6302 | 22 | 0.349096% |
| B | 6302 | 20 | 0.317360% |
| C | 6302 | 4260 | 67.597588% |
| D | 6302 | 339 | 5.379245% |
Noise dominated data is calculated using 1-second bins in cleaned event files. If a bin has >2000 counts, and if more than 50% of those come from <1% of pixels, then it is considered to be noise-dominated and hence unusable.
| Quadrant | # 1 sec bins | Bins with >0 counts | Bins with >2000 counts | High rate bins dominated by noise | Noise dominated (total time) | Noise dominated (detector-on time) | Marked lightcurve |
|---|---|---|---|---|---|---|---|
| A | 8958 | 6304 | 8 | 8 | 0.09% | 0.13% | 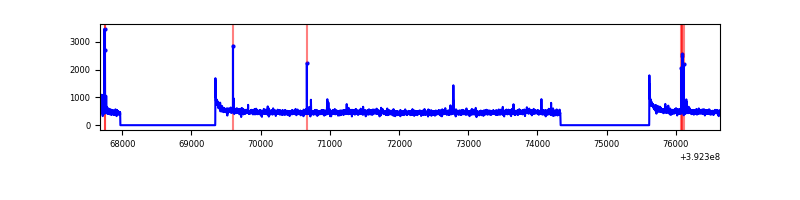 |
| B | 8958 | 6304 | 8 | 8 | 0.09% | 0.13% | 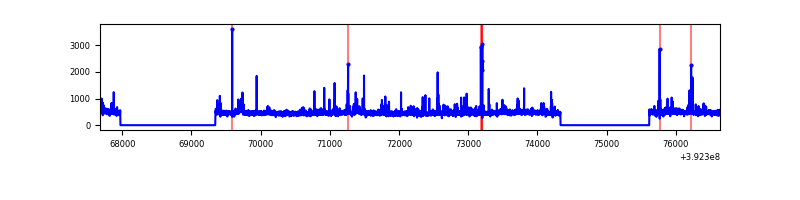 |
| C | 8957 | 6302 | 3795 | 3795 | 42.37% | 60.22% | 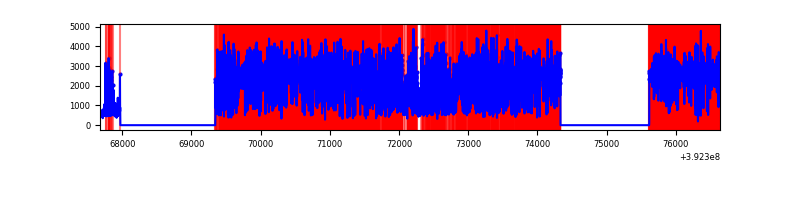 |
| D | 8958 | 6304 | 268 | 268 | 2.99% | 4.25% | 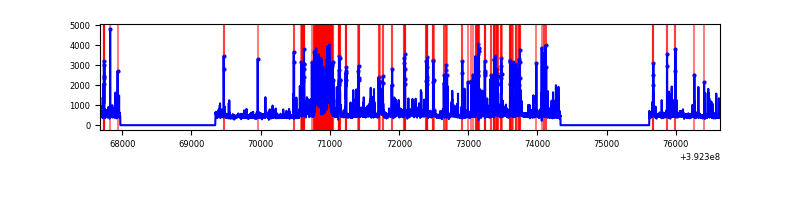 |
Top three noisy pixels from each quadrant. If the there are fewer than three noisy pixels in the level2.evt file, extra rows are filled as -1
| Pixel properties | Quadrant properties | ||||||
|---|---|---|---|---|---|---|---|
| Quadrant | DetID | PixID | Counts | Sigma | Mean | Median | Sigma |
| A | 10 | 83 | 186986 | 1282.34 | 720 | 704 | 145.3 |
| A | 9 | 143 | 55928 | 380.15 | 720 | 704 | 145.3 |
| A | 8 | 144 | 11518 | 74.44 | 720 | 704 | 145.3 |
| B | 5 | 172 | 157528 | 1120.81 | 718 | 697 | 139.9 |
| B | 4 | 232 | 22638 | 156.8 | 718 | 697 | 139.9 |
| B | 5 | 236 | 19372 | 133.46 | 718 | 697 | 139.9 |
| C | 4 | 254 | 11266572 | 110522.51 | 435 | 437 | 101.9 |
| C | 15 | 208 | 180441 | 1765.87 | 435 | 437 | 101.9 |
| C | 15 | 214 | 180059 | 1762.12 | 435 | 437 | 101.9 |
| D | 2 | 250 | 639985 | 3863.96 | 686 | 669 | 165.5 |
| D | 12 | 6 | 462433 | 2790.85 | 686 | 669 | 165.5 |
| D | 12 | 233 | 197780 | 1191.32 | 686 | 669 | 165.5 |
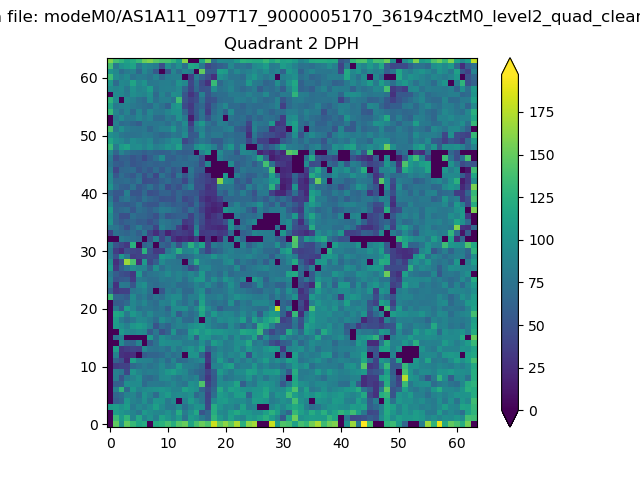
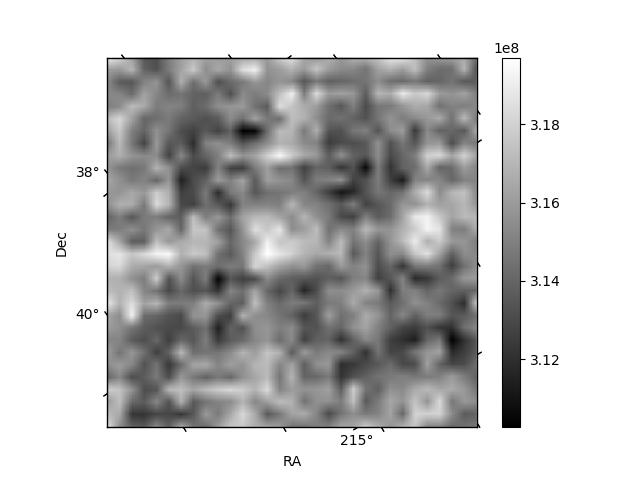
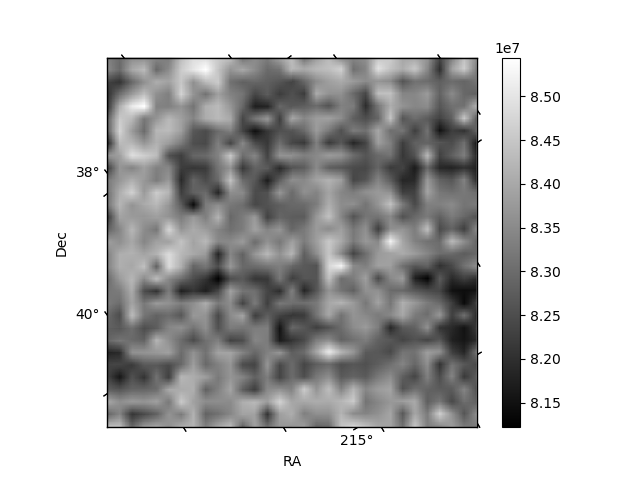
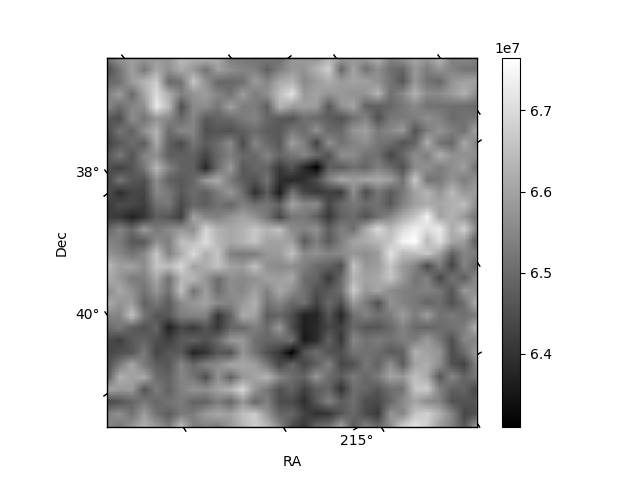
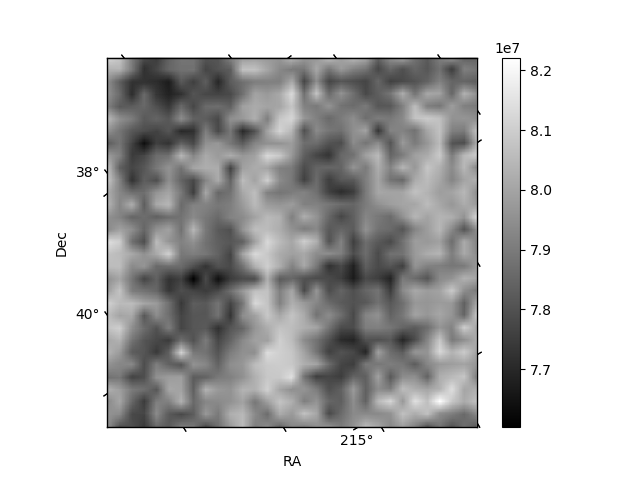
Histogram calculated using DETX and DETY for each event in the final _common_clean file
| Quadrant A | 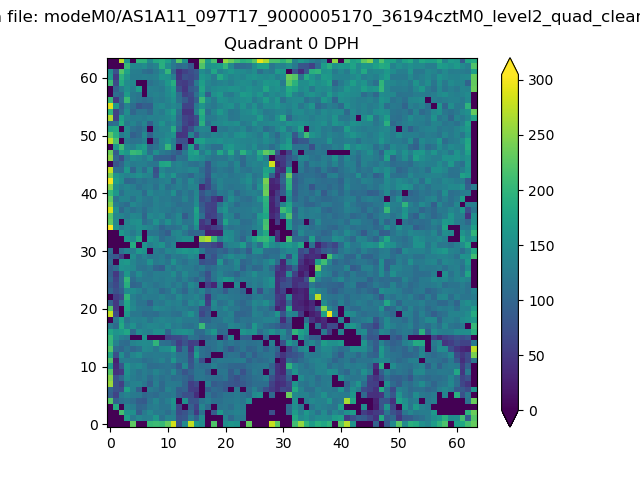 |
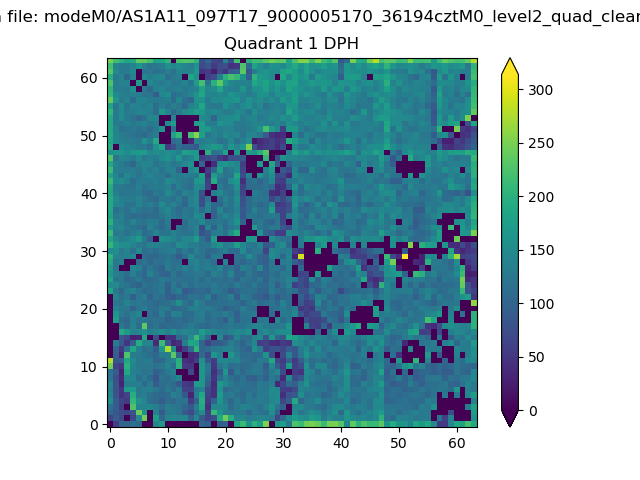 |
Quadrant B |
|---|---|---|---|
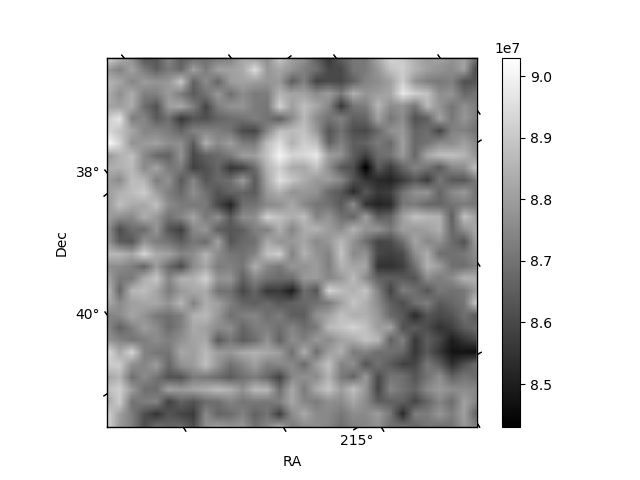
| Quadrant D | 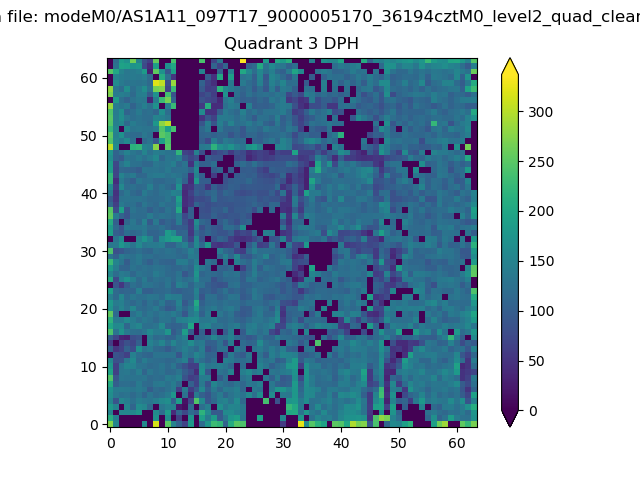 |
 |
Quadrant C |
| Plot type | Count rate plots | Images |
|---|---|---|
| Comparison with Poisson distribution Blue bars denote a histogram of data divided into 1 sec bins. Red curve is a Poisson curve with rate = median count rate of data. |
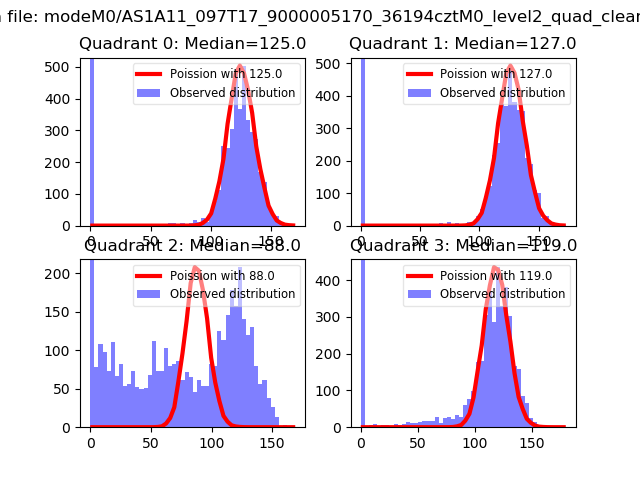 |
 |
| Quadrant-wise count rates Data is divided into 100 sec bins |
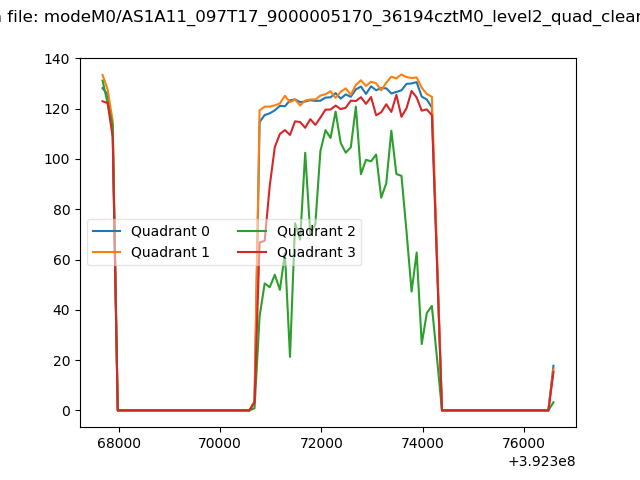 |
|
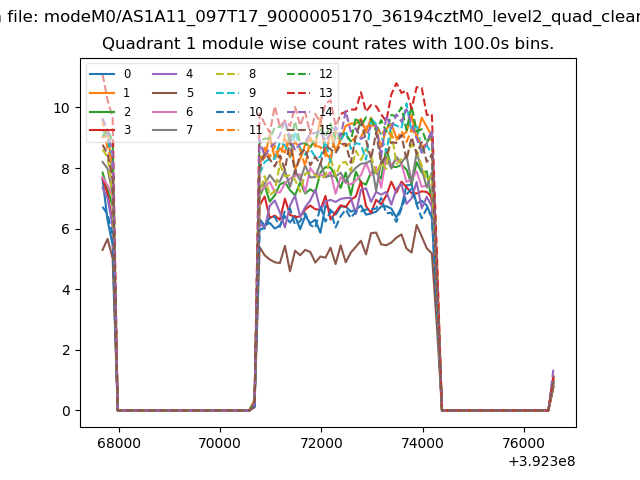
| Module-wise count rates for Quadrant A Data is divided into 100 sec bins |
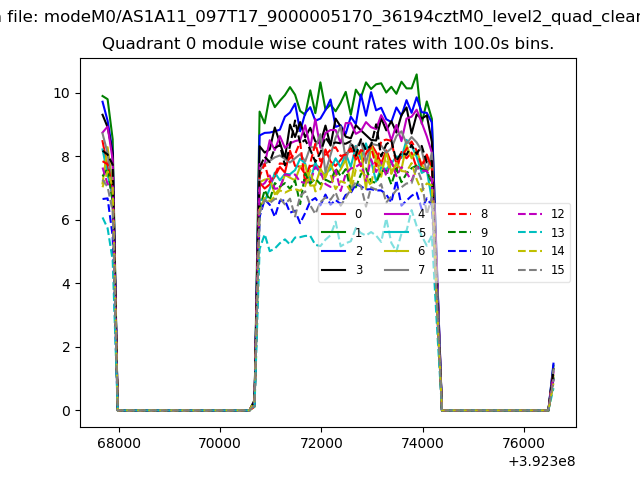 |
 |
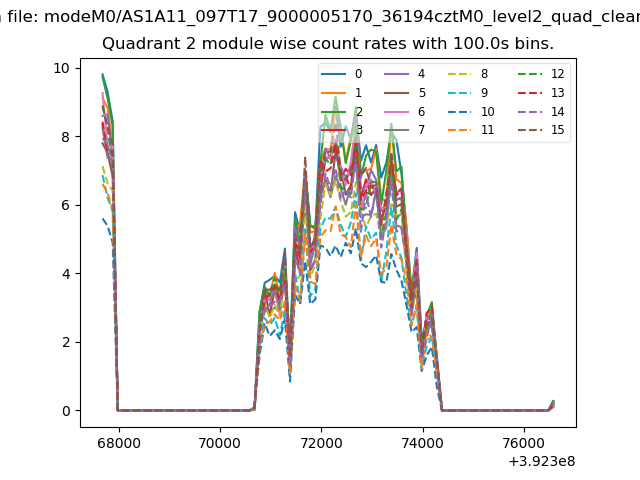
| Module-wise count rates for Quadrant B Data is divided into 100 sec bins |
 |
 |
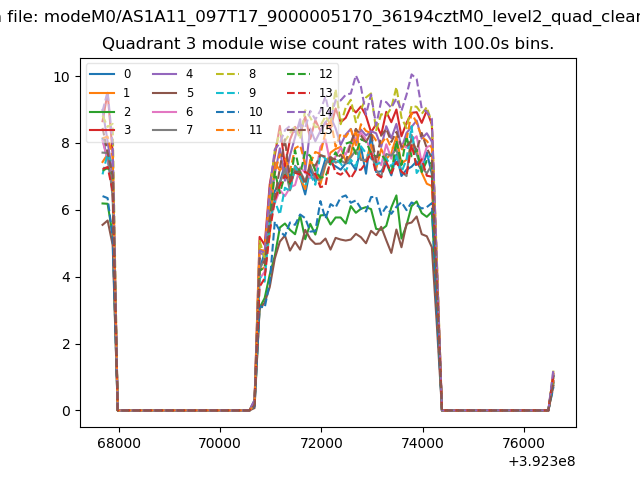
| Module-wise count rates for Quadrant C Data is divided into 100 sec bins |
 |
 |
| Module-wise count rates for Quadrant D Data is divided into 100 sec bins |
 |
 |
| Parameter | Plot |
|---|---|
| CZT HV Monitor | 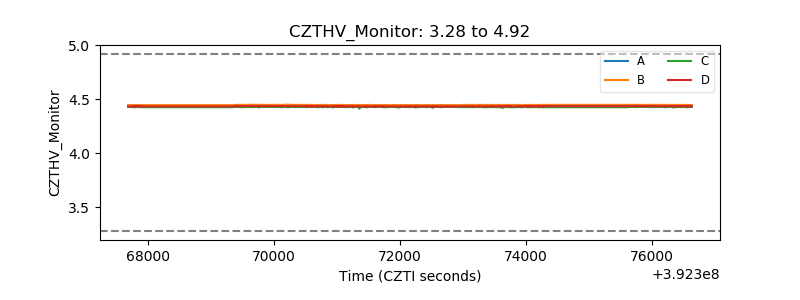 |
| D_VDD | 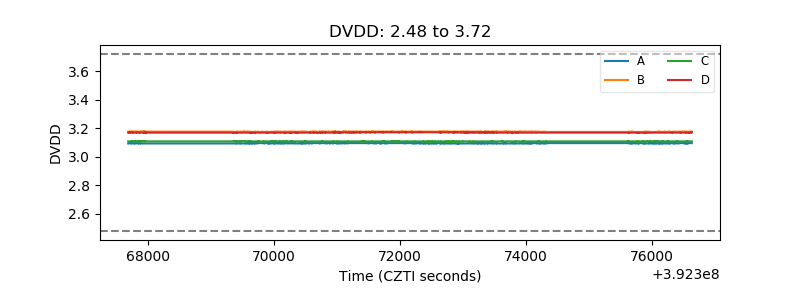 |
| Temperature 1 | 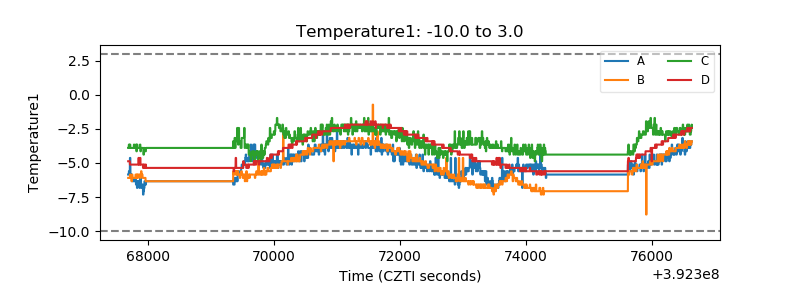 |
| Veto HV Monitor | 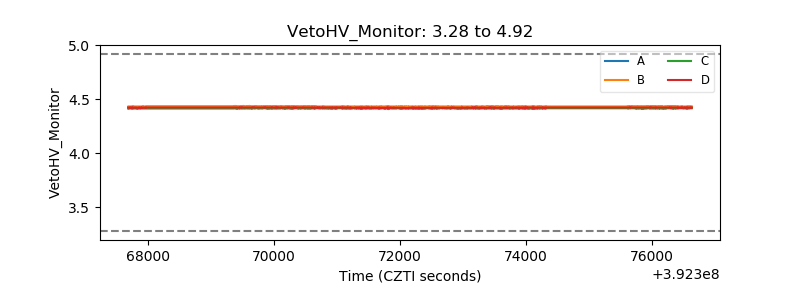 |
| Veto LLD | 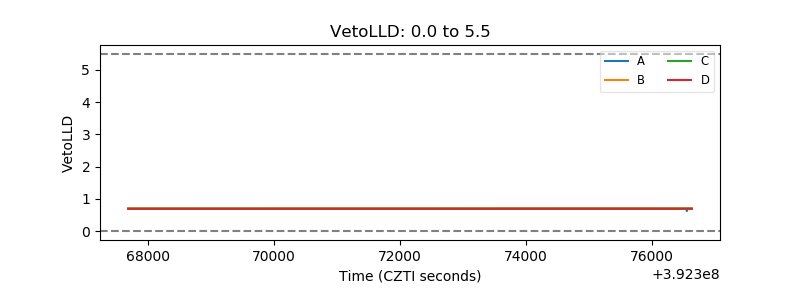 |
| Alpha Counter | 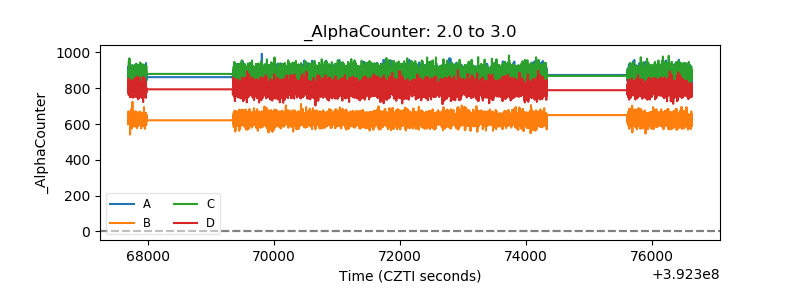 |
| _CPM_Rate | 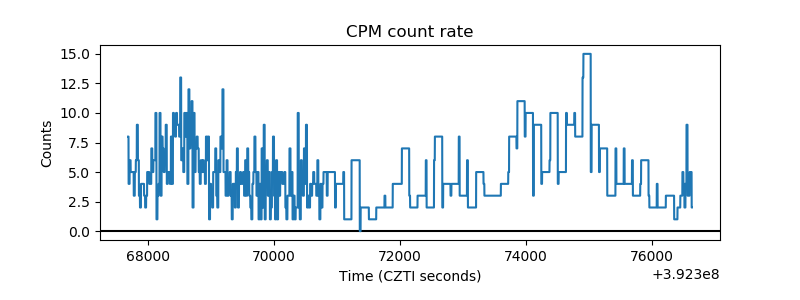 |
| CZT Counter | 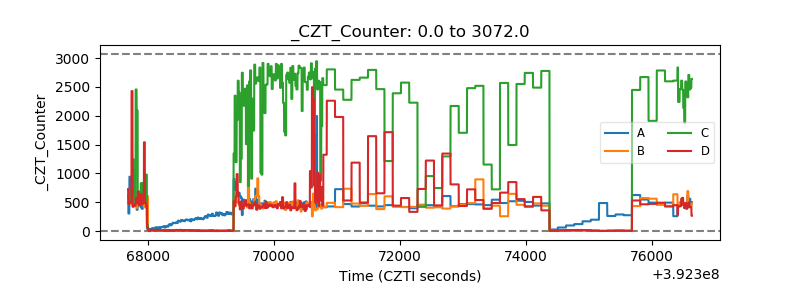 |
| +2.5 Volts monitor | 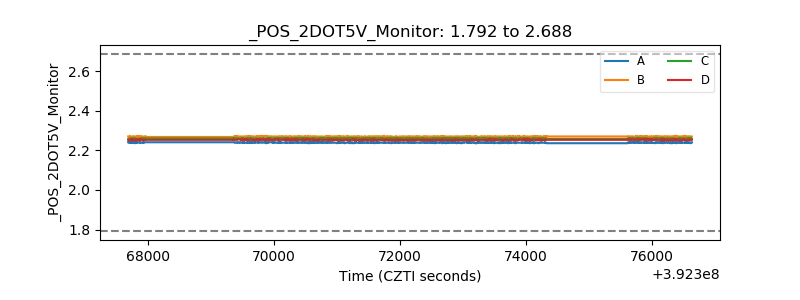 |
| +5 Volts monitor | 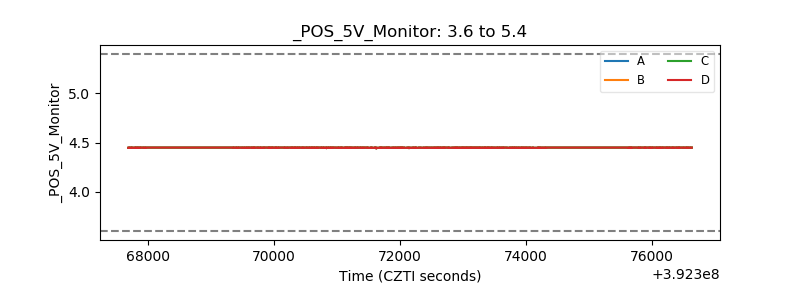 |
| _ROLL_ROT | 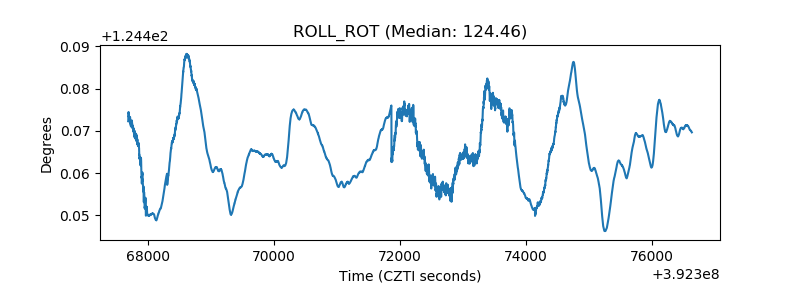 |
| _Roll_DEC | 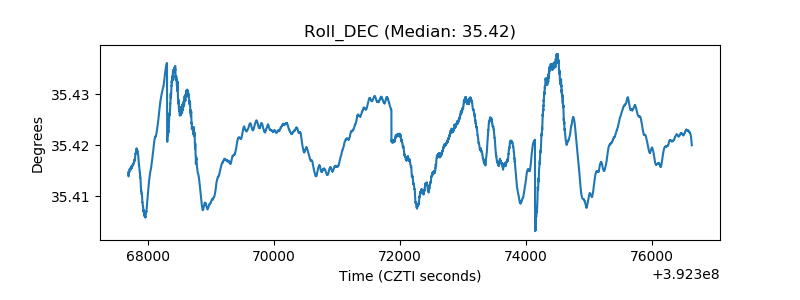 |
| _Roll_RA | 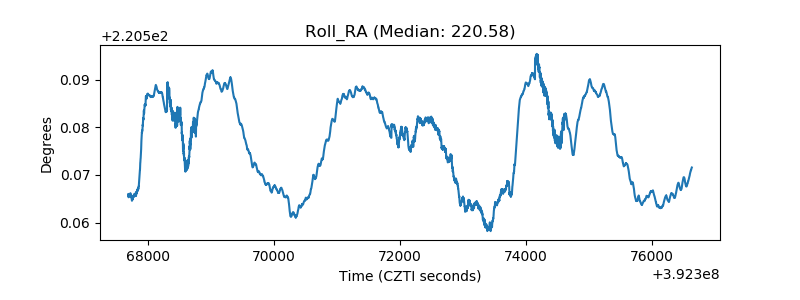 |
| Veto Counter | 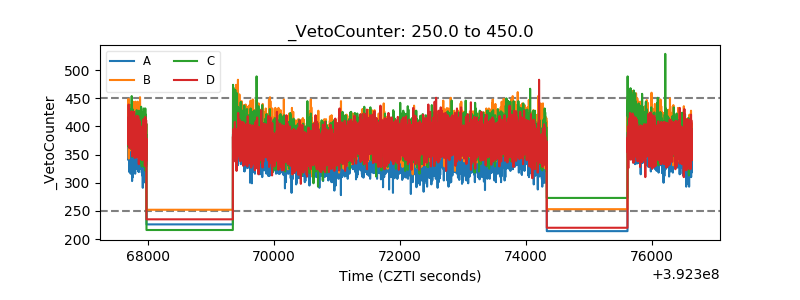 |