| Param | Original file | Final file |
|---|---|---|
| Filename | modeM0/AS1A11_097T17_9000005170_36191cztM0_level2.evt | modeM0/AS1A11_097T17_9000005170_36191cztM0_level2_quad_clean.evt |
| Size (bytes) | 385,329,600 | 51,140,160 |
| Size | 367.5 MB | 48.8 MB |
| Events in quadrant A | 2,427,672 | 304,931 |
| Events in quadrant B | 2,475,102 | 311,851 |
| Events in quadrant C | 3,281,466 | 299,367 |
| Events in quadrant D | 3,146,481 | 282,532 |
| Mode SS | |||
|---|---|---|---|
| Quadrant | BADHDUFLAG | Total packets | Discarded packets |
| A | 0 | 102 | 0 |
| B | 0 | 102 | 0 |
| C | 0 | 102 | 0 |
| D | 0 | 102 | 0 |
| Mode M0 | |||
|---|---|---|---|
| Quadrant | BADHDUFLAG | Total packets | Discarded packets |
| A | 0 | 10280 | 3 |
| B | 0 | 10531 | 2 |
| C | 0 | 12845 | 2 |
| D | 0 | 12874 | 2 |
| Mode M9 | |||
|---|---|---|---|
| Quadrant | BADHDUFLAG | Total packets | Discarded packets |
| A | 0 | 27 | 0 |
| B | 0 | 27 | 0 |
| C | 0 | 27 | 0 |
| D | 0 | 28 | 0 |
| Quadrant | Total seconds | Saturated seconds | Saturation percentage |
|---|---|---|---|
| A | 4979 | 12 | 0.241012% |
| B | 4979 | 25 | 0.502109% |
| C | 4979 | 129 | 2.590882% |
| D | 4979 | 184 | 3.695521% |
Noise dominated data is calculated using 1-second bins in cleaned event files. If a bin has >2000 counts, and if more than 50% of those come from <1% of pixels, then it is considered to be noise-dominated and hence unusable.
| Quadrant | # 1 sec bins | Bins with >0 counts | Bins with >2000 counts | High rate bins dominated by noise | Noise dominated (total time) | Noise dominated (detector-on time) | Marked lightcurve |
|---|---|---|---|---|---|---|---|
| A | 6951 | 4980 | 5 | 5 | 0.07% | 0.10% | 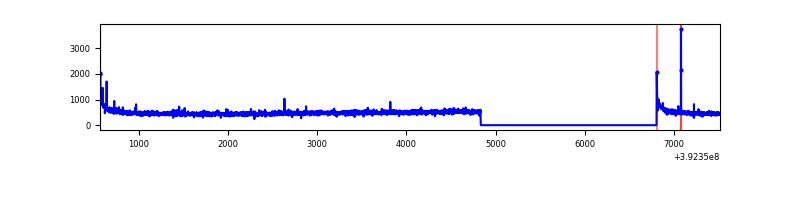 |
| B | 6951 | 4980 | 13 | 13 | 0.19% | 0.26% | 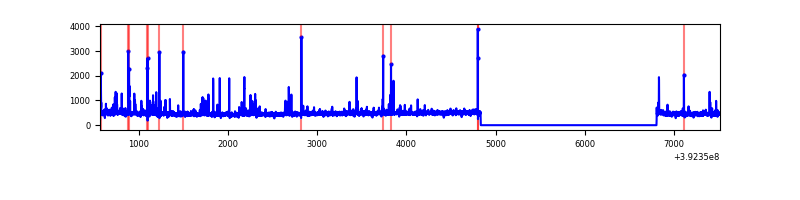 |
| C | 6951 | 4980 | 105 | 105 | 1.51% | 2.11% | 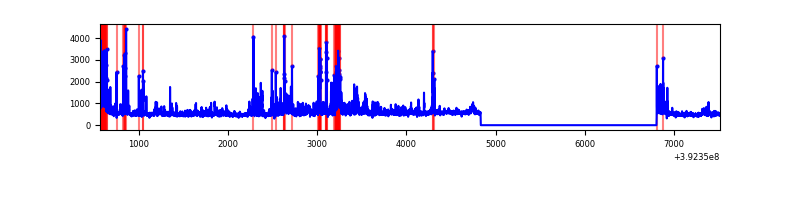 |
| D | 6951 | 4980 | 157 | 157 | 2.26% | 3.15% | 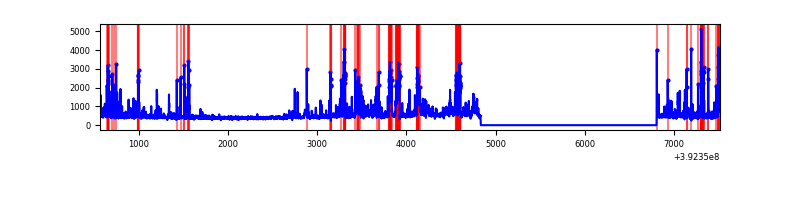 |
Top three noisy pixels from each quadrant. If the there are fewer than three noisy pixels in the level2.evt file, extra rows are filled as -1
| Pixel properties | Quadrant properties | ||||||
|---|---|---|---|---|---|---|---|
| Quadrant | DetID | PixID | Counts | Sigma | Mean | Median | Sigma |
| A | 10 | 83 | 165370 | 1423.82 | 573 | 562 | 115.8 |
| A | 8 | 144 | 20791 | 174.76 | 573 | 562 | 115.8 |
| A | 13 | 6 | 14339 | 119.02 | 573 | 562 | 115.8 |
| B | 5 | 172 | 180418 | 1628.51 | 572 | 557 | 110.4 |
| B | 5 | 236 | 17203 | 150.72 | 572 | 557 | 110.4 |
| B | 12 | 111 | 13755 | 119.5 | 572 | 557 | 110.4 |
| C | 4 | 254 | 520237 | 4013.1 | 555 | 558 | 129.5 |
| C | 0 | 10 | 271136 | 2089.47 | 555 | 558 | 129.5 |
| C | 15 | 214 | 228379 | 1759.29 | 555 | 558 | 129.5 |
| D | 1 | 52 | 261648 | 1930.24 | 548 | 533 | 135.3 |
| D | 13 | 249 | 257137 | 1896.89 | 548 | 533 | 135.3 |
| D | 2 | 250 | 130798 | 962.96 | 548 | 533 | 135.3 |
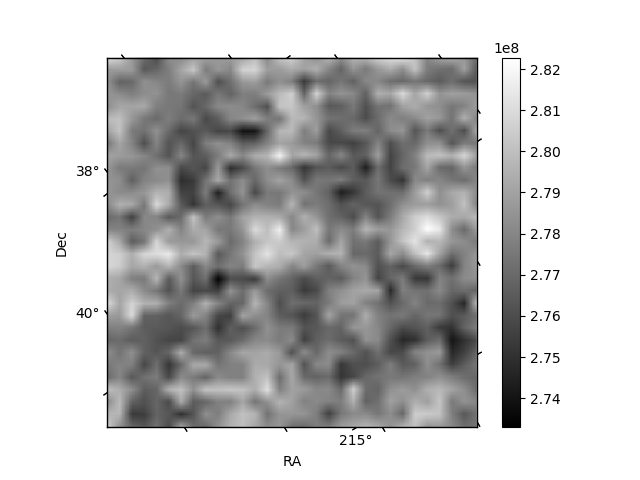
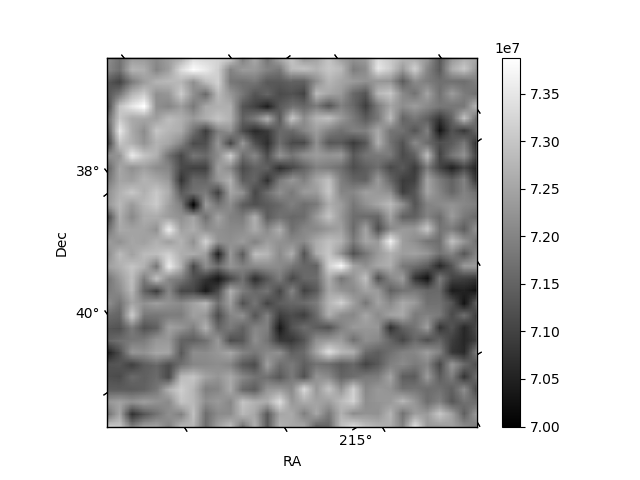
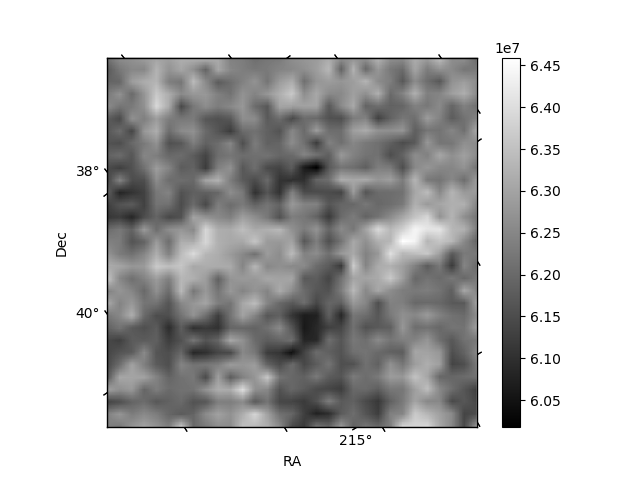
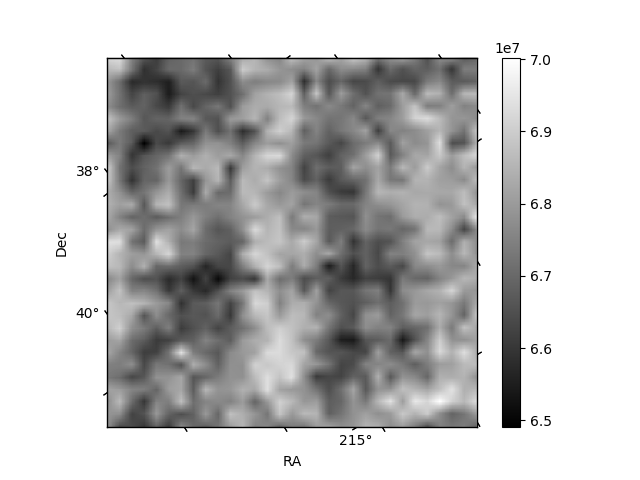
Histogram calculated using DETX and DETY for each event in the final _common_clean file
| Quadrant A | 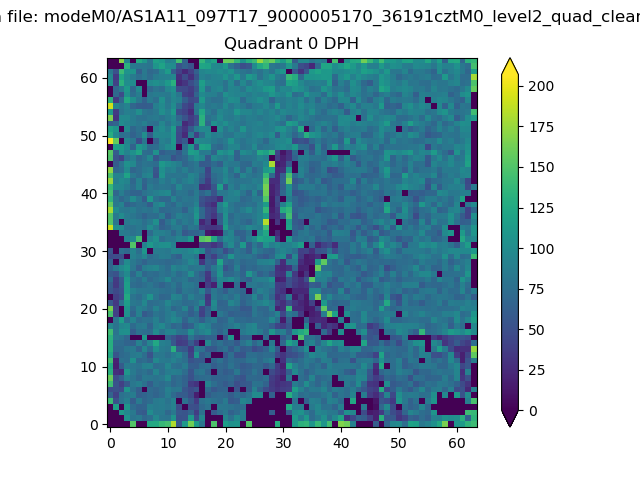 |
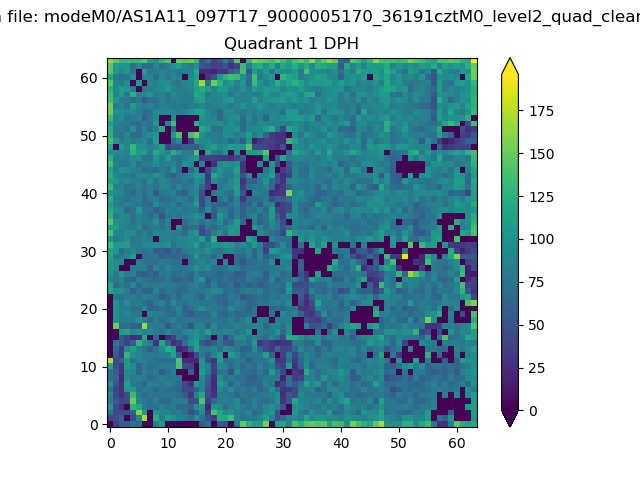 |
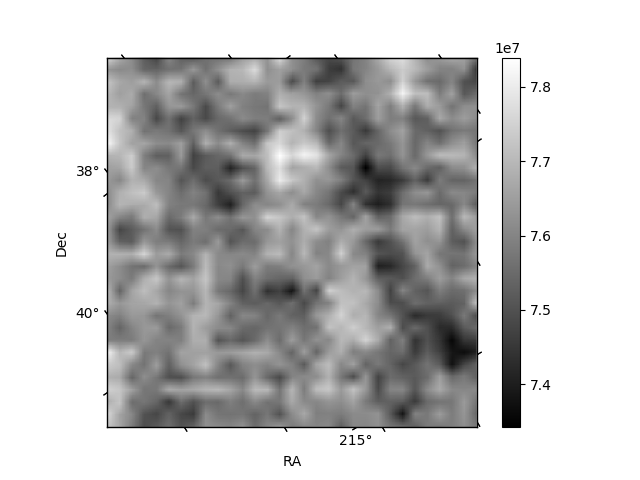
Quadrant B |
|---|---|---|---|
| Quadrant D | 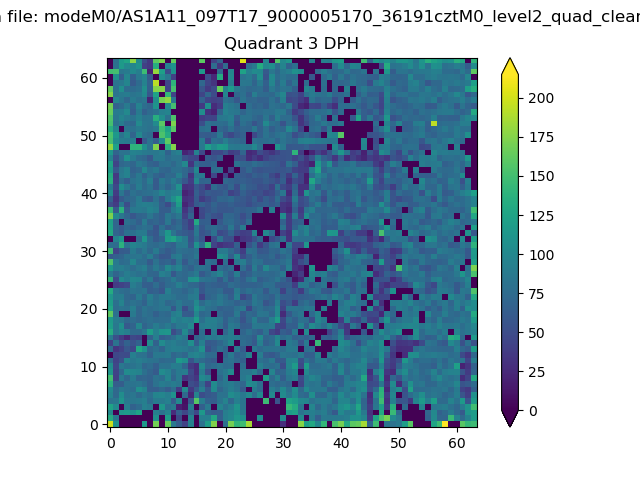 |
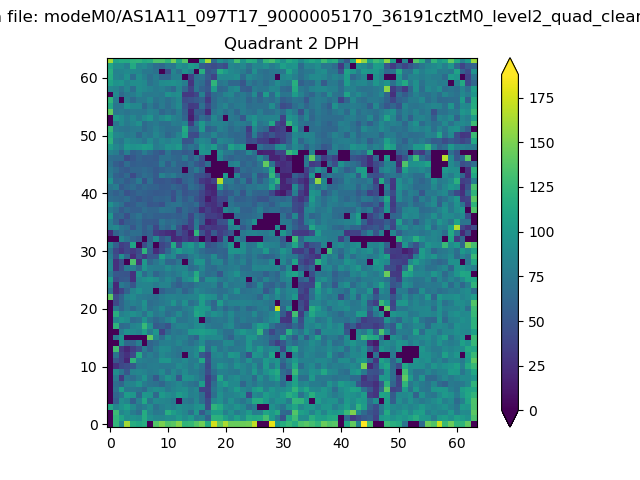 |
Quadrant C |
| Plot type | Count rate plots | Images |
|---|---|---|
| Comparison with Poisson distribution Blue bars denote a histogram of data divided into 1 sec bins. Red curve is a Poisson curve with rate = median count rate of data. |
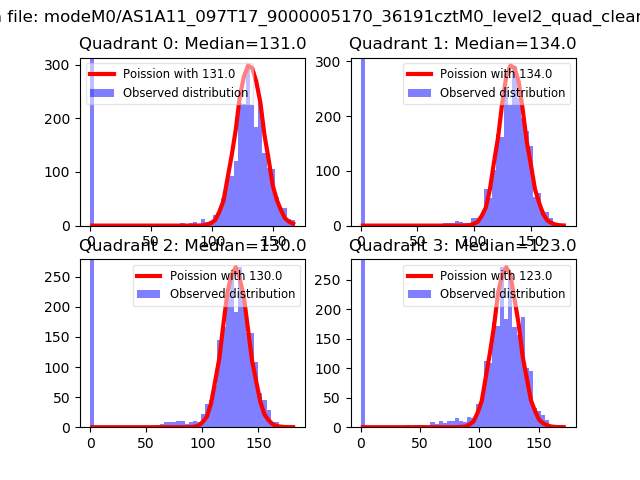 |
 |
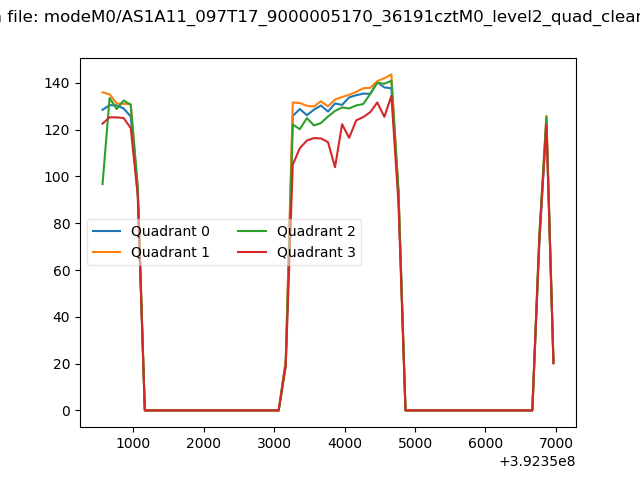
| Quadrant-wise count rates Data is divided into 100 sec bins |
 |
|
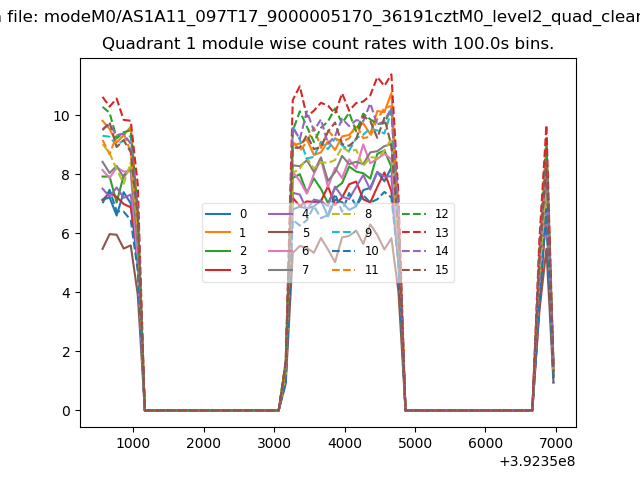
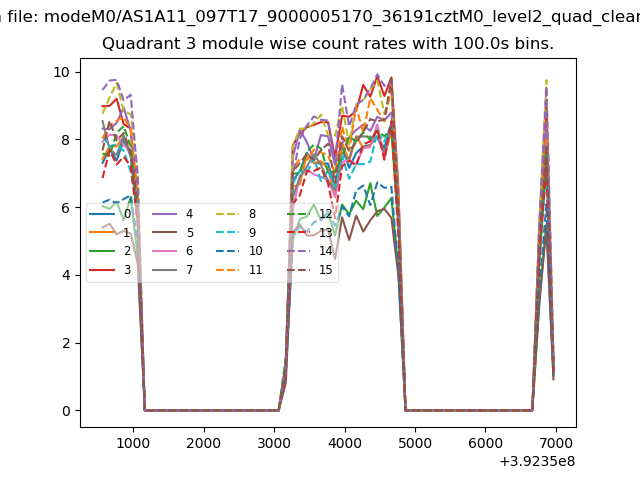
| Module-wise count rates for Quadrant A Data is divided into 100 sec bins |
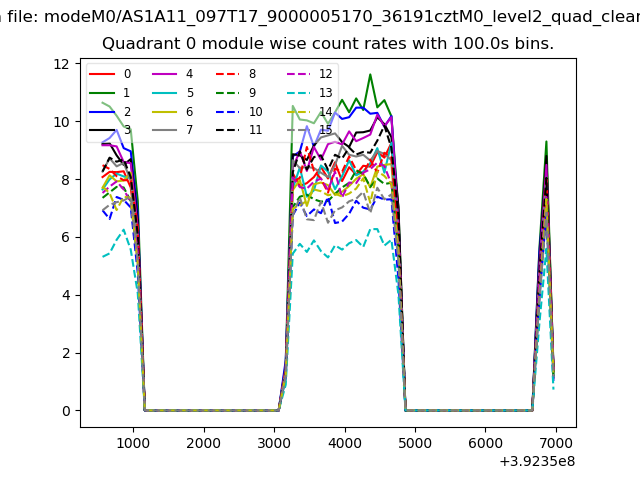 |
 |
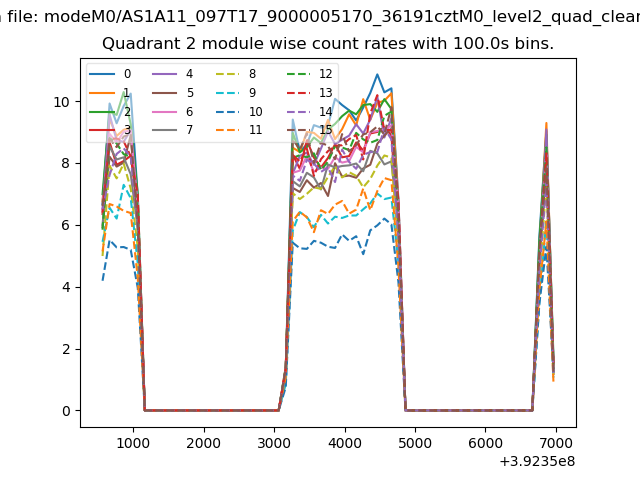
| Module-wise count rates for Quadrant B Data is divided into 100 sec bins |
 |
 |
| Module-wise count rates for Quadrant C Data is divided into 100 sec bins |
 |
 |
| Module-wise count rates for Quadrant D Data is divided into 100 sec bins |
 |
 |
| Parameter | Plot |
|---|---|
| CZT HV Monitor | 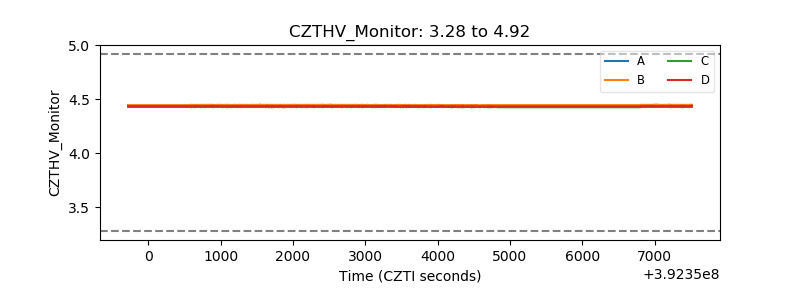 |
| D_VDD | 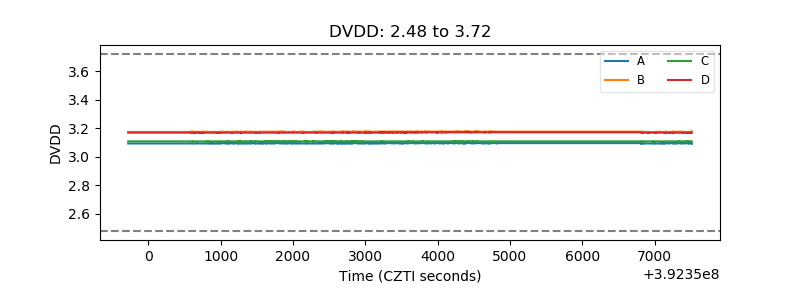 |
| Temperature 1 | 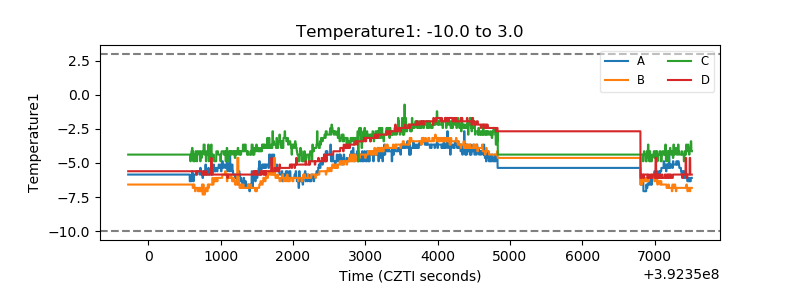 |
| Veto HV Monitor | 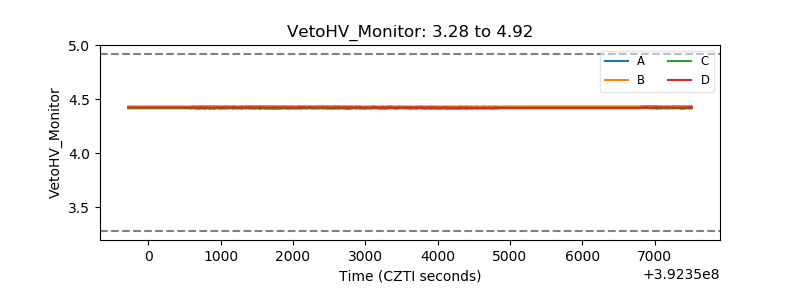 |
| Veto LLD | 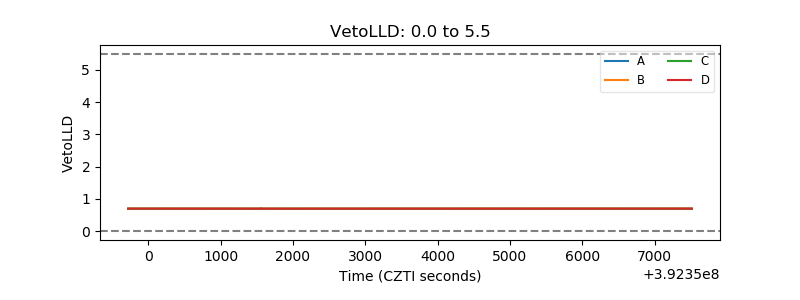 |
| Alpha Counter | 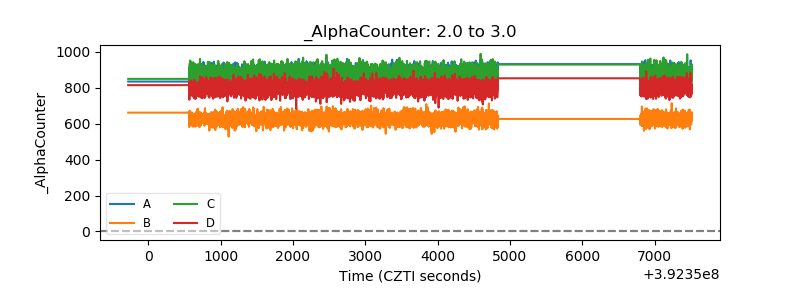 |
| _CPM_Rate | 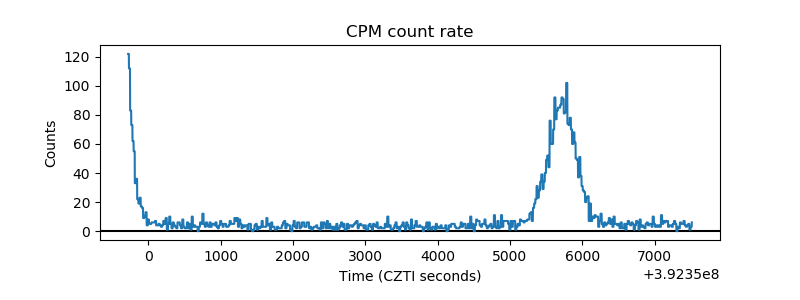 |
| CZT Counter | 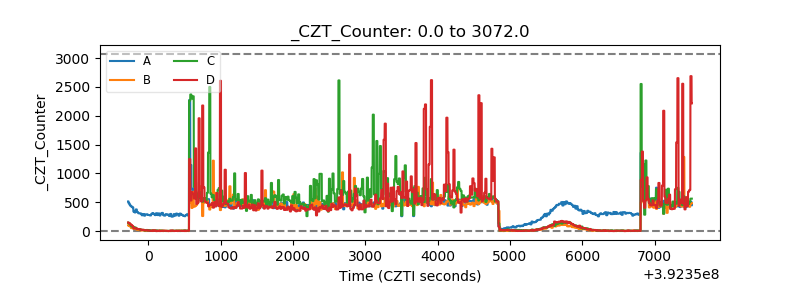 |
| +2.5 Volts monitor | 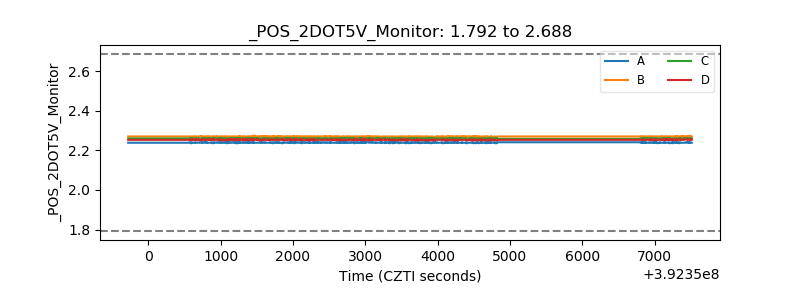 |
| +5 Volts monitor | 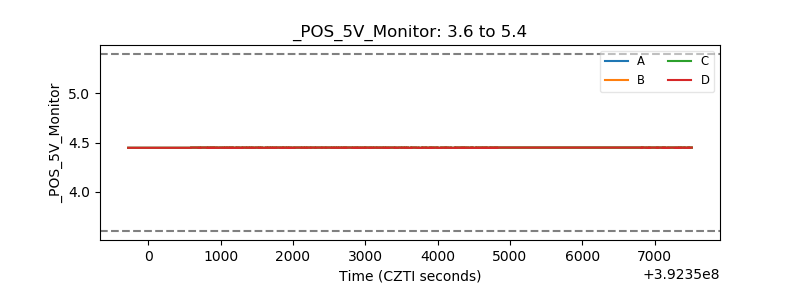 |
| _ROLL_ROT | 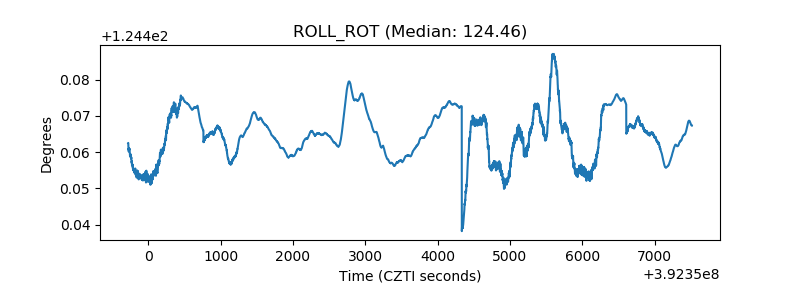 |
| _Roll_DEC | 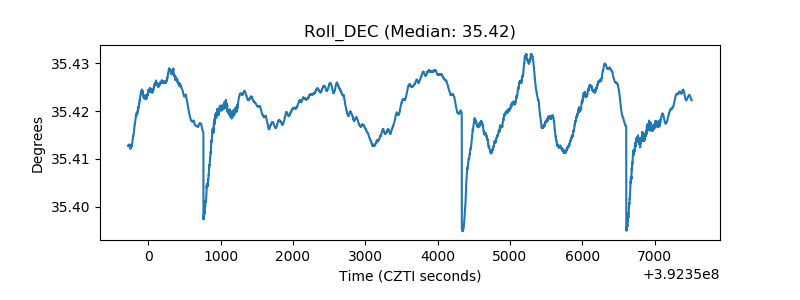 |
| _Roll_RA | 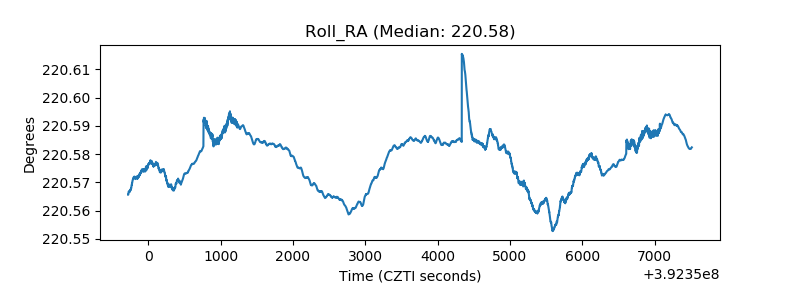 |
| Veto Counter | 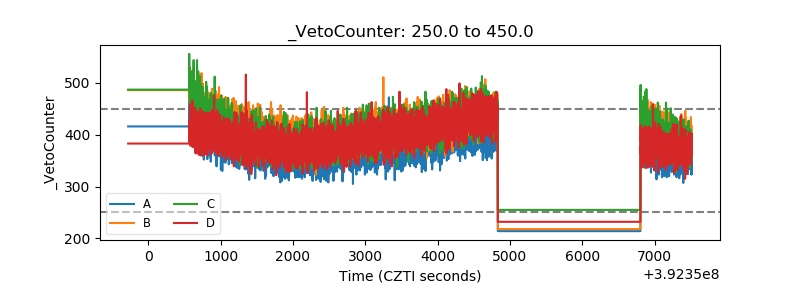 |