| Param | Original file | Final file |
|---|---|---|
| Filename | modeM0/AS1A11_097T17_9000005170cztM0_level2_bc.evt | modeM0/AS1A11_097T17_9000005170cztM0_level2_quad_clean.evt |
| Size (bytes) | 2,984,981,760 | 738,619,200 |
| Size | 2.8 GB | 704.4 MB |
| Events in quadrant A | 13,430,424 | 4,787,768 |
| Events in quadrant B | 14,636,165 | 4,848,541 |
| Events in quadrant C | 31,102,343 | 4,439,639 |
| Events in quadrant D | 27,359,732 | 4,388,733 |
| Mode SS | |||
|---|---|---|---|
| Quadrant | BADHDUFLAG | Total packets | Discarded packets |
| A | 0 | 1168 | 0 |
| B | 0 | 1168 | 0 |
| C | 0 | 1168 | 0 |
| D | 0 | 1168 | 0 |
| Mode M0 | |||
|---|---|---|---|
| Quadrant | BADHDUFLAG | Total packets | Discarded packets |
| A | 0 | 119064 | 0 |
| B | 0 | 126043 | 0 |
| C | 0 | 188385 | 0 |
| D | 0 | 170157 | 0 |
| Mode M9 | |||
|---|---|---|---|
| Quadrant | BADHDUFLAG | Total packets | Discarded packets |
| A | 0 | 220 | 0 |
| B | 0 | 220 | 0 |
| C | 0 | 220 | 0 |
| D | 0 | 220 | 0 |
| Quadrant | Total seconds | Saturated seconds | Saturation percentage |
|---|---|---|---|
| A | 56903 | 131 | 0.230216% |
| B | 56903 | 707 | 1.242465% |
| C | 56903 | 7655 | 13.452718% |
| D | 56903 | 4270 | 7.503998% |
Noise dominated data is calculated using 1-second bins in cleaned event files. If a bin has >2000 counts, and if more than 50% of those come from <1% of pixels, then it is considered to be noise-dominated and hence unusable.
| Quadrant | # 1 sec bins | Bins with >0 counts | Bins with >2000 counts | High rate bins dominated by noise | Noise dominated (total time) | Noise dominated (detector-on time) | Marked lightcurve |
|---|---|---|---|---|---|---|---|
| A | 79070 | 56916 | 10 | 10 | 0.01% | 0.02% | 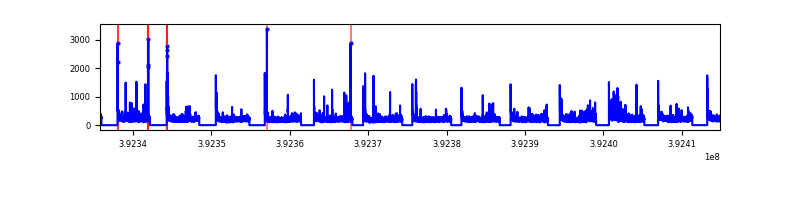 |
| B | 79070 | 56903 | 88 | 88 | 0.11% | 0.15% | 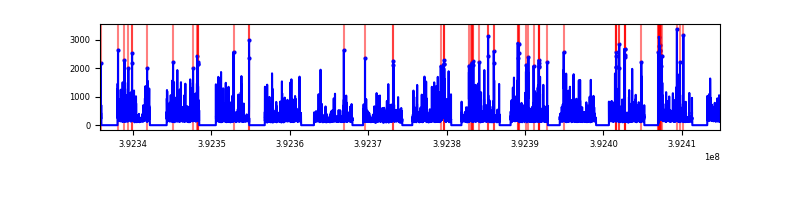 |
| C | 79070 | 56883 | 1999 | 1999 | 2.53% | 3.51% | 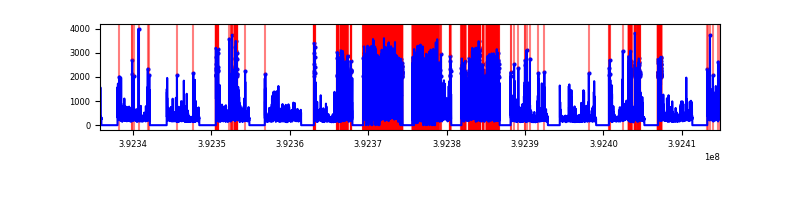 |
| D | 79070 | 56900 | 1508 | 1508 | 1.91% | 2.65% | 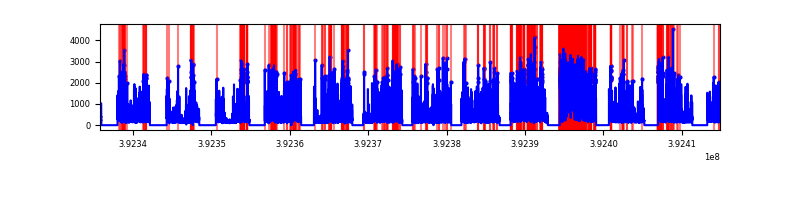 |
Top three noisy pixels from each quadrant. If the there are fewer than three noisy pixels in the level2.evt file, extra rows are filled as -1
| Pixel properties | Quadrant properties | ||||||
|---|---|---|---|---|---|---|---|
| Quadrant | DetID | PixID | Counts | Sigma | Mean | Median | Sigma |
| A | 10 | 83 | 1402556 | 2203.87 | 2867 | 2822 | 635.1 |
| A | 15 | 223 | 418329 | 654.21 | 2867 | 2822 | 635.1 |
| A | 8 | 144 | 200660 | 311.49 | 2867 | 2822 | 635.1 |
| B | 5 | 172 | 1931461 | 3352.03 | 2902 | 2834 | 575.4 |
| B | 4 | 171 | 610277 | 1055.76 | 2902 | 2834 | 575.4 |
| B | 5 | 236 | 266293 | 457.9 | 2902 | 2834 | 575.4 |
| C | 4 | 254 | 14823281 | 24367.76 | 2652 | 2633 | 608.2 |
| C | 15 | 214 | 2245802 | 3688.17 | 2652 | 2633 | 608.2 |
| C | 15 | 208 | 2029370 | 3332.31 | 2652 | 2633 | 608.2 |
| D | 12 | 227 | 6249312 | 9516.87 | 2773 | 2691 | 656.4 |
| D | 12 | 6 | 2906412 | 4423.88 | 2773 | 2691 | 656.4 |
| D | 2 | 250 | 2142016 | 3259.31 | 2773 | 2691 | 656.4 |
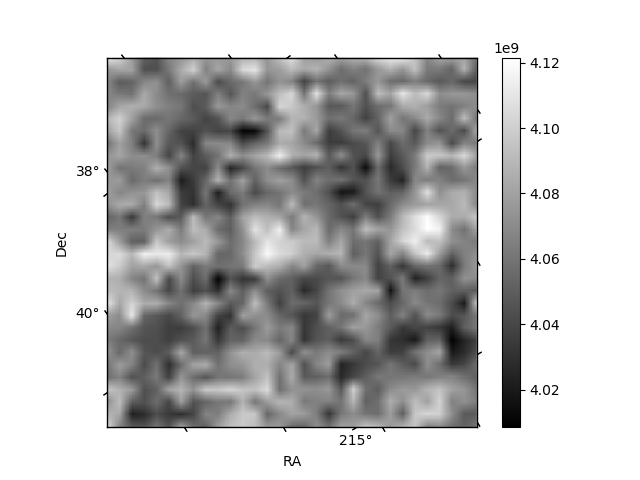
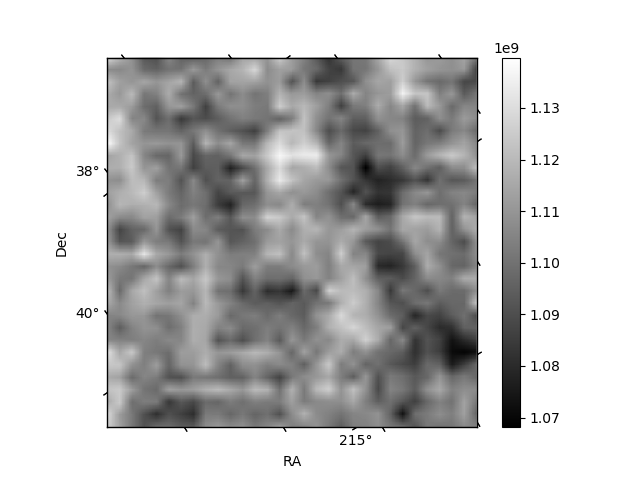
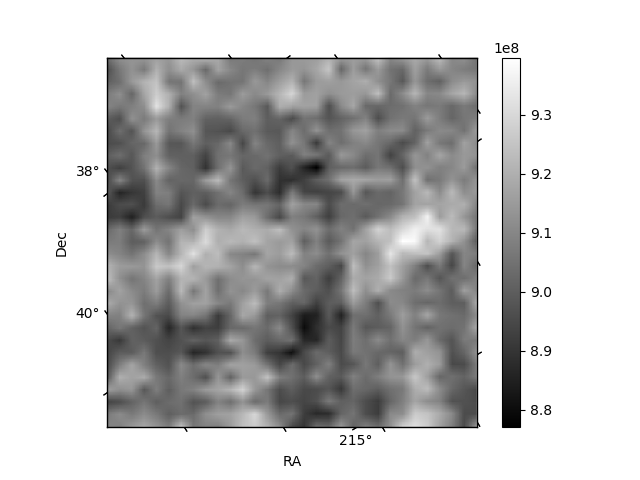
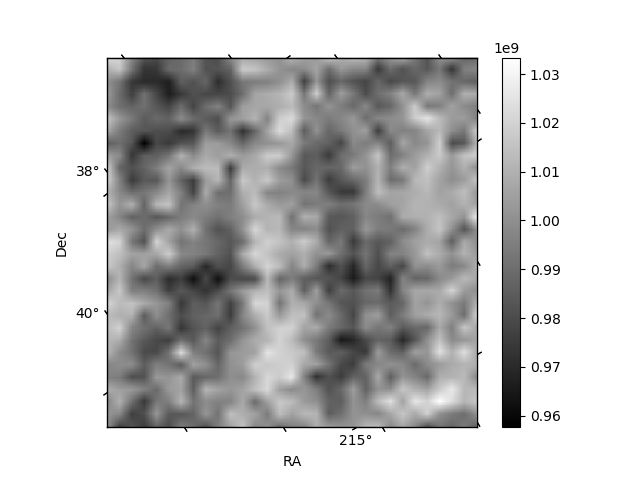
Histogram calculated using DETX and DETY for each event in the final _common_clean file
| Quadrant A | 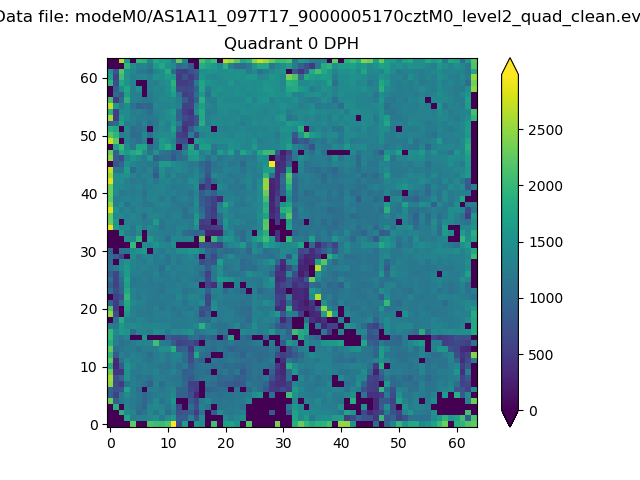 |
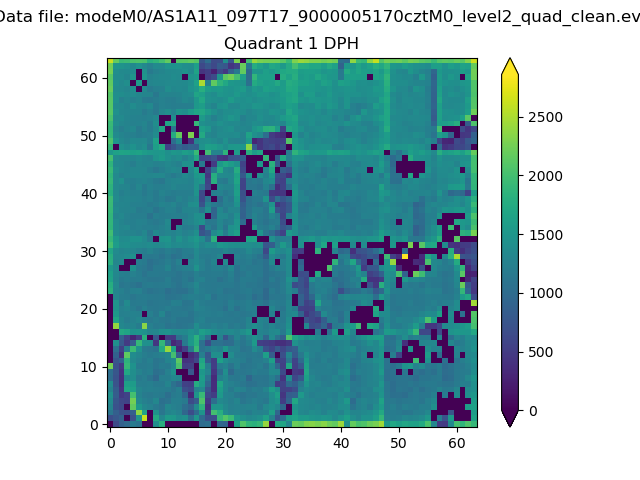 |
Quadrant B |
|---|---|---|---|
| Quadrant D | 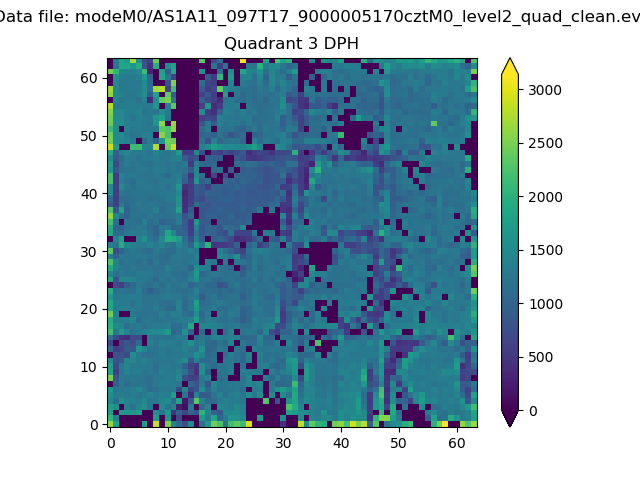 |
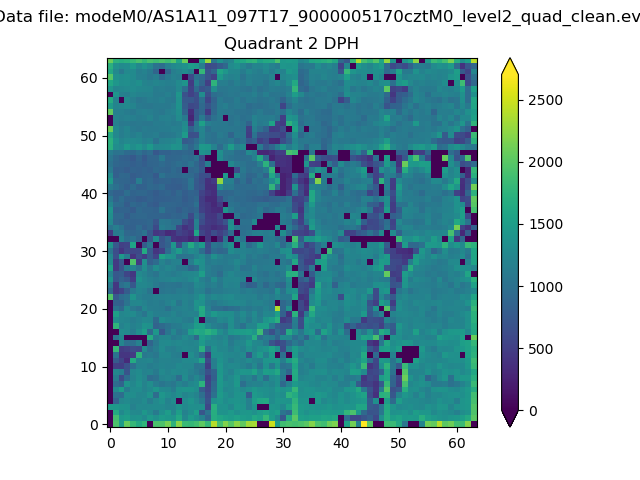 |
Quadrant C |
| Plot type | Count rate plots | Images |
|---|---|---|
| Comparison with Poisson distribution Blue bars denote a histogram of data divided into 1 sec bins. Red curve is a Poisson curve with rate = median count rate of data. |
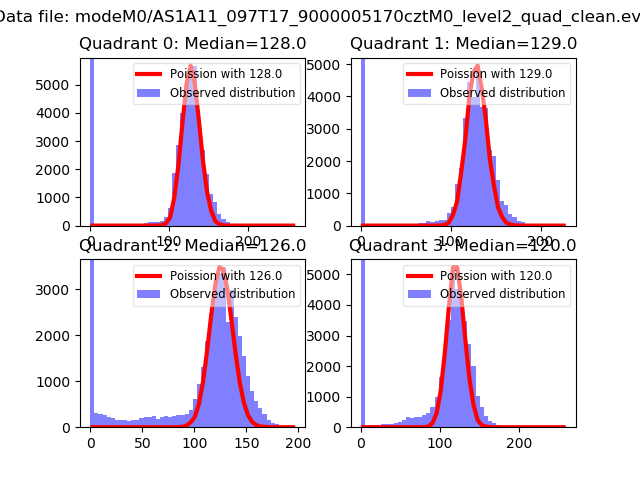 |
 |
| Quadrant-wise count rates Data is divided into 100 sec bins |
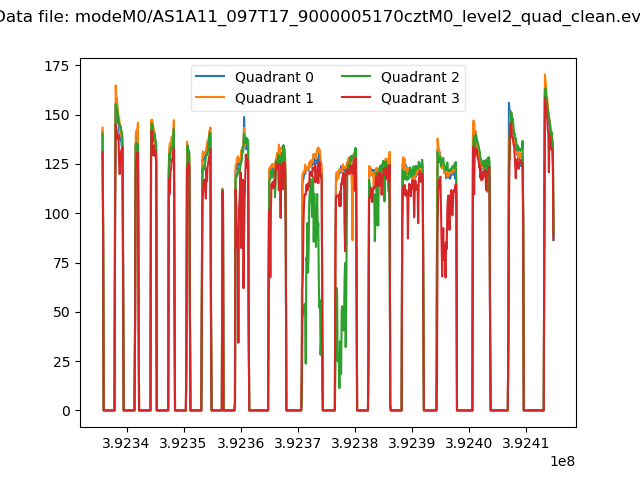 |
|
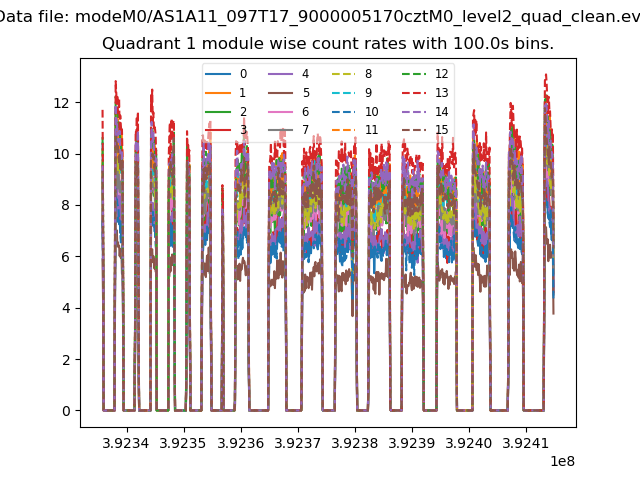
| Module-wise count rates for Quadrant A Data is divided into 100 sec bins |
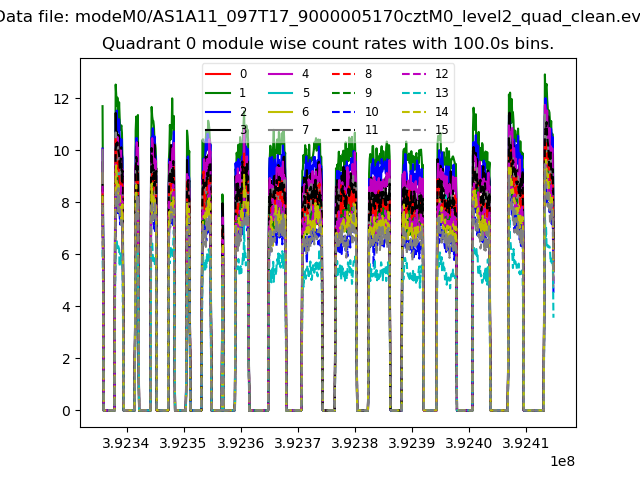 |
 |
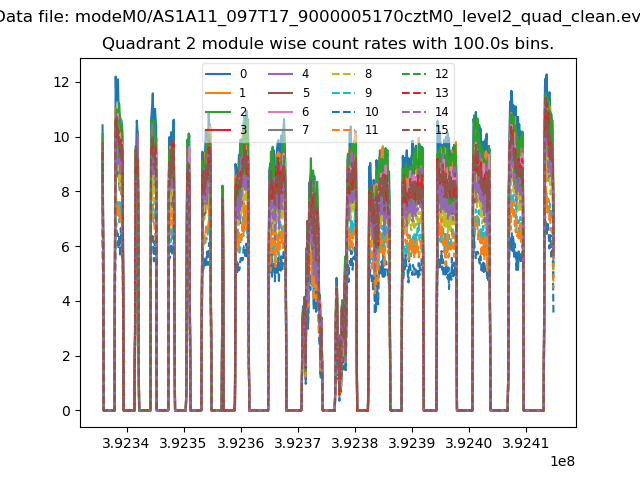
| Module-wise count rates for Quadrant B Data is divided into 100 sec bins |
 |
 |
| Module-wise count rates for Quadrant C Data is divided into 100 sec bins |
 |
 |
| Module-wise count rates for Quadrant D Data is divided into 100 sec bins |
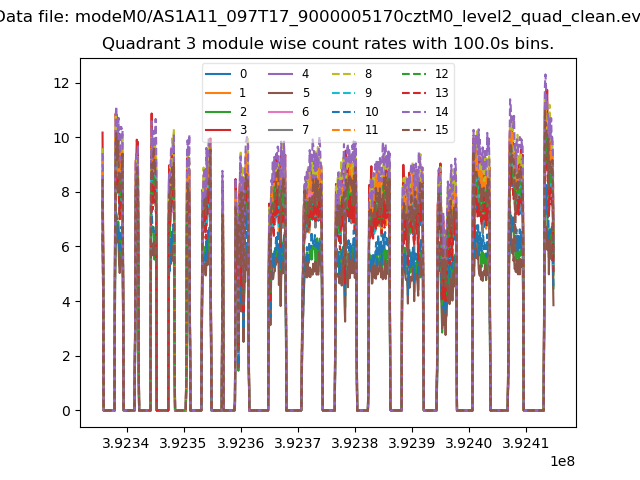 |
 |
| Parameter | Plot |
|---|---|
| CZT HV Monitor | 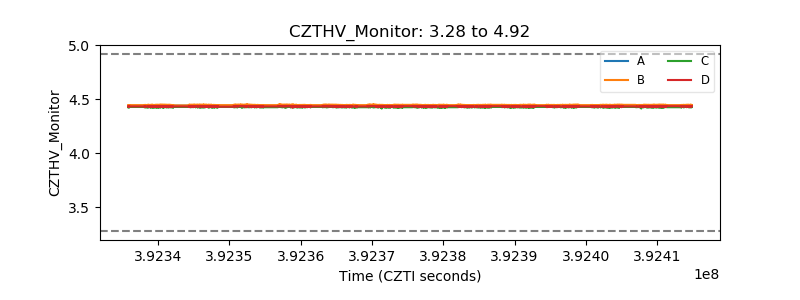 |
| D_VDD | 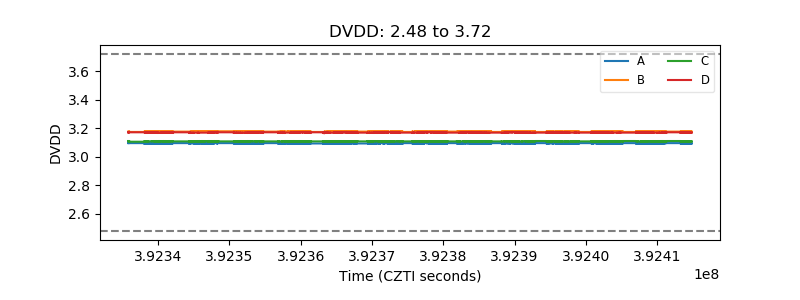 |
| Temperature 1 | 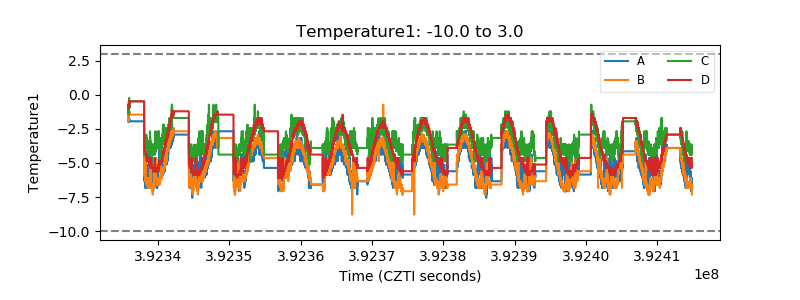 |
| Veto HV Monitor | 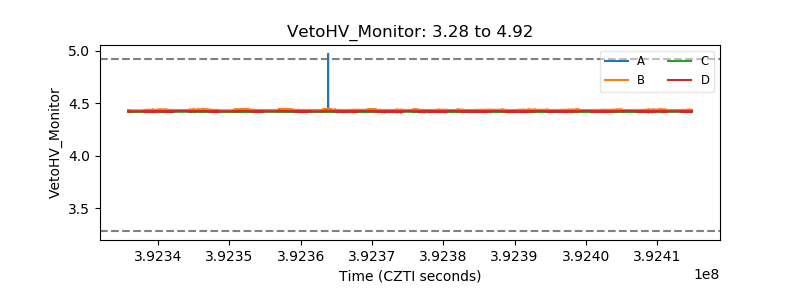 |
| Veto LLD | 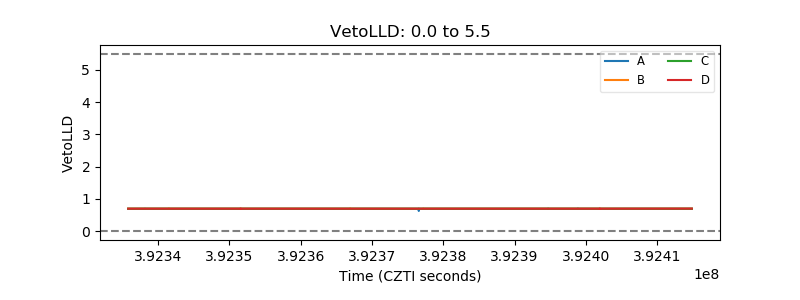 |
| Alpha Counter | 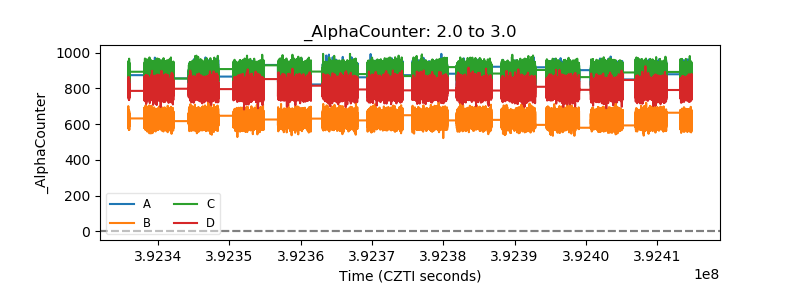 |
| _CPM_Rate | 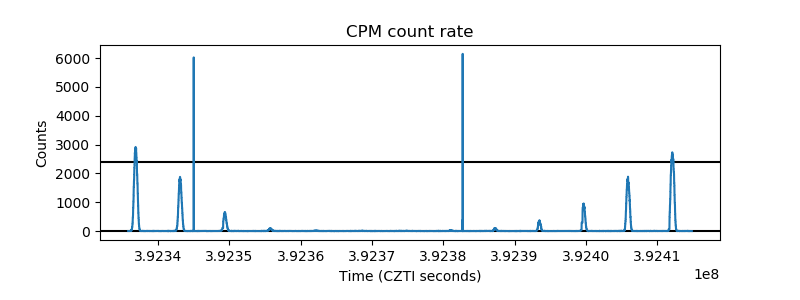 |
| CZT Counter | 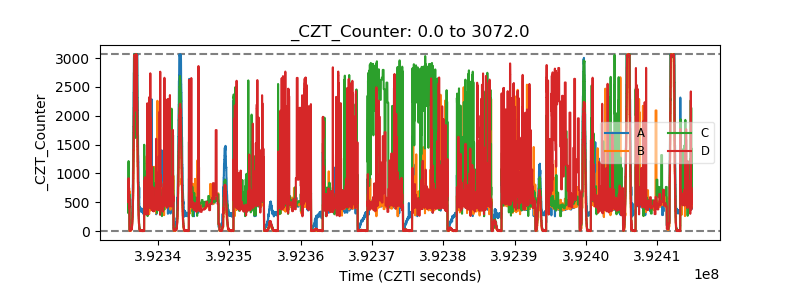 |
| +2.5 Volts monitor | 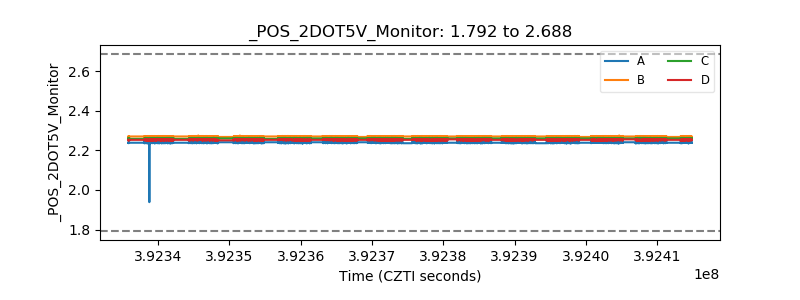 |
| +5 Volts monitor | 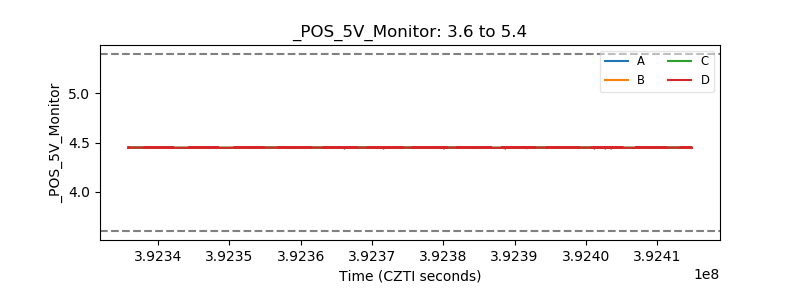 |
| _ROLL_ROT | 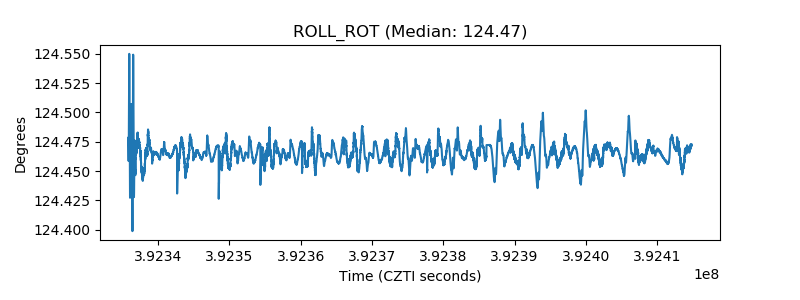 |
| _Roll_DEC | 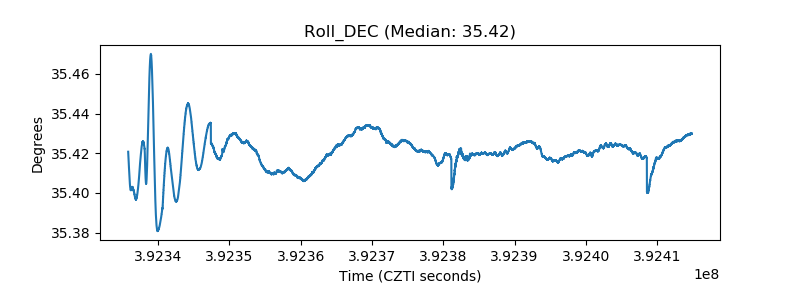 |
| _Roll_RA | 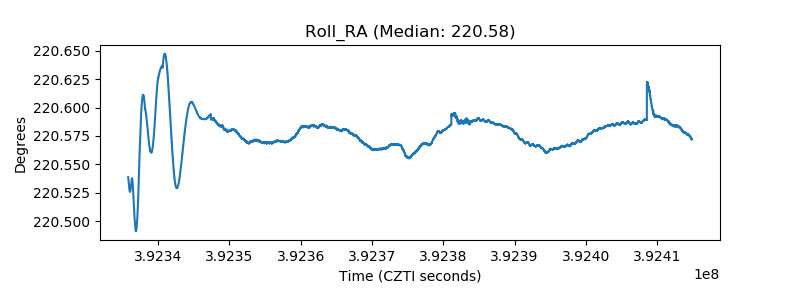 |
| Veto Counter | 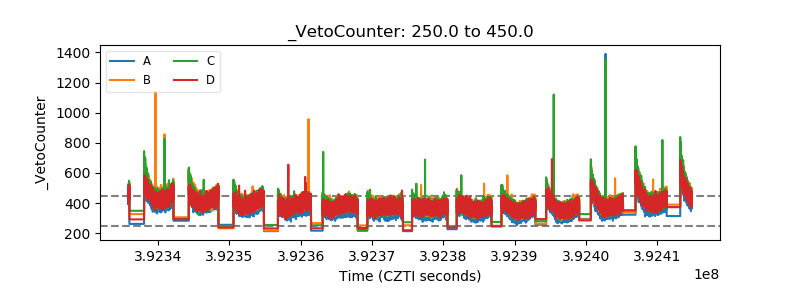 |