| Param | Original file | Final file |
|---|---|---|
| Filename | modeM0/AS1A10_071T50_9000005166_36187cztM0_level2.evt | modeM0/AS1A10_071T50_9000005166_36187cztM0_level2_quad_clean.evt |
| Size (bytes) | 16,076,160 | 3,087,360 |
| Size | 15.3 MB | 2.9 MB |
| Events in quadrant A | 109,161 | 20,044 |
| Events in quadrant B | 171,807 | 16,901 |
| Events in quadrant C | 103,973 | 19,604 |
| Events in quadrant D | 89,455 | 18,912 |
| Mode M0 | |||
|---|---|---|---|
| Quadrant | BADHDUFLAG | Total packets | Discarded packets |
| A | 0 | 430 | 1 |
| B | 0 | 610 | 1 |
| C | 0 | 404 | 1 |
| D | 0 | 350 | 1 |
| Mode M9 | |||
|---|---|---|---|
| Quadrant | BADHDUFLAG | Total packets | Discarded packets |
| A | 0 | 6 | 0 |
| B | 0 | 6 | 0 |
| C | 0 | 6 | 0 |
| D | 0 | 7 | 0 |
| Mode SS | |||
|---|---|---|---|
| Quadrant | BADHDUFLAG | Total packets | Discarded packets |
| A | 0 | 2 | 0 |
| B | 0 | 2 | 0 |
| C | 0 | 2 | 0 |
| D | 0 | 2 | 0 |
| Quadrant | Total seconds | Saturated seconds | Saturation percentage |
|---|---|---|---|
| A | 130 | 3 | 2.307692% |
| B | 130 | 40 | 30.769231% |
| C | 130 | 5 | 3.846154% |
| D | 130 | 5 | 3.846154% |
Noise dominated data is calculated using 1-second bins in cleaned event files. If a bin has >2000 counts, and if more than 50% of those come from <1% of pixels, then it is considered to be noise-dominated and hence unusable.
| Quadrant | # 1 sec bins | Bins with >0 counts | Bins with >2000 counts | High rate bins dominated by noise | Noise dominated (total time) | Noise dominated (detector-on time) | Marked lightcurve |
|---|---|---|---|---|---|---|---|
| A | 130 | 130 | 1 | 1 | 0.77% | 0.77% | 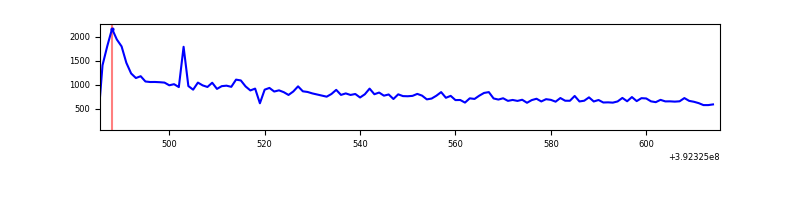 |
| B | 130 | 130 | 29 | 29 | 22.31% | 22.31% | 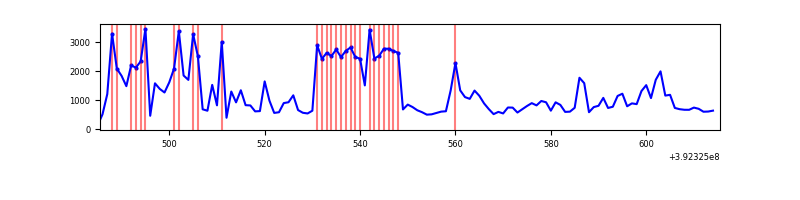 |
| C | 130 | 130 | 1 | 1 | 0.77% | 0.77% | 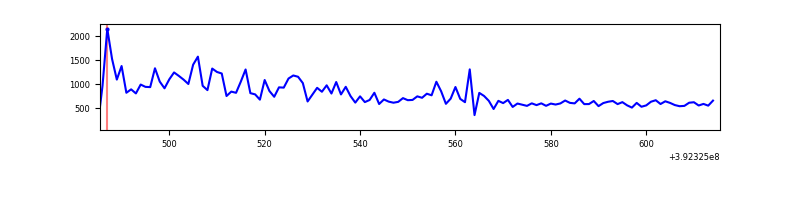 |
| D | 130 | 130 | 2 | 2 | 1.54% | 1.54% | 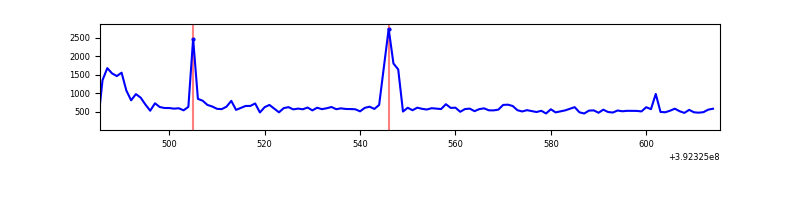 |
Top three noisy pixels from each quadrant. If the there are fewer than three noisy pixels in the level2.evt file, extra rows are filled as -1
| Pixel properties | Quadrant properties | ||||||
|---|---|---|---|---|---|---|---|
| Quadrant | DetID | PixID | Counts | Sigma | Mean | Median | Sigma |
| A | 10 | 83 | 35036 | 6437.15 | 17 | 17 | 5.4 |
| A | 9 | 143 | 2166 | 395.03 | 17 | 17 | 5.4 |
| A | 10 | 67 | 2161 | 394.11 | 17 | 17 | 5.4 |
| B | 5 | 236 | 104546 | 22037.47 | 14 | 14 | 4.7 |
| B | 5 | 200 | 5072 | 1066.33 | 14 | 14 | 4.7 |
| B | 0 | 213 | 2697 | 565.63 | 14 | 14 | 4.7 |
| C | 0 | 10 | 27044 | 4720.23 | 17 | 17 | 5.7 |
| C | 15 | 214 | 8100 | 1411.69 | 17 | 17 | 5.7 |
| C | 1 | 23 | 748 | 127.67 | 17 | 17 | 5.7 |
| D | 2 | 153 | 9504 | 1559.78 | 17 | 16 | 6.1 |
| D | 12 | 235 | 8201 | 1345.58 | 17 | 16 | 6.1 |
| D | 2 | 120 | 2593 | 423.65 | 17 | 16 | 6.1 |
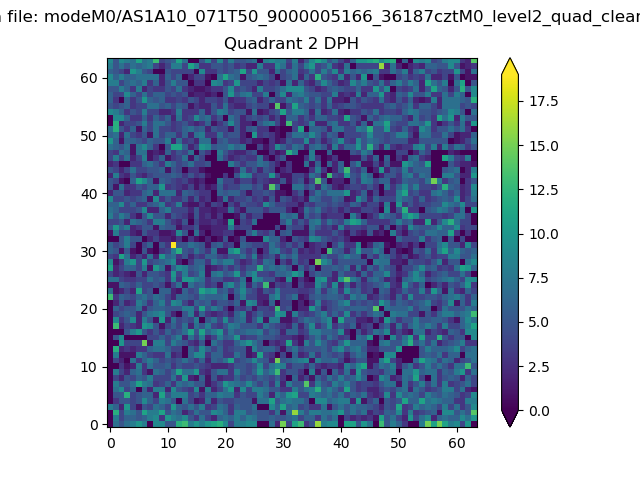
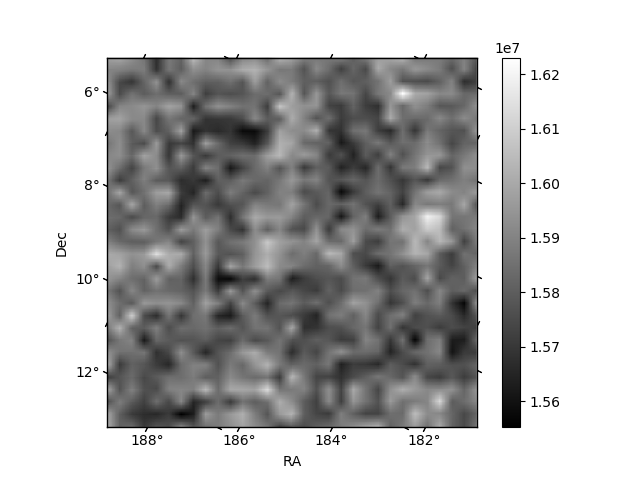
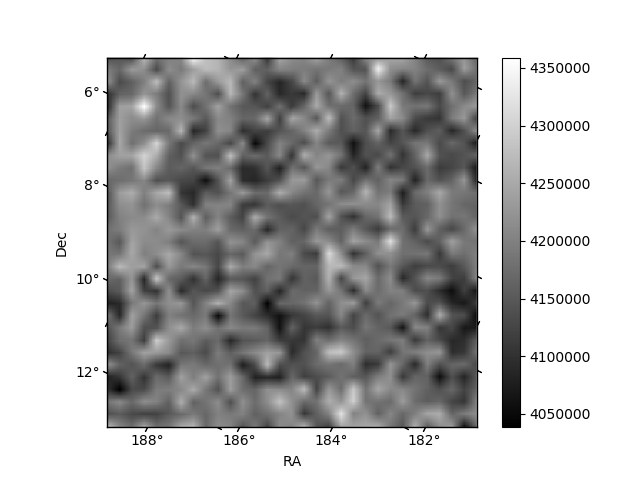
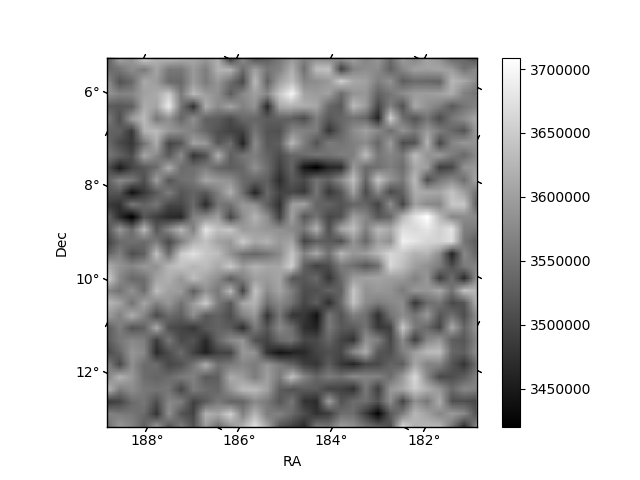
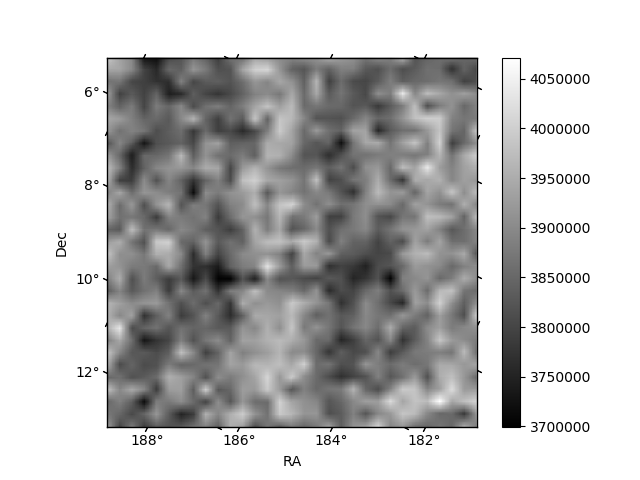
Histogram calculated using DETX and DETY for each event in the final _common_clean file
| Quadrant A | 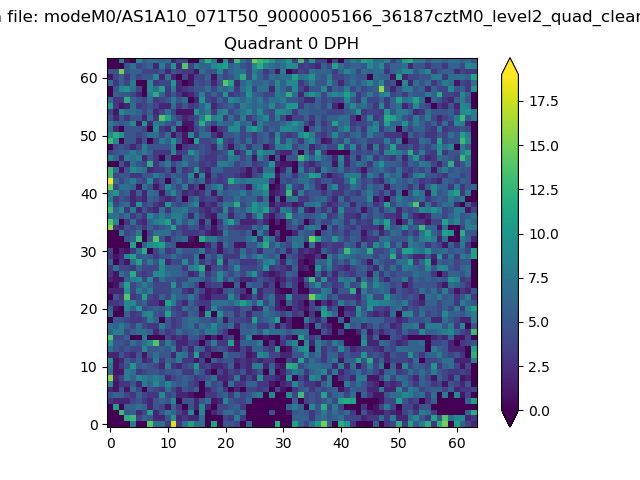 |
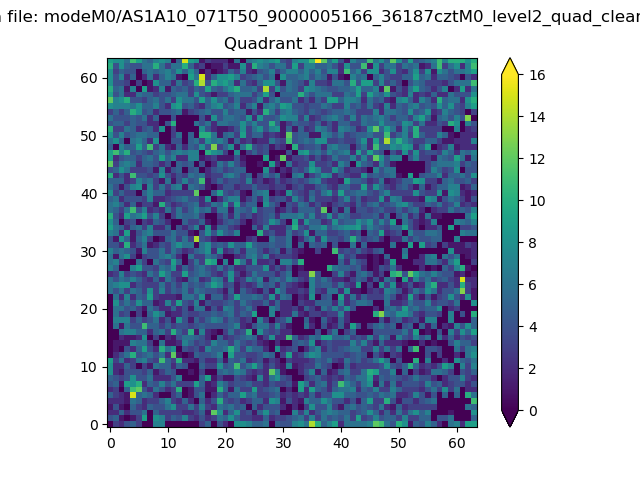 |
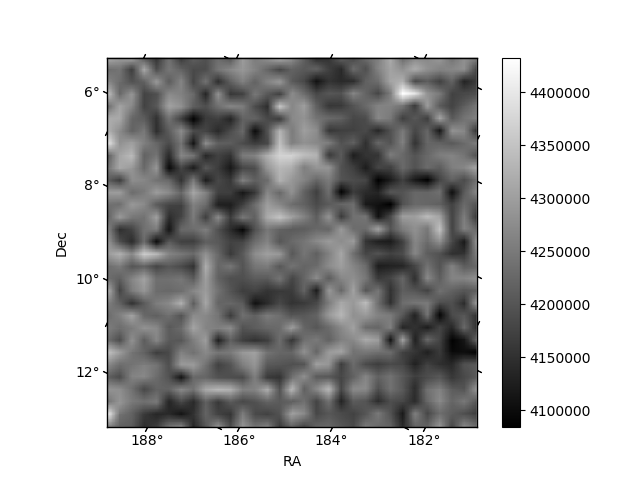
Quadrant B |
|---|---|---|---|
| Quadrant D | 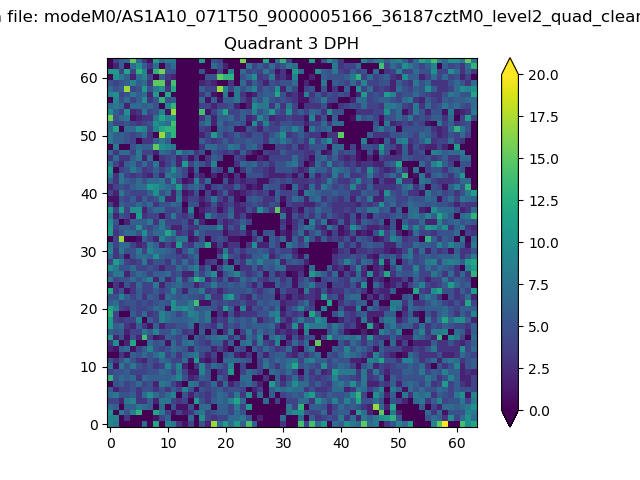 |
 |
Quadrant C |
| Plot type | Count rate plots | Images |
|---|---|---|
| Comparison with Poisson distribution Blue bars denote a histogram of data divided into 1 sec bins. Red curve is a Poisson curve with rate = median count rate of data. |
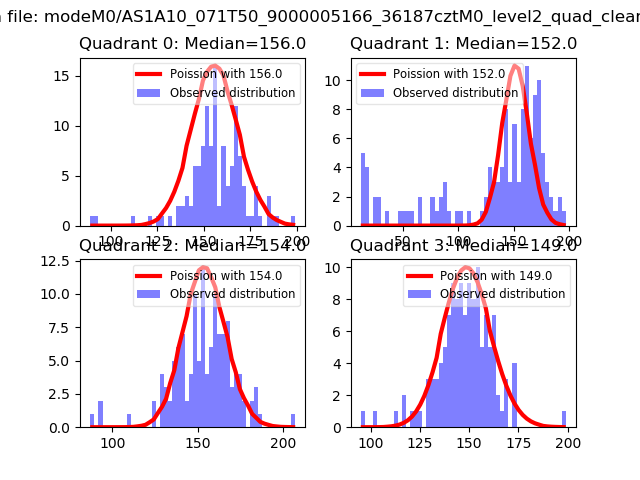 |
 |
| Quadrant-wise count rates Data is divided into 100 sec bins |
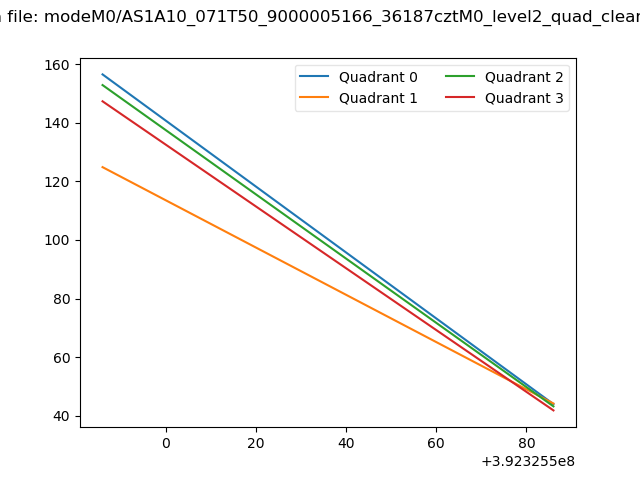 |
|
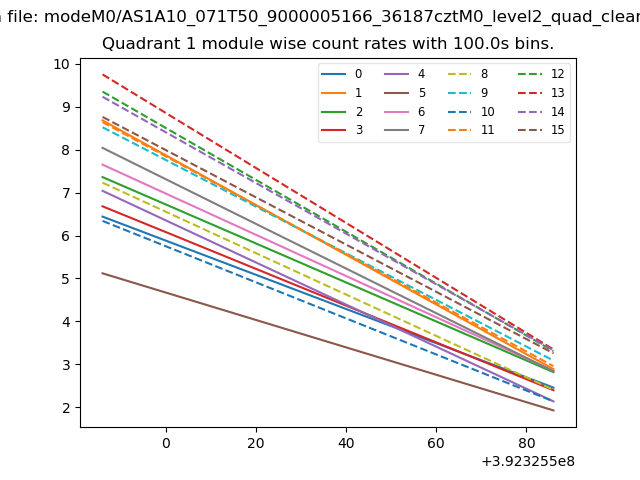
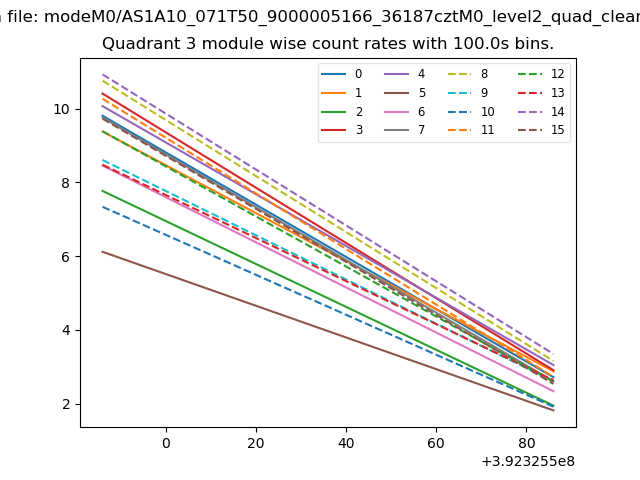
| Module-wise count rates for Quadrant A Data is divided into 100 sec bins |
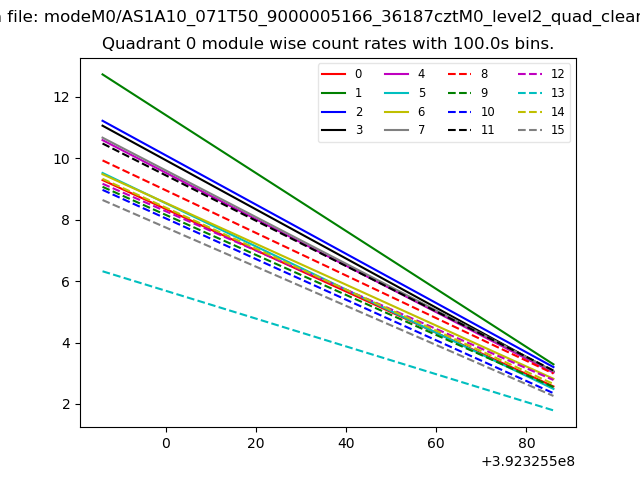 |
 |
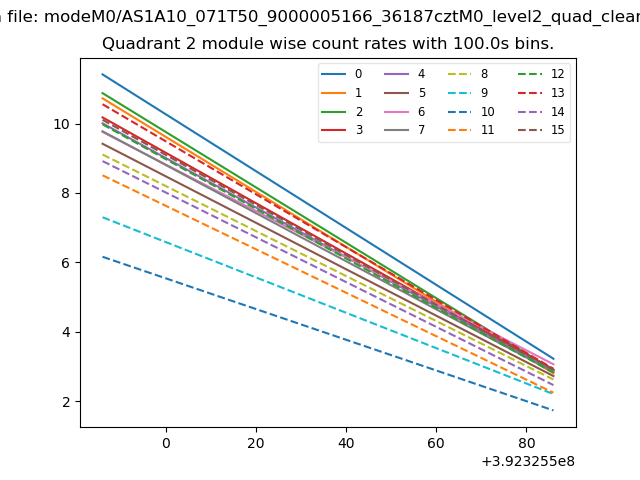
| Module-wise count rates for Quadrant B Data is divided into 100 sec bins |
 |
 |
| Module-wise count rates for Quadrant C Data is divided into 100 sec bins |
 |
 |
| Module-wise count rates for Quadrant D Data is divided into 100 sec bins |
 |
 |
| Parameter | Plot |
|---|---|
| CZT HV Monitor | 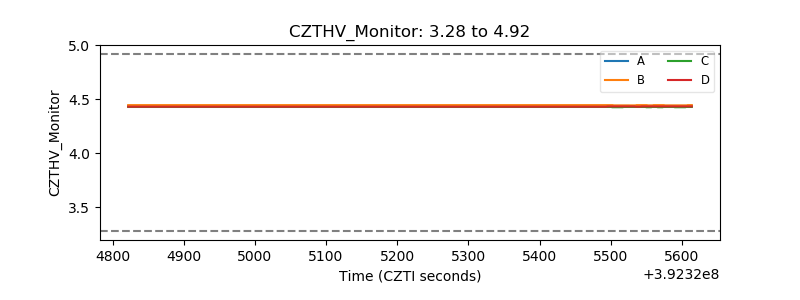 |
| D_VDD | 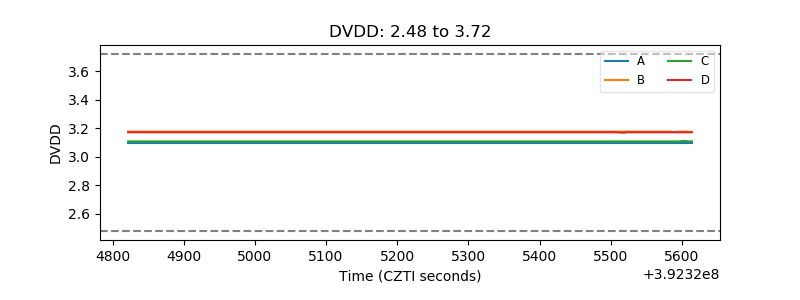 |
| Temperature 1 | 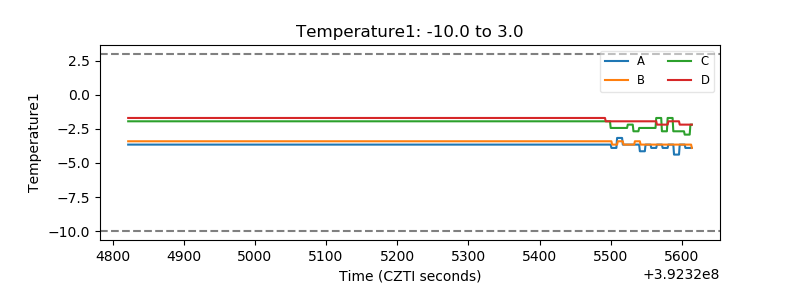 |
| Veto HV Monitor |  |
| Veto LLD | 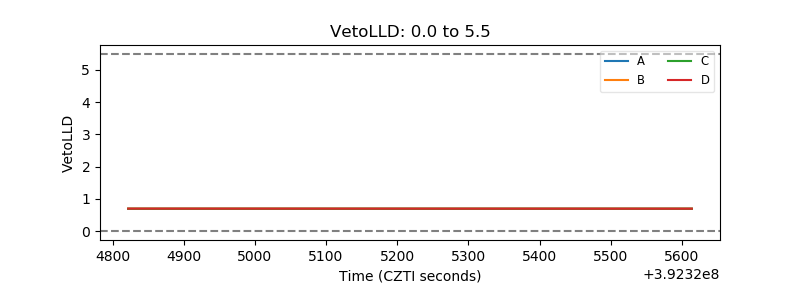 |
| Alpha Counter | 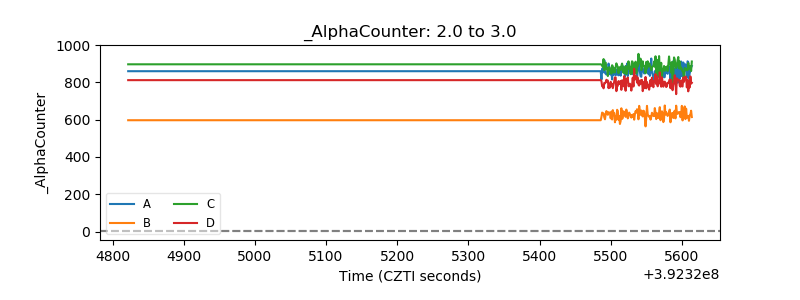 |
| _CPM_Rate | 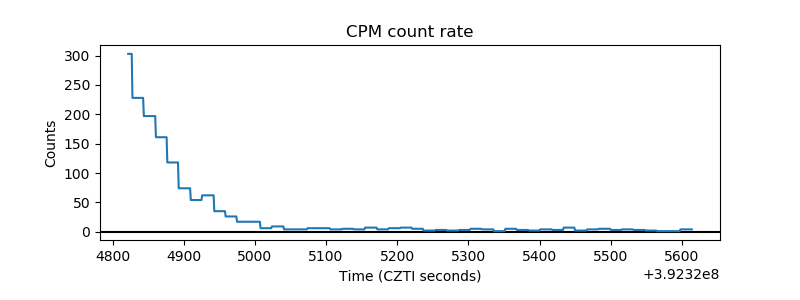 |
| CZT Counter | 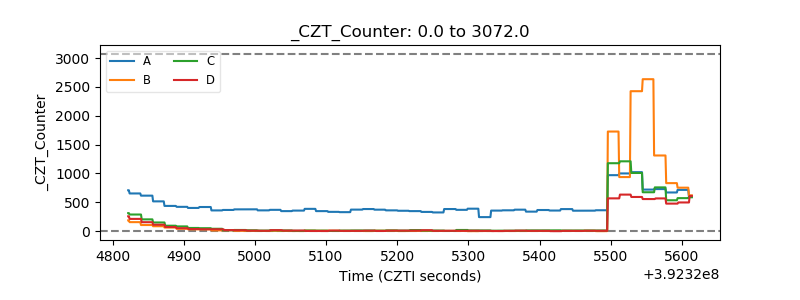 |
| +2.5 Volts monitor | 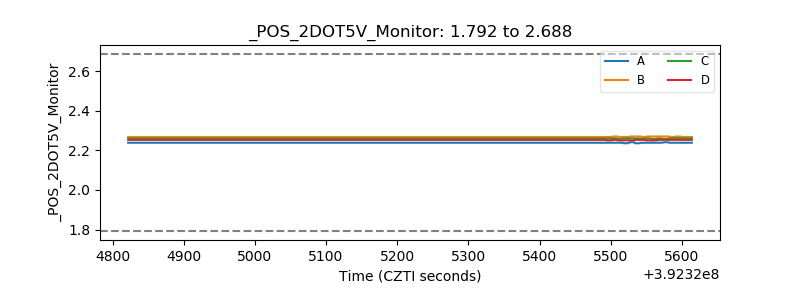 |
| +5 Volts monitor | 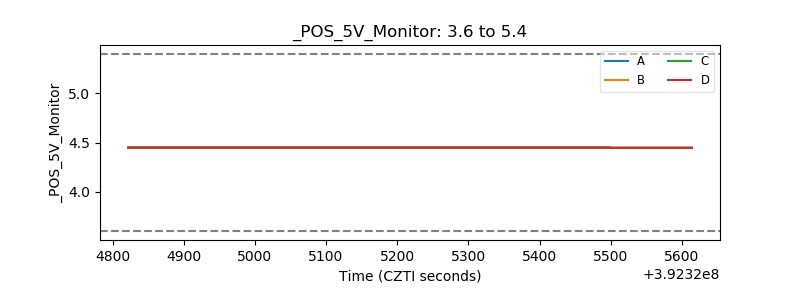 |
| _ROLL_ROT | 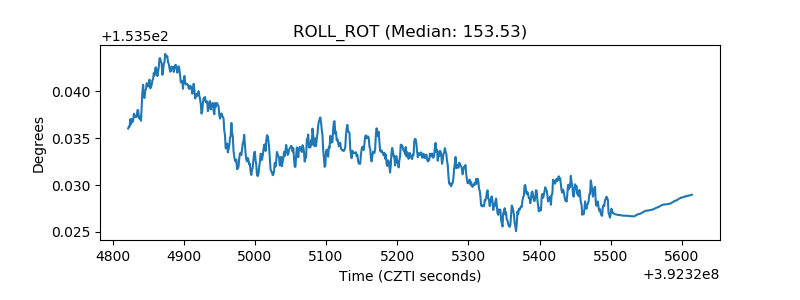 |
| _Roll_DEC | 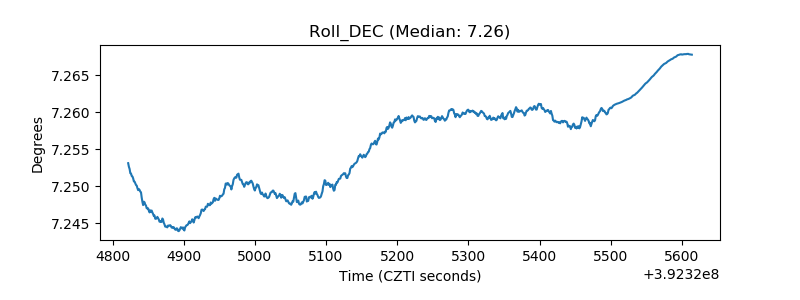 |
| _Roll_RA | 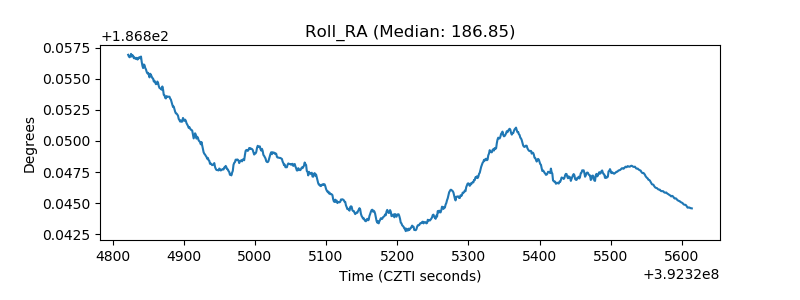 |
| Veto Counter | 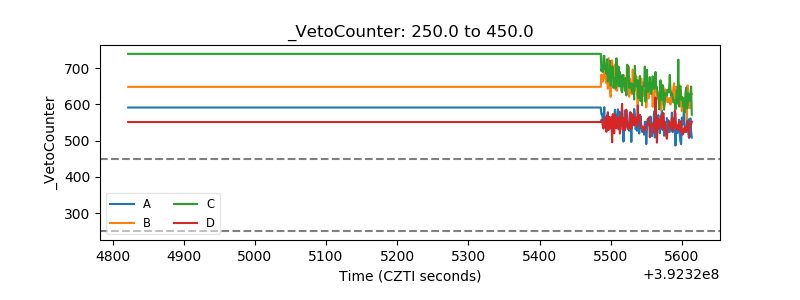 |