| Param | Original file | Final file |
|---|---|---|
| Filename | modeM0/AS1A10_071T50_9000005166_36186cztM0_level2.evt | modeM0/AS1A10_071T50_9000005166_36186cztM0_level2_quad_clean.evt |
| Size (bytes) | 379,287,360 | 49,256,640 |
| Size | 361.7 MB | 47.0 MB |
| Events in quadrant A | 2,263,243 | 301,567 |
| Events in quadrant B | 2,804,480 | 295,150 |
| Events in quadrant C | 2,554,795 | 298,857 |
| Events in quadrant D | 3,554,550 | 275,502 |
| Mode M0 | |||
|---|---|---|---|
| Quadrant | BADHDUFLAG | Total packets | Discarded packets |
| A | 0 | 9632 | 2 |
| B | 0 | 11242 | 2 |
| C | 0 | 10375 | 2 |
| D | 0 | 13568 | 2 |
| Mode M9 | |||
|---|---|---|---|
| Quadrant | BADHDUFLAG | Total packets | Discarded packets |
| A | 0 | 24 | 0 |
| B | 0 | 24 | 0 |
| C | 0 | 24 | 0 |
| D | 0 | 25 | 0 |
| Mode SS | |||
|---|---|---|---|
| Quadrant | BADHDUFLAG | Total packets | Discarded packets |
| A | 0 | 94 | 0 |
| B | 0 | 94 | 0 |
| C | 0 | 94 | 0 |
| D | 0 | 94 | 0 |
| Quadrant | Total seconds | Saturated seconds | Saturation percentage |
|---|---|---|---|
| A | 4547 | 14 | 0.307895% |
| B | 4547 | 179 | 3.936662% |
| C | 4547 | 38 | 0.835716% |
| D | 4547 | 401 | 8.819002% |
Noise dominated data is calculated using 1-second bins in cleaned event files. If a bin has >2000 counts, and if more than 50% of those come from <1% of pixels, then it is considered to be noise-dominated and hence unusable.
| Quadrant | # 1 sec bins | Bins with >0 counts | Bins with >2000 counts | High rate bins dominated by noise | Noise dominated (total time) | Noise dominated (detector-on time) | Marked lightcurve |
|---|---|---|---|---|---|---|---|
| A | 6400 | 4548 | 4 | 4 | 0.06% | 0.09% | 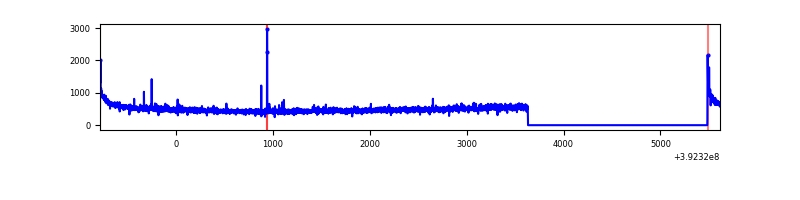 |
| B | 6400 | 4548 | 124 | 124 | 1.94% | 2.73% | 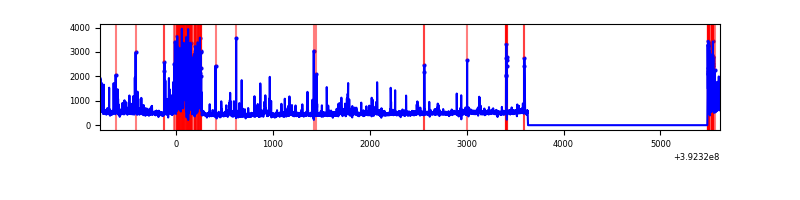 |
| C | 6400 | 4548 | 25 | 25 | 0.39% | 0.55% | 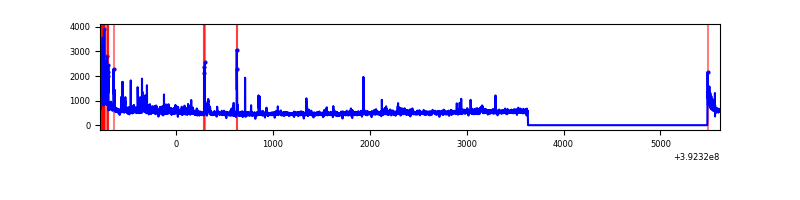 |
| D | 6400 | 4548 | 363 | 363 | 5.67% | 7.98% | 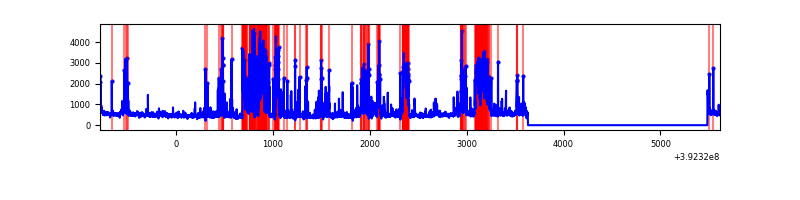 |
Top three noisy pixels from each quadrant. If the there are fewer than three noisy pixels in the level2.evt file, extra rows are filled as -1
| Pixel properties | Quadrant properties | ||||||
|---|---|---|---|---|---|---|---|
| Quadrant | DetID | PixID | Counts | Sigma | Mean | Median | Sigma |
| A | 10 | 83 | 152914 | 1414.26 | 530 | 521 | 107.8 |
| A | 8 | 144 | 33522 | 306.26 | 530 | 521 | 107.8 |
| A | 9 | 143 | 14368 | 128.51 | 530 | 521 | 107.8 |
| B | 5 | 236 | 514175 | 5058.62 | 521 | 507 | 101.5 |
| B | 5 | 172 | 196639 | 1931.52 | 521 | 507 | 101.5 |
| B | 5 | 200 | 13536 | 128.31 | 521 | 507 | 101.5 |
| C | 15 | 214 | 204018 | 1681.18 | 517 | 521 | 121.0 |
| C | 0 | 10 | 167356 | 1378.3 | 517 | 521 | 121.0 |
| C | 1 | 23 | 48847 | 399.24 | 517 | 521 | 121.0 |
| D | 13 | 249 | 625400 | 5124.91 | 495 | 483 | 121.9 |
| D | 12 | 6 | 591940 | 4850.51 | 495 | 483 | 121.9 |
| D | 2 | 250 | 114360 | 933.9 | 495 | 483 | 121.9 |
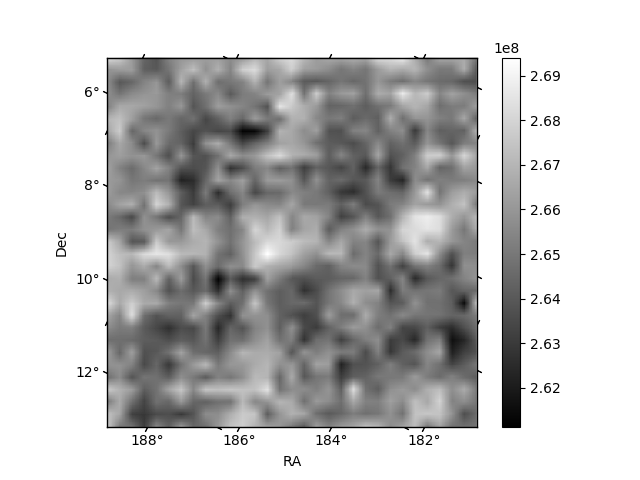
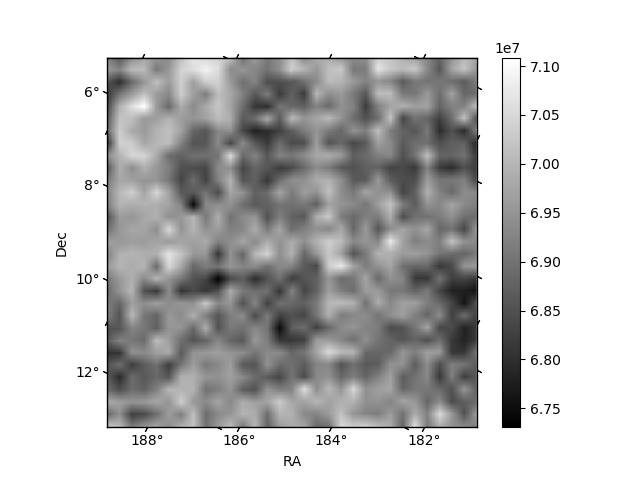
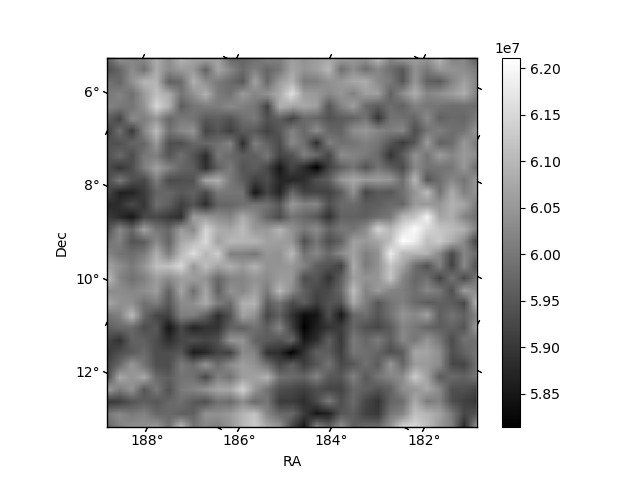
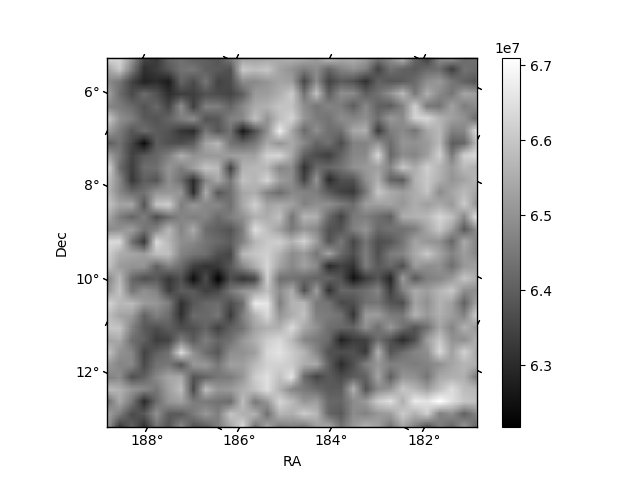
Histogram calculated using DETX and DETY for each event in the final _common_clean file
| Quadrant A | 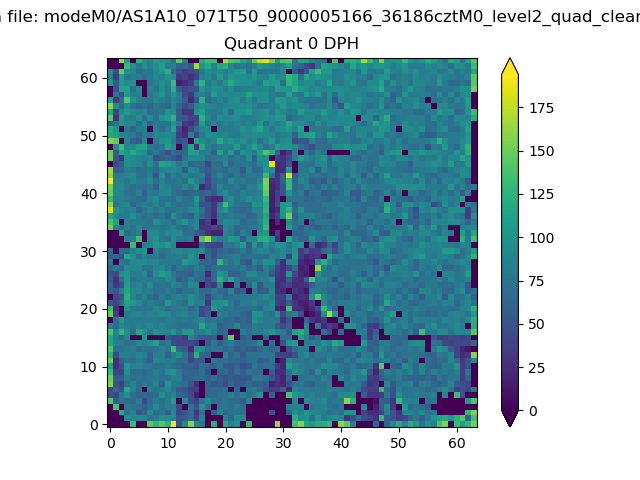 |
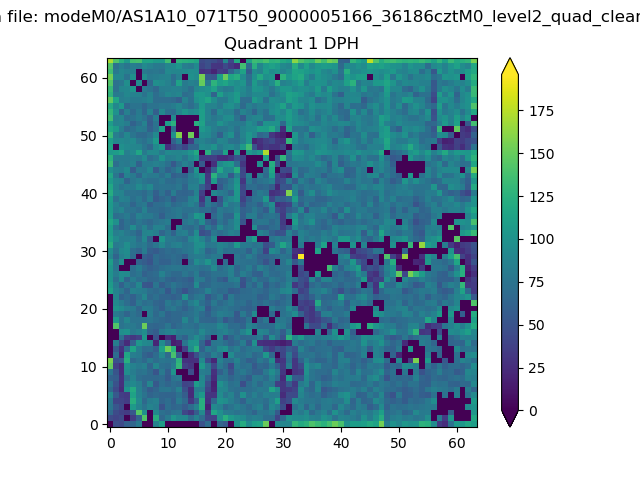 |
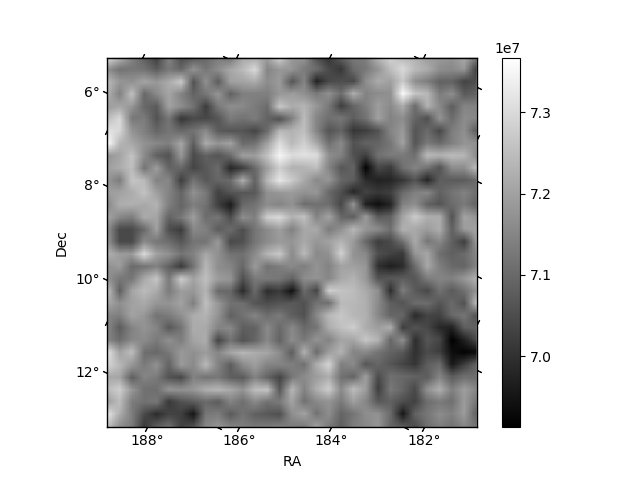
Quadrant B |
|---|---|---|---|
| Quadrant D | 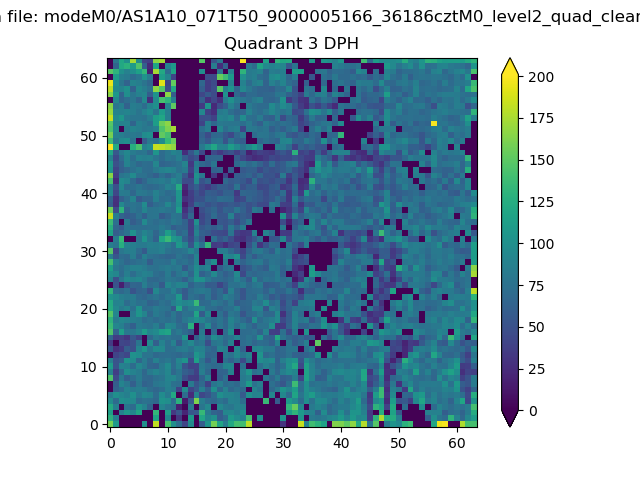 |
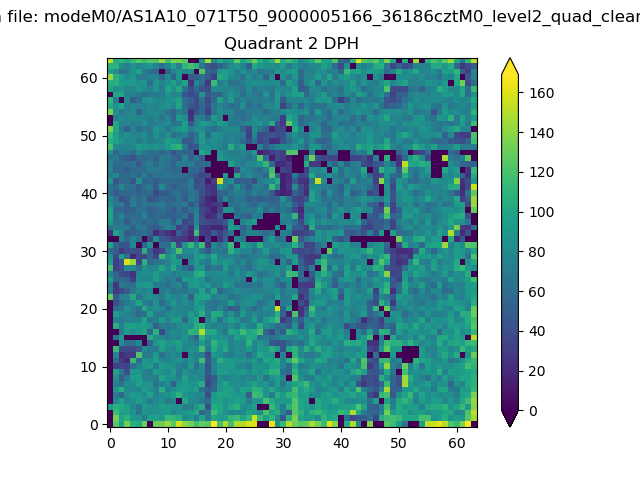 |
Quadrant C |
| Plot type | Count rate plots | Images |
|---|---|---|
| Comparison with Poisson distribution Blue bars denote a histogram of data divided into 1 sec bins. Red curve is a Poisson curve with rate = median count rate of data. |
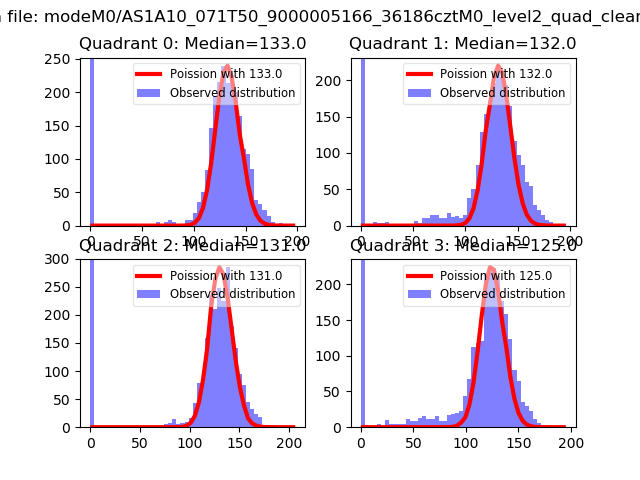 |
 |
| Quadrant-wise count rates Data is divided into 100 sec bins |
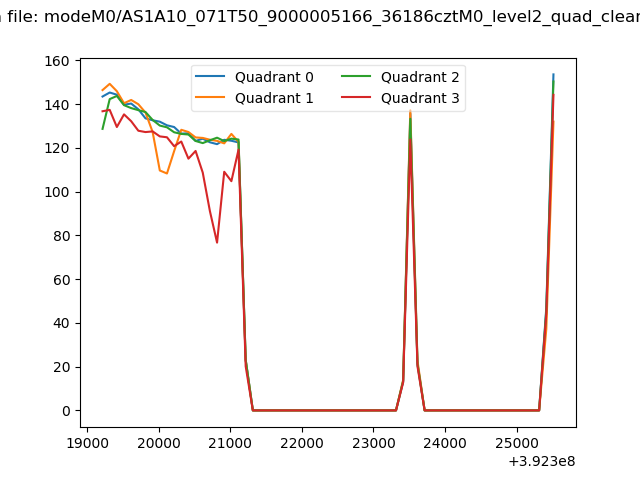 |
|
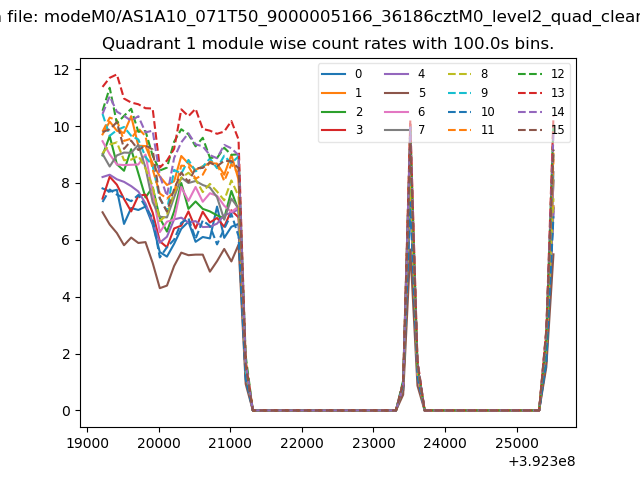
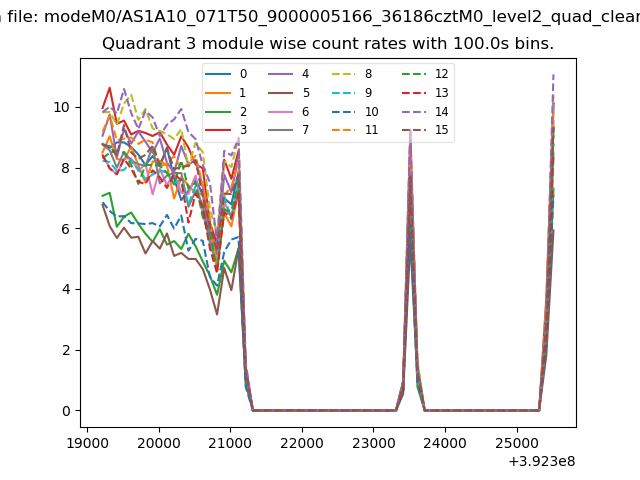
| Module-wise count rates for Quadrant A Data is divided into 100 sec bins |
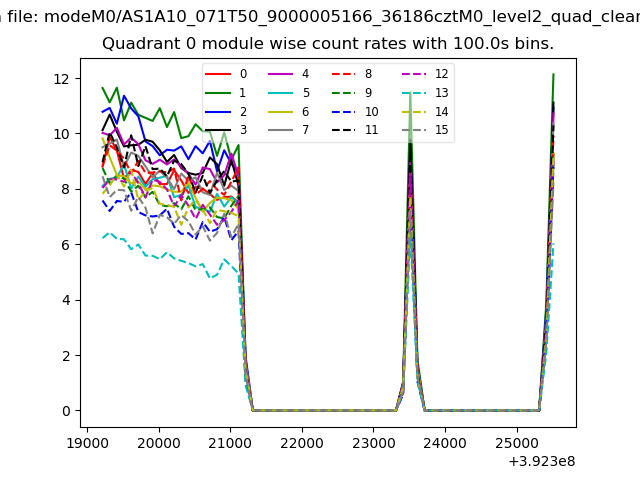 |
 |
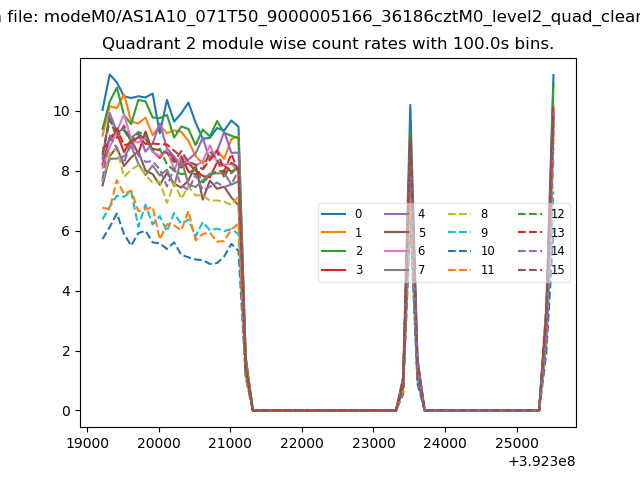
| Module-wise count rates for Quadrant B Data is divided into 100 sec bins |
 |
 |
| Module-wise count rates for Quadrant C Data is divided into 100 sec bins |
 |
 |
| Module-wise count rates for Quadrant D Data is divided into 100 sec bins |
 |
 |
| Parameter | Plot |
|---|---|
| CZT HV Monitor | 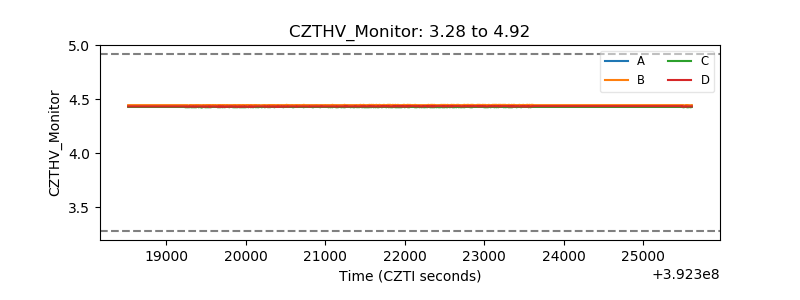 |
| D_VDD | 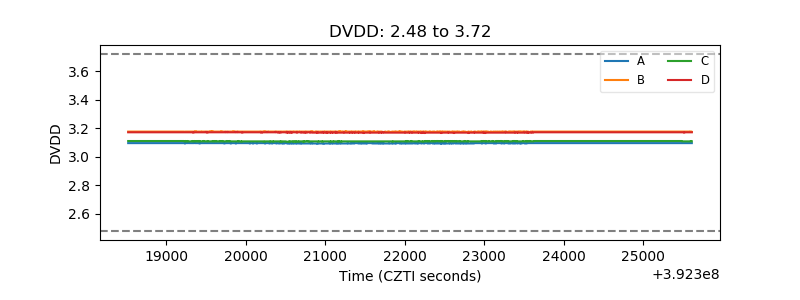 |
| Temperature 1 | 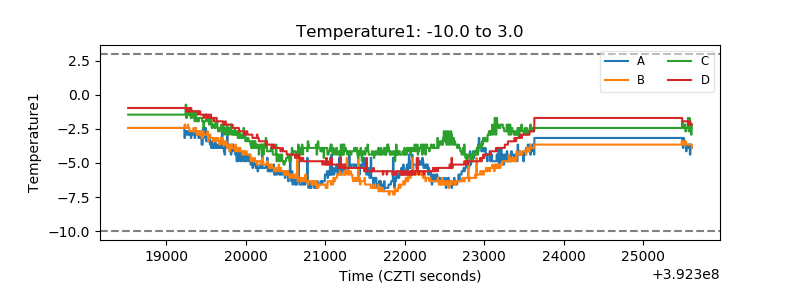 |
| Veto HV Monitor | 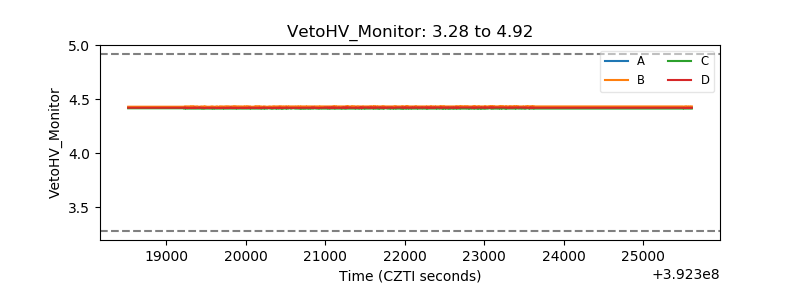 |
| Veto LLD | 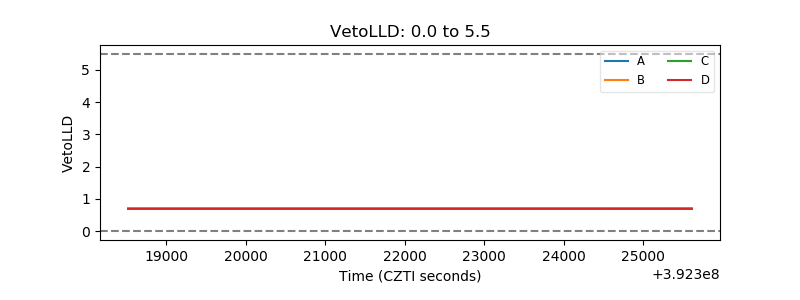 |
| Alpha Counter | 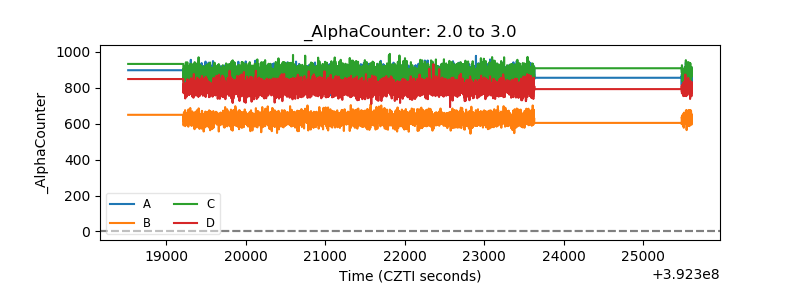 |
| _CPM_Rate | 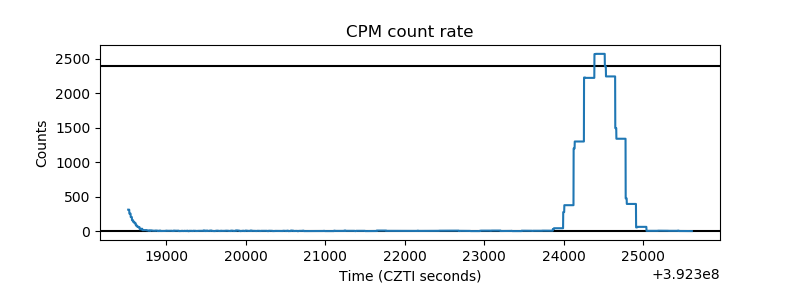 |
| CZT Counter | 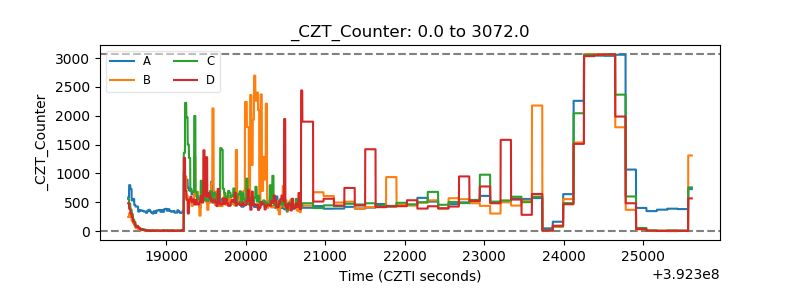 |
| +2.5 Volts monitor | 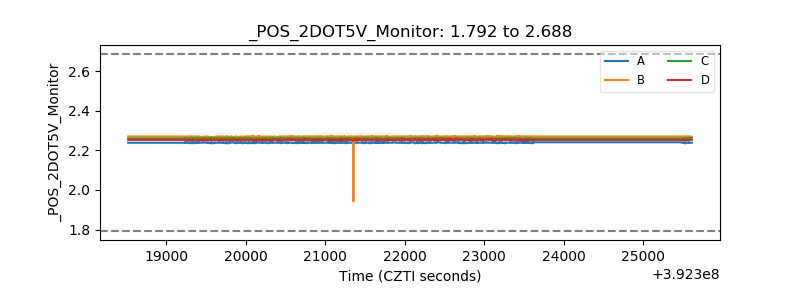 |
| +5 Volts monitor | 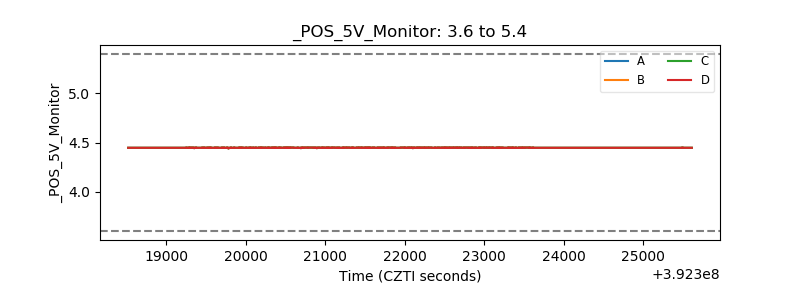 |
| _ROLL_ROT | 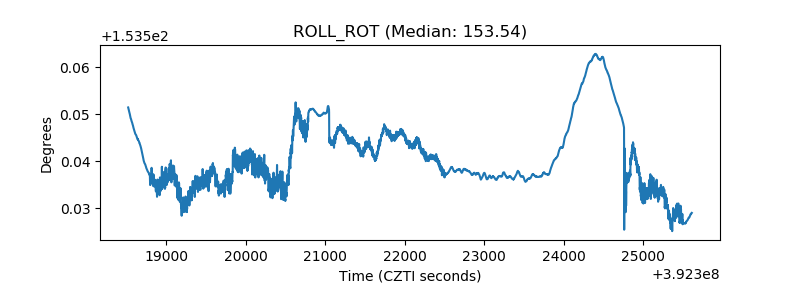 |
| _Roll_DEC | 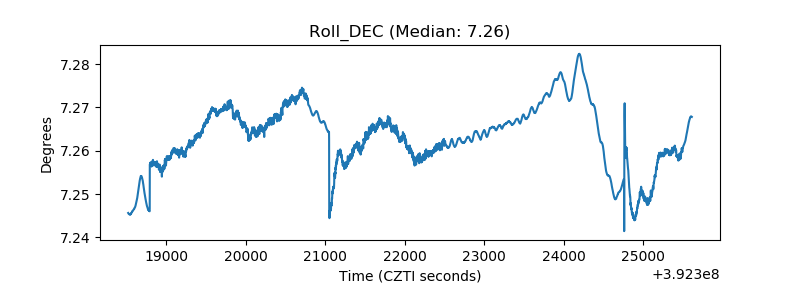 |
| _Roll_RA | 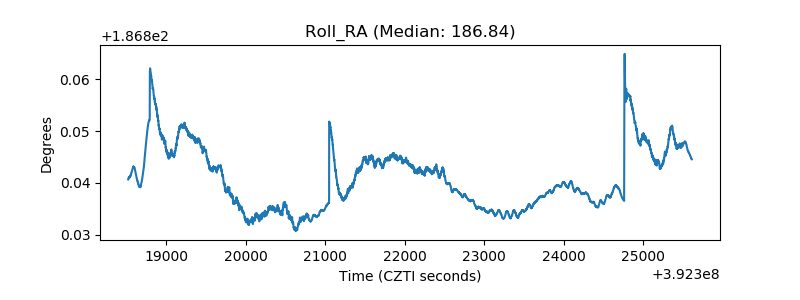 |
| Veto Counter | 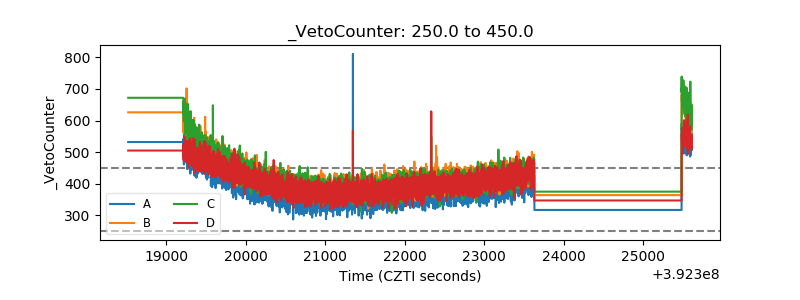 |