| Param | Original file | Final file |
|---|---|---|
| Filename | modeM0/AS1A10_071T50_9000005166_36184cztM0_level2.evt | modeM0/AS1A10_071T50_9000005166_36184cztM0_level2_quad_clean.evt |
| Size (bytes) | 463,271,040 | 65,056,320 |
| Size | 441.8 MB | 62.0 MB |
| Events in quadrant A | 2,610,826 | 415,760 |
| Events in quadrant B | 3,012,507 | 410,874 |
| Events in quadrant C | 3,835,359 | 406,231 |
| Events in quadrant D | 4,207,808 | 361,653 |
| Mode M0 | |||
|---|---|---|---|
| Quadrant | BADHDUFLAG | Total packets | Discarded packets |
| A | 0 | 11219 | 3 |
| B | 0 | 12471 | 2 |
| C | 0 | 14994 | 2 |
| D | 0 | 16111 | 2 |
| Mode M9 | |||
|---|---|---|---|
| Quadrant | BADHDUFLAG | Total packets | Discarded packets |
| A | 0 | 23 | 0 |
| B | 0 | 23 | 0 |
| C | 0 | 23 | 0 |
| D | 0 | 24 | 0 |
| Mode SS | |||
|---|---|---|---|
| Quadrant | BADHDUFLAG | Total packets | Discarded packets |
| A | 0 | 108 | 0 |
| B | 0 | 108 | 0 |
| C | 0 | 108 | 0 |
| D | 0 | 108 | 0 |
| Quadrant | Total seconds | Saturated seconds | Saturation percentage |
|---|---|---|---|
| A | 5363 | 15 | 0.279694% |
| B | 5363 | 115 | 2.144322% |
| C | 5363 | 132 | 2.461309% |
| D | 5363 | 470 | 8.763752% |
Noise dominated data is calculated using 1-second bins in cleaned event files. If a bin has >2000 counts, and if more than 50% of those come from <1% of pixels, then it is considered to be noise-dominated and hence unusable.
| Quadrant | # 1 sec bins | Bins with >0 counts | Bins with >2000 counts | High rate bins dominated by noise | Noise dominated (total time) | Noise dominated (detector-on time) | Marked lightcurve |
|---|---|---|---|---|---|---|---|
| A | 7065 | 5364 | 1 | 1 | 0.01% | 0.02% | 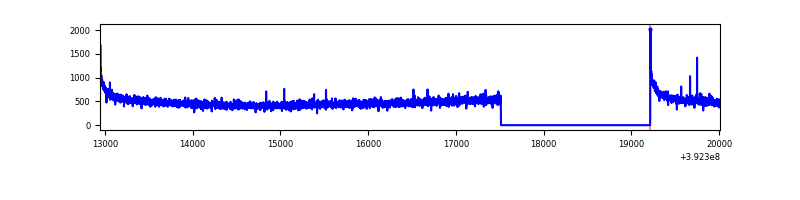 |
| B | 7065 | 5364 | 66 | 66 | 0.93% | 1.23% | 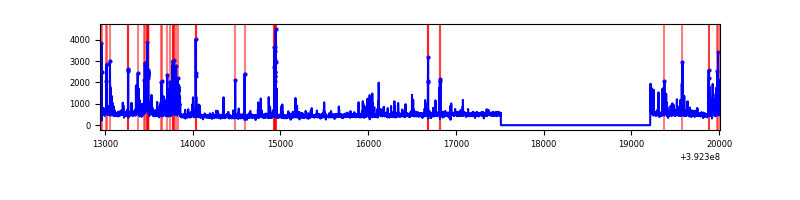 |
| C | 7065 | 5364 | 125 | 125 | 1.77% | 2.33% | 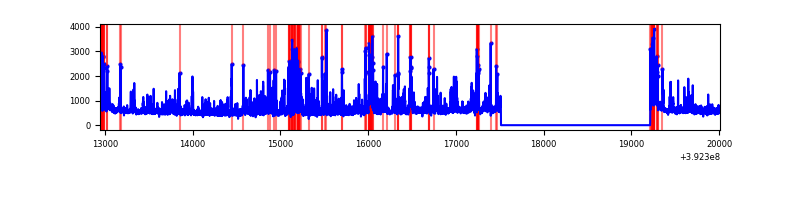 |
| D | 7065 | 5364 | 421 | 421 | 5.96% | 7.85% | 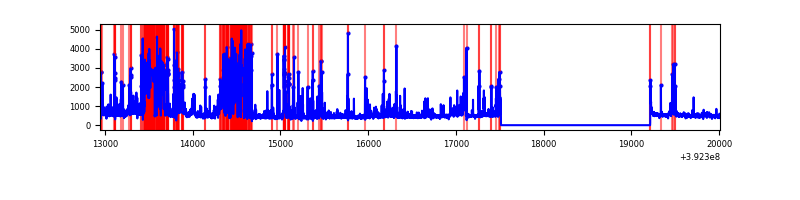 |
Top three noisy pixels from each quadrant. If the there are fewer than three noisy pixels in the level2.evt file, extra rows are filled as -1
| Pixel properties | Quadrant properties | ||||||
|---|---|---|---|---|---|---|---|
| Quadrant | DetID | PixID | Counts | Sigma | Mean | Median | Sigma |
| A | 10 | 83 | 181767 | 1454.55 | 618 | 605 | 124.5 |
| A | 8 | 144 | 21978 | 171.6 | 618 | 605 | 124.5 |
| A | 13 | 6 | 11169 | 84.82 | 618 | 605 | 124.5 |
| B | 5 | 172 | 322405 | 2768.01 | 609 | 592 | 116.3 |
| B | 5 | 236 | 223579 | 1917.98 | 609 | 592 | 116.3 |
| B | 0 | 213 | 23832 | 199.89 | 609 | 592 | 116.3 |
| C | 4 | 254 | 643861 | 4584.55 | 599 | 604 | 140.3 |
| C | 0 | 10 | 320434 | 2279.45 | 599 | 604 | 140.3 |
| C | 15 | 214 | 242860 | 1726.58 | 599 | 604 | 140.3 |
| D | 13 | 249 | 1154972 | 8047.9 | 576 | 561 | 143.4 |
| D | 12 | 6 | 182936 | 1271.42 | 576 | 561 | 143.4 |
| D | 2 | 250 | 129537 | 899.15 | 576 | 561 | 143.4 |
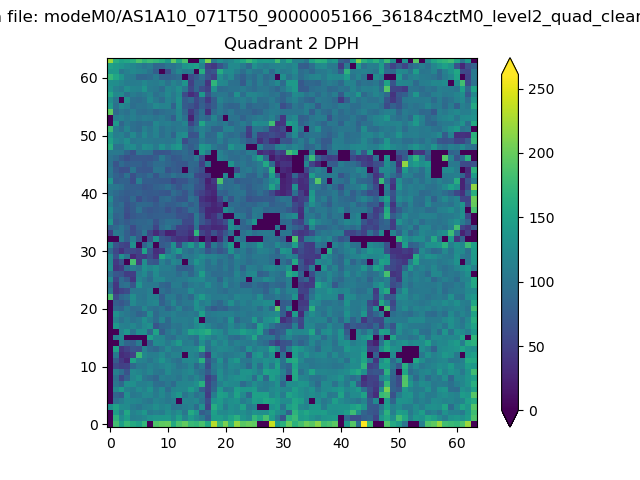
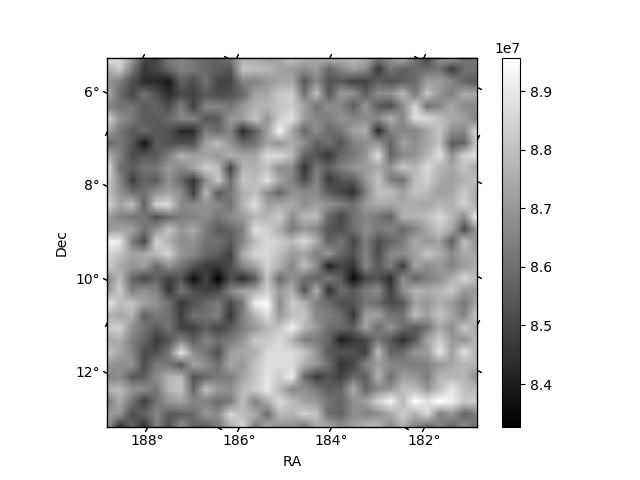
Histogram calculated using DETX and DETY for each event in the final _common_clean file
| Quadrant A | 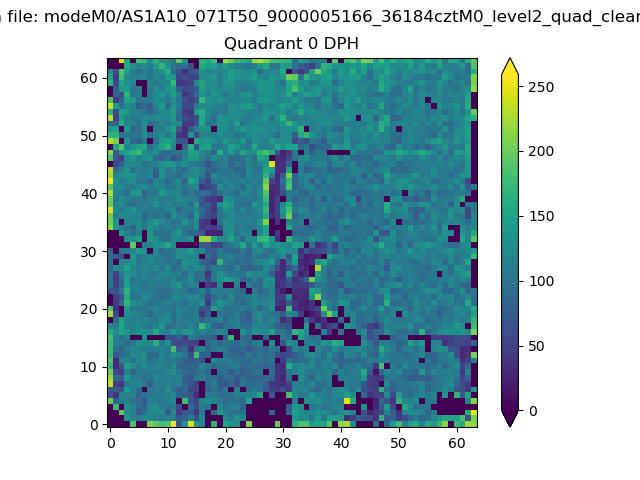 |
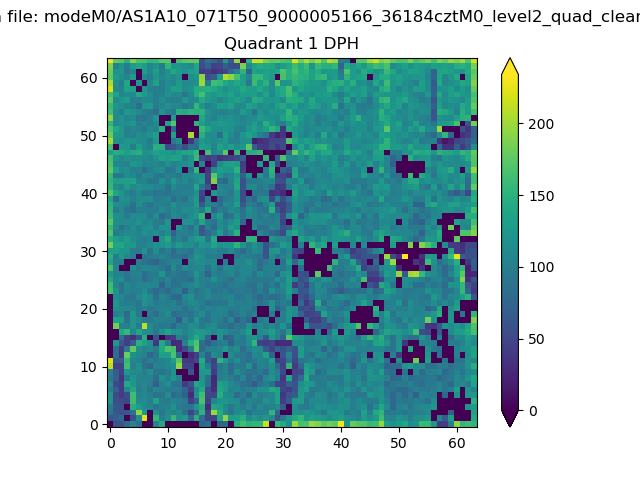 |
Quadrant B |
|---|---|---|---|
| Quadrant D | 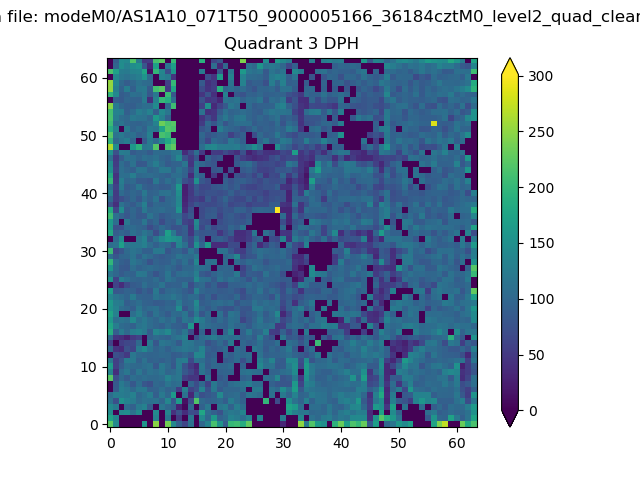 |
 |
Quadrant C |
| Plot type | Count rate plots | Images |
|---|---|---|
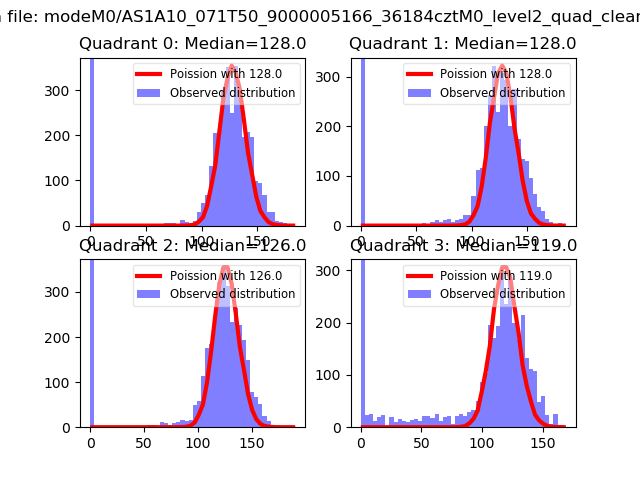
| Comparison with Poisson distribution Blue bars denote a histogram of data divided into 1 sec bins. Red curve is a Poisson curve with rate = median count rate of data. |
 |
 |
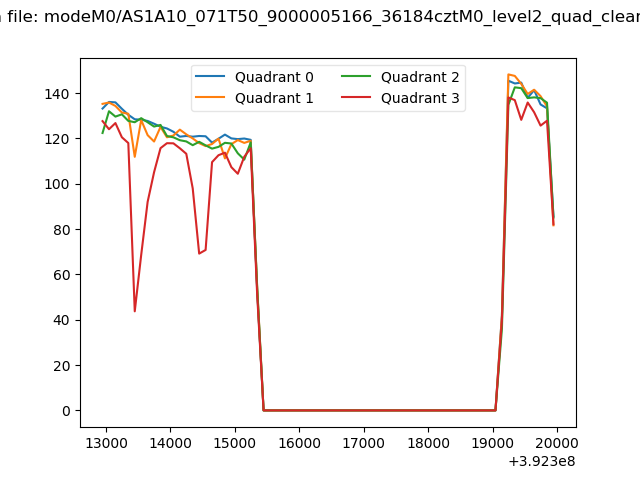
| Quadrant-wise count rates Data is divided into 100 sec bins |
 |
|
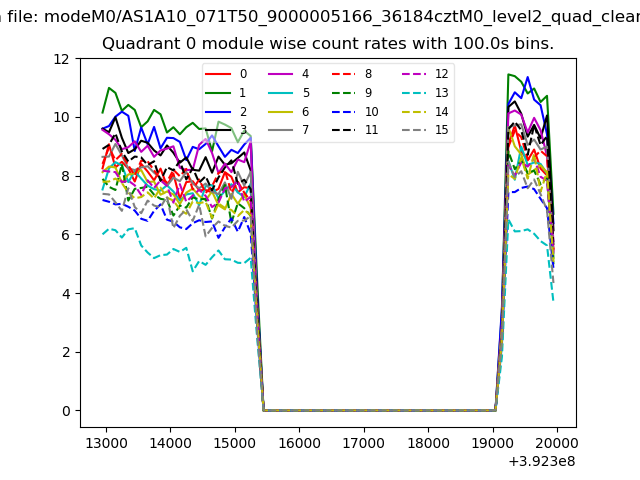
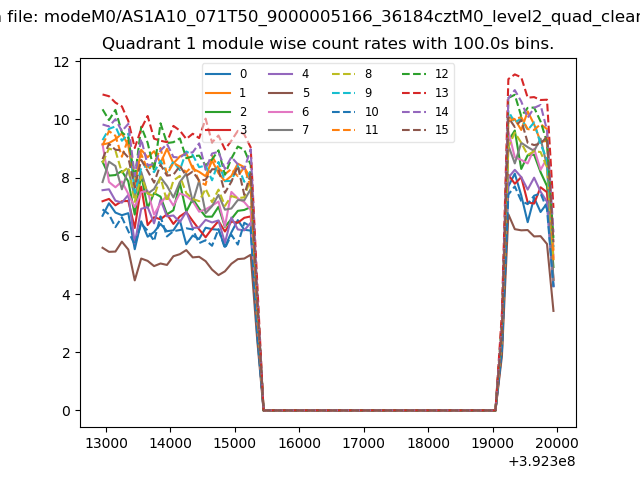
| Module-wise count rates for Quadrant A Data is divided into 100 sec bins |
 |
 |
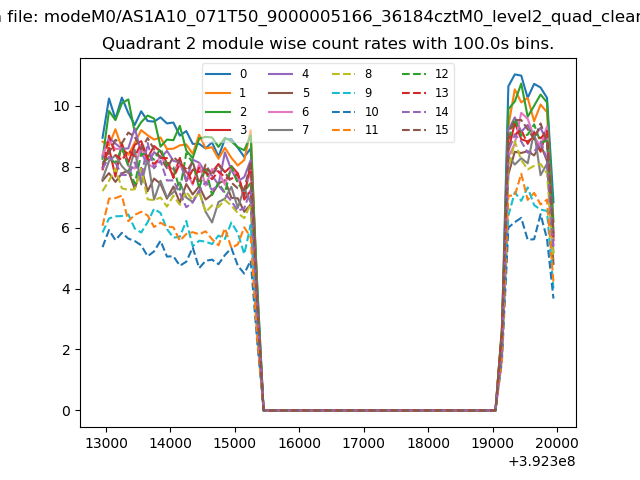
| Module-wise count rates for Quadrant B Data is divided into 100 sec bins |
 |
 |
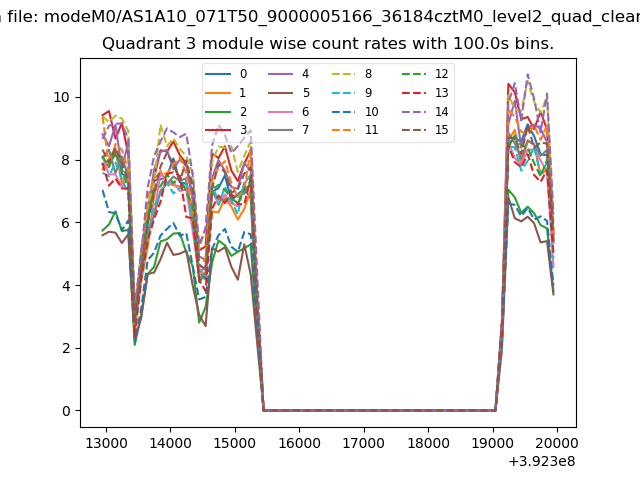
| Module-wise count rates for Quadrant C Data is divided into 100 sec bins |
 |
 |
| Module-wise count rates for Quadrant D Data is divided into 100 sec bins |
 |
 |
| Parameter | Plot |
|---|---|
| CZT HV Monitor | 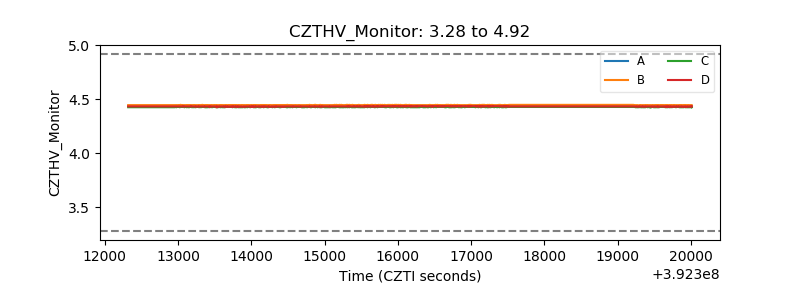 |
| D_VDD | 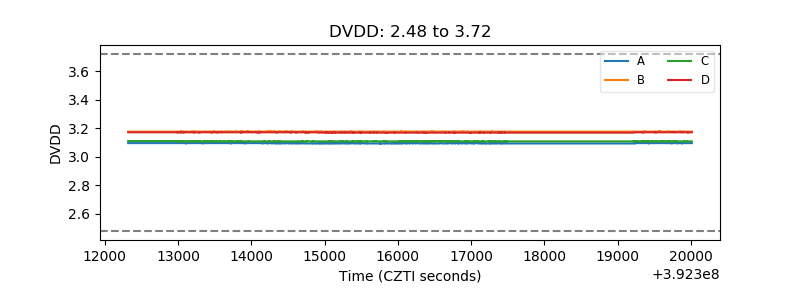 |
| Temperature 1 |  |
| Veto HV Monitor | 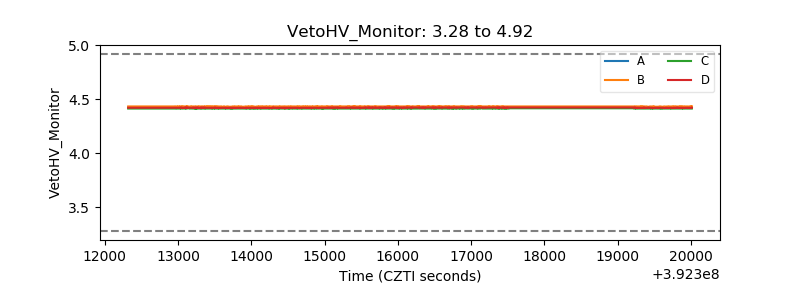 |
| Veto LLD | 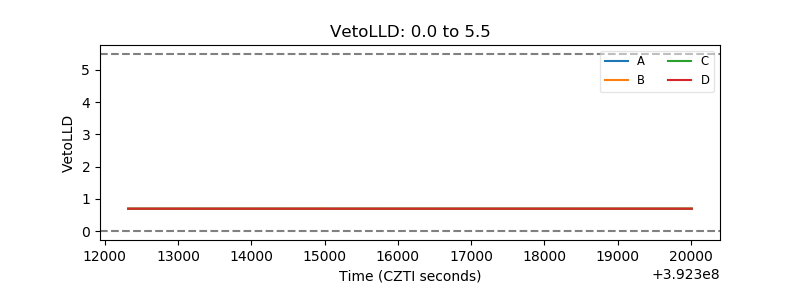 |
| Alpha Counter | 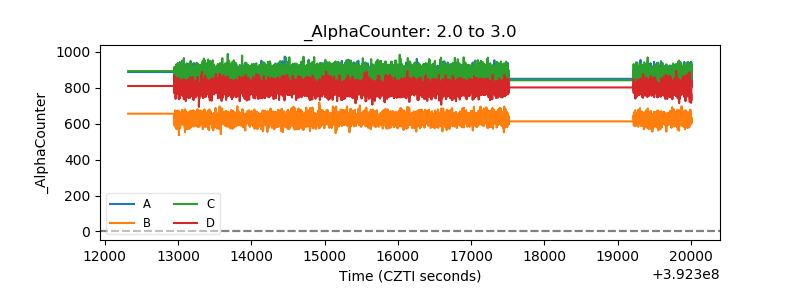 |
| _CPM_Rate | 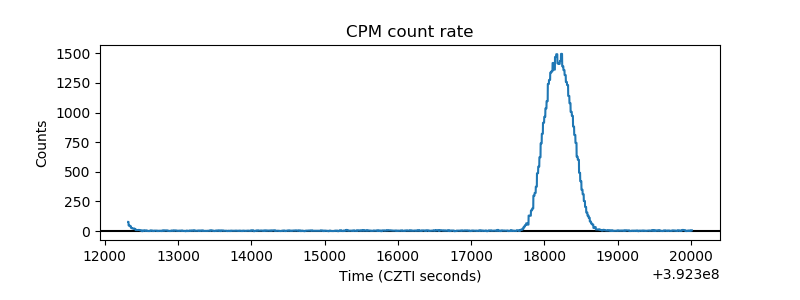 |
| CZT Counter | 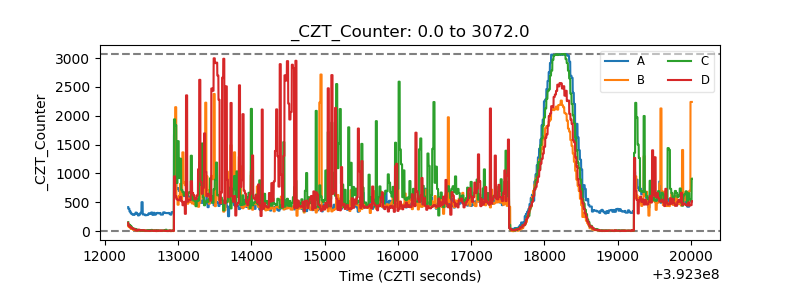 |
| +2.5 Volts monitor | 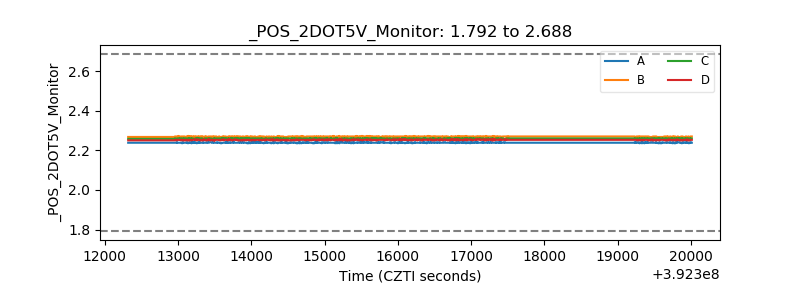 |
| +5 Volts monitor | 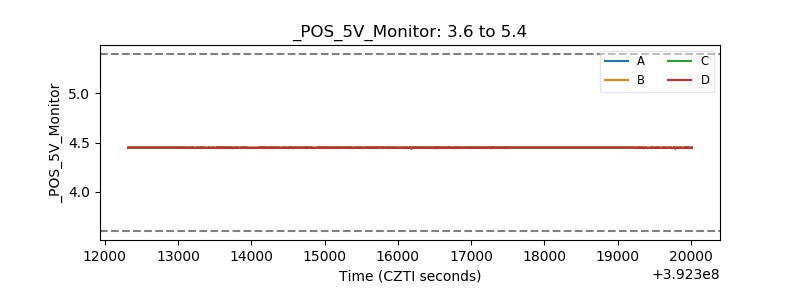 |
| _ROLL_ROT | 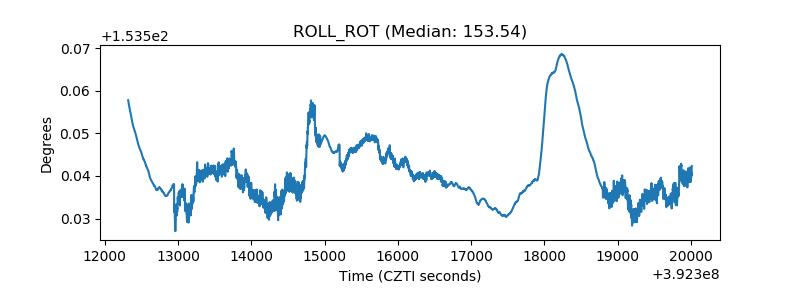 |
| _Roll_DEC | 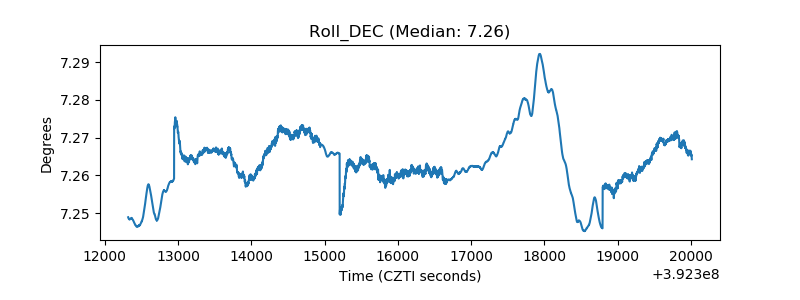 |
| _Roll_RA | 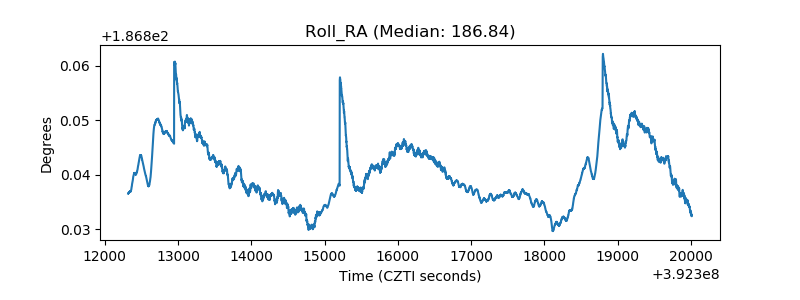 |
| Veto Counter | 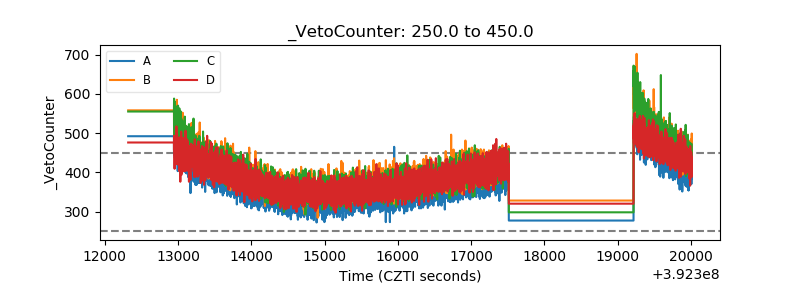 |