| Param | Original file | Final file |
|---|---|---|
| Filename | modeM0/AS1A10_071T50_9000005166_36183cztM0_level2.evt | modeM0/AS1A10_071T50_9000005166_36183cztM0_level2_quad_clean.evt |
| Size (bytes) | 660,481,920 | 70,914,240 |
| Size | 629.9 MB | 67.6 MB |
| Events in quadrant A | 2,711,884 | 474,492 |
| Events in quadrant B | 3,191,168 | 469,862 |
| Events in quadrant C | 9,792,791 | 377,939 |
| Events in quadrant D | 3,925,048 | 429,712 |
| Mode M0 | |||
|---|---|---|---|
| Quadrant | BADHDUFLAG | Total packets | Discarded packets |
| A | 0 | 11756 | 3 |
| B | 0 | 13181 | 2 |
| C | 0 | 32980 | 2 |
| D | 0 | 15337 | 2 |
| Mode M9 | |||
|---|---|---|---|
| Quadrant | BADHDUFLAG | Total packets | Discarded packets |
| A | 0 | 16 | 0 |
| B | 0 | 16 | 0 |
| C | 0 | 16 | 0 |
| D | 0 | 17 | 0 |
| Mode SS | |||
|---|---|---|---|
| Quadrant | BADHDUFLAG | Total packets | Discarded packets |
| A | 0 | 114 | 0 |
| B | 0 | 114 | 0 |
| C | 0 | 114 | 0 |
| D | 0 | 114 | 0 |
| Quadrant | Total seconds | Saturated seconds | Saturation percentage |
|---|---|---|---|
| A | 5644 | 12 | 0.212615% |
| B | 5644 | 135 | 2.391921% |
| C | 5644 | 2579 | 45.694543% |
| D | 5644 | 331 | 5.864635% |
Noise dominated data is calculated using 1-second bins in cleaned event files. If a bin has >2000 counts, and if more than 50% of those come from <1% of pixels, then it is considered to be noise-dominated and hence unusable.
| Quadrant | # 1 sec bins | Bins with >0 counts | Bins with >2000 counts | High rate bins dominated by noise | Noise dominated (total time) | Noise dominated (detector-on time) | Marked lightcurve |
|---|---|---|---|---|---|---|---|
| A | 7227 | 5645 | 0 | 0 | 0.00% | 0.00% | 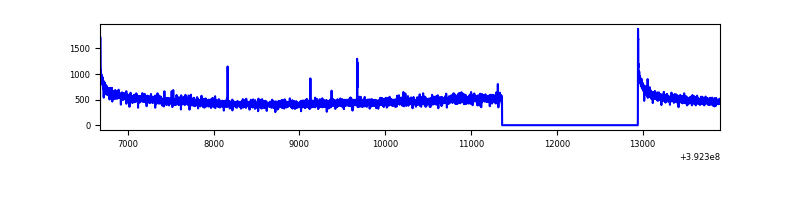 |
| B | 7227 | 5645 | 83 | 83 | 1.15% | 1.47% | 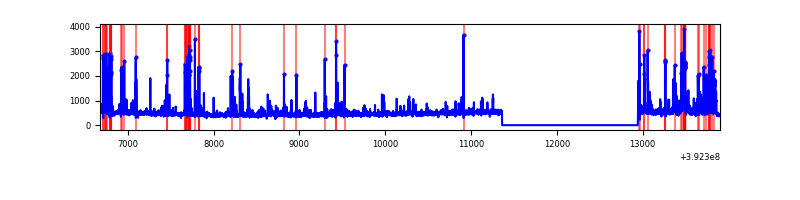 |
| C | 7227 | 5644 | 2193 | 2193 | 30.34% | 38.86% | 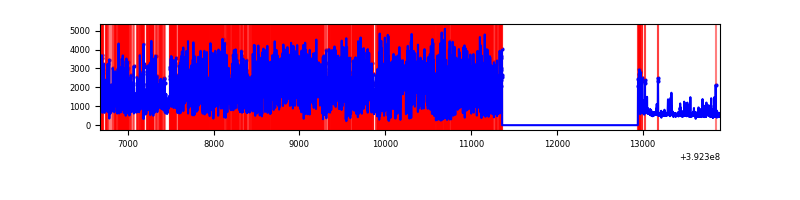 |
| D | 7227 | 5645 | 299 | 299 | 4.14% | 5.30% | 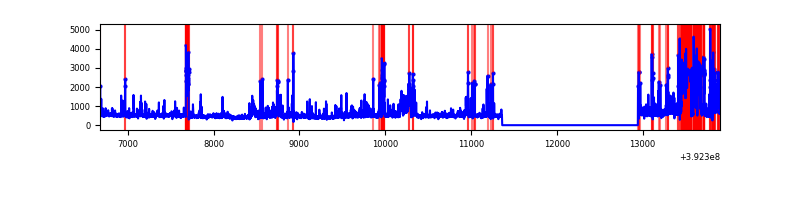 |
Top three noisy pixels from each quadrant. If the there are fewer than three noisy pixels in the level2.evt file, extra rows are filled as -1
| Pixel properties | Quadrant properties | ||||||
|---|---|---|---|---|---|---|---|
| Quadrant | DetID | PixID | Counts | Sigma | Mean | Median | Sigma |
| A | 10 | 83 | 184767 | 1396.32 | 648 | 636 | 131.9 |
| A | 13 | 254 | 9946 | 70.6 | 648 | 636 | 131.9 |
| A | 13 | 6 | 9597 | 67.95 | 648 | 636 | 131.9 |
| B | 5 | 172 | 335329 | 2729.16 | 637 | 619 | 122.6 |
| B | 5 | 236 | 234717 | 1908.79 | 637 | 619 | 122.6 |
| B | 15 | 85 | 35248 | 282.36 | 637 | 619 | 122.6 |
| C | 4 | 254 | 6695699 | 57132.72 | 503 | 507 | 117.2 |
| C | 15 | 208 | 405359 | 3454.76 | 503 | 507 | 117.2 |
| C | 0 | 207 | 356831 | 3040.65 | 503 | 507 | 117.2 |
| D | 13 | 249 | 766414 | 5031.16 | 614 | 595 | 152.2 |
| D | 2 | 250 | 242993 | 1592.47 | 614 | 595 | 152.2 |
| D | 12 | 235 | 222482 | 1457.72 | 614 | 595 | 152.2 |
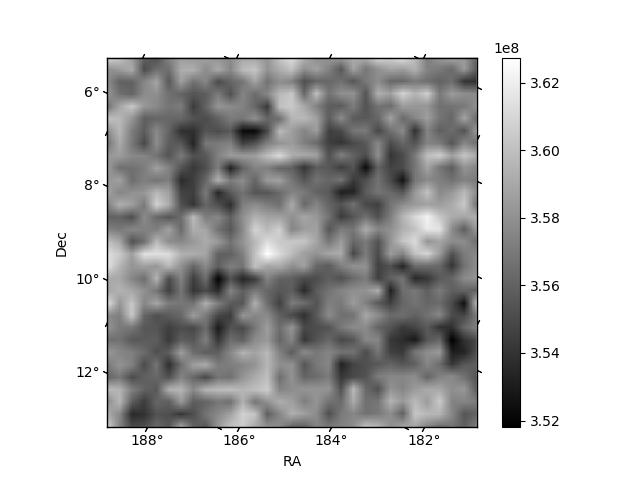
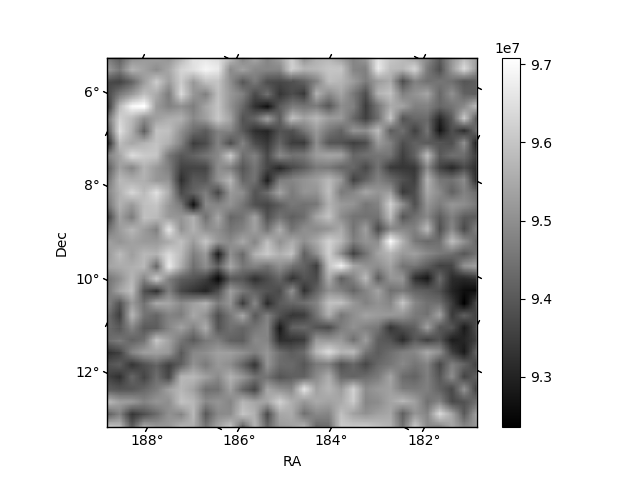
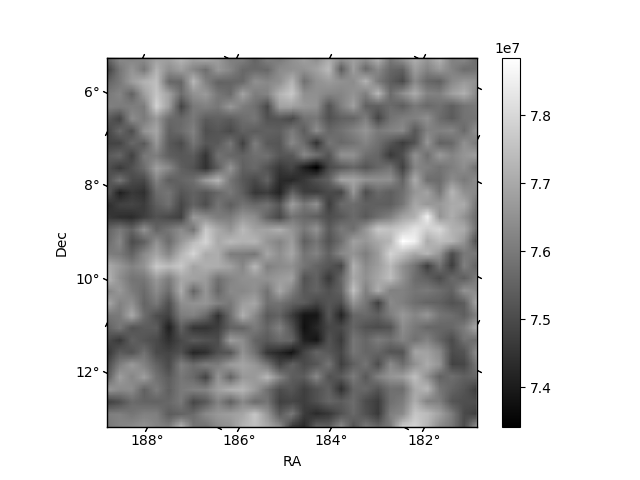
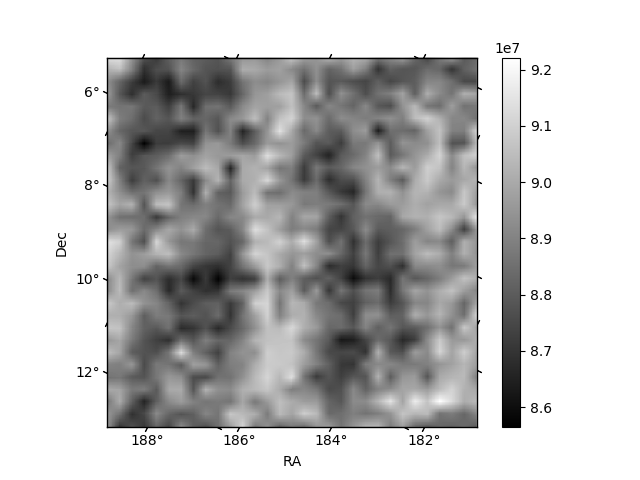
Histogram calculated using DETX and DETY for each event in the final _common_clean file
| Quadrant A | 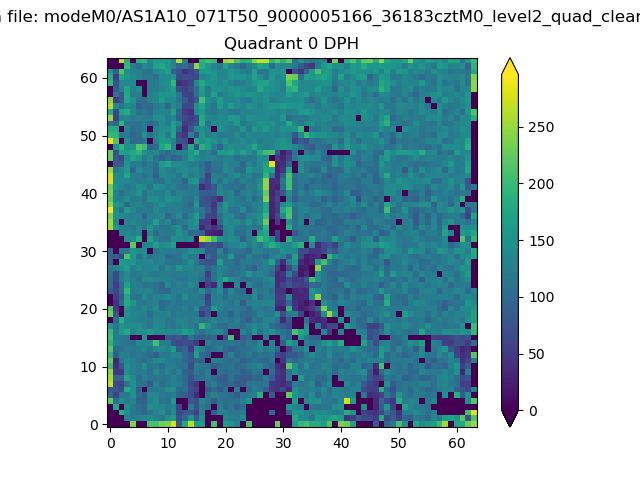 |
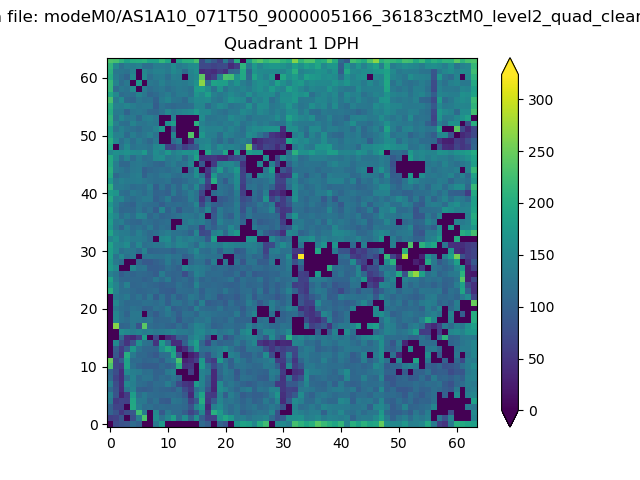 |
Quadrant B |
|---|---|---|---|
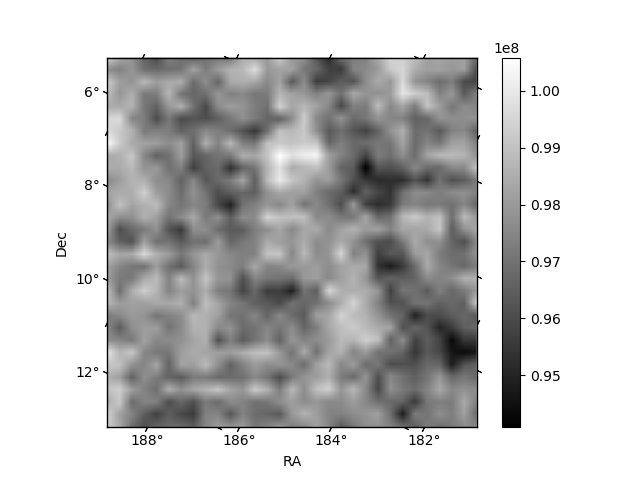
| Quadrant D | 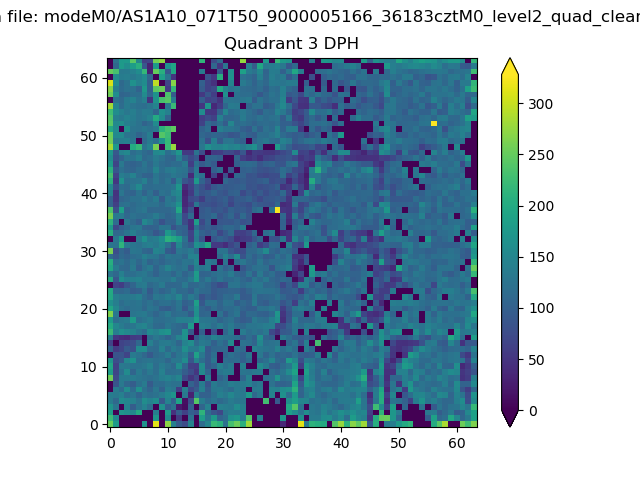 |
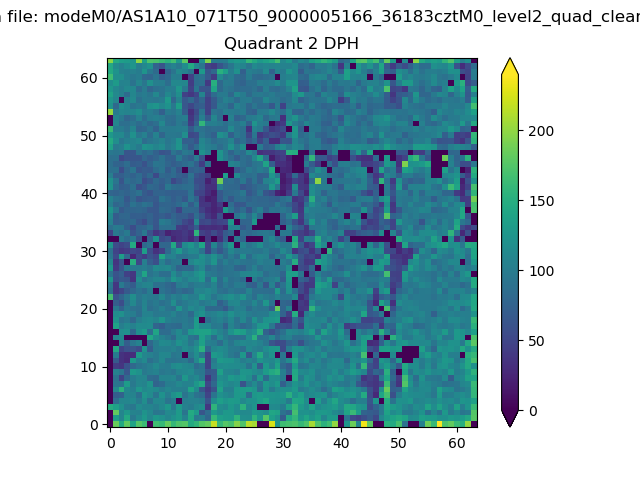 |
Quadrant C |
| Plot type | Count rate plots | Images |
|---|---|---|
| Comparison with Poisson distribution Blue bars denote a histogram of data divided into 1 sec bins. Red curve is a Poisson curve with rate = median count rate of data. |
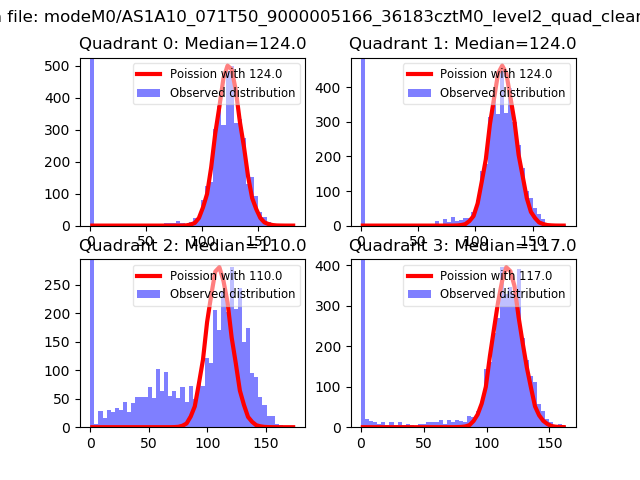 |
 |
| Quadrant-wise count rates Data is divided into 100 sec bins |
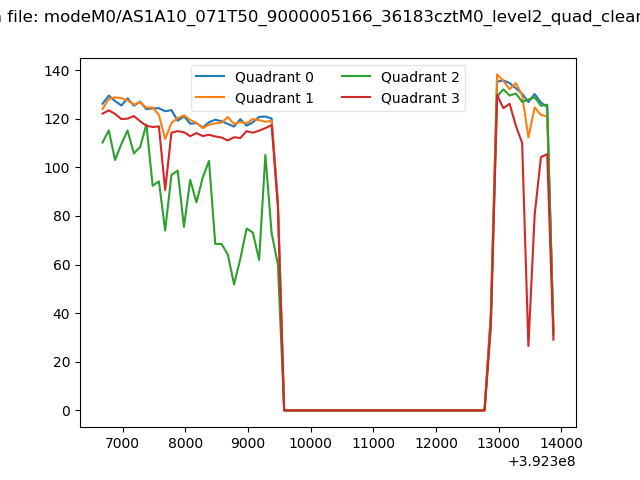 |
|
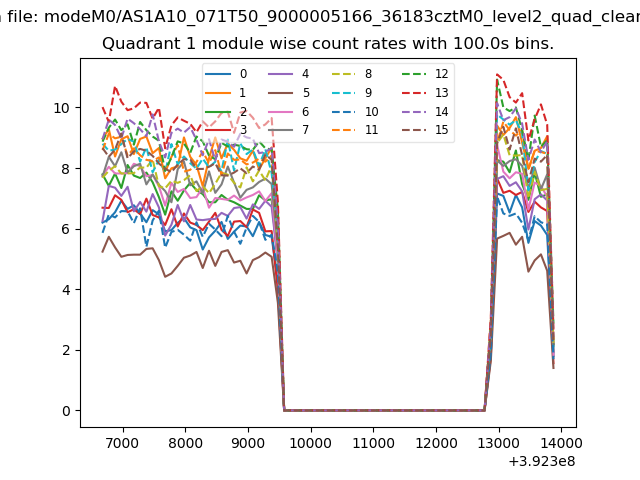
| Module-wise count rates for Quadrant A Data is divided into 100 sec bins |
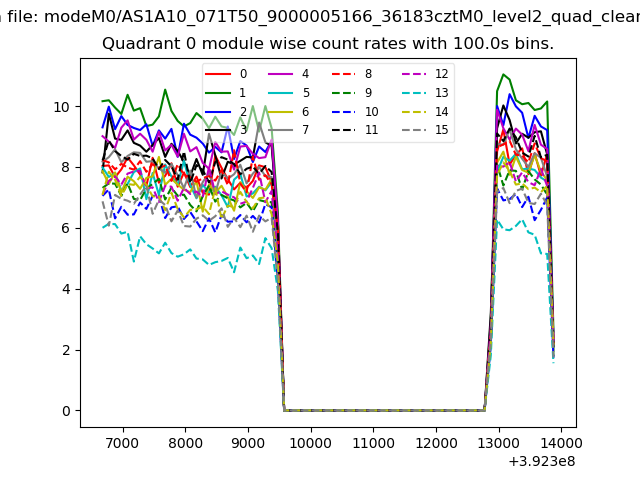 |
 |
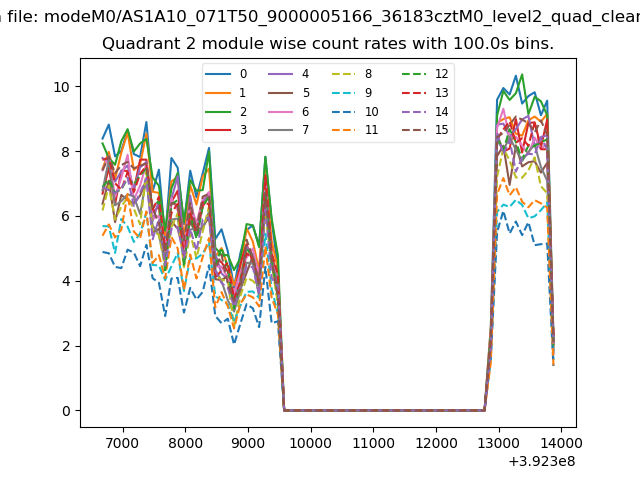
| Module-wise count rates for Quadrant B Data is divided into 100 sec bins |
 |
 |
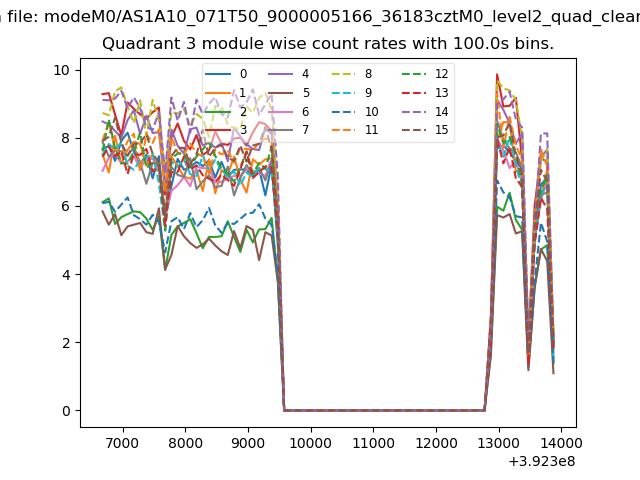
| Module-wise count rates for Quadrant C Data is divided into 100 sec bins |
 |
 |
| Module-wise count rates for Quadrant D Data is divided into 100 sec bins |
 |
 |
| Parameter | Plot |
|---|---|
| CZT HV Monitor | 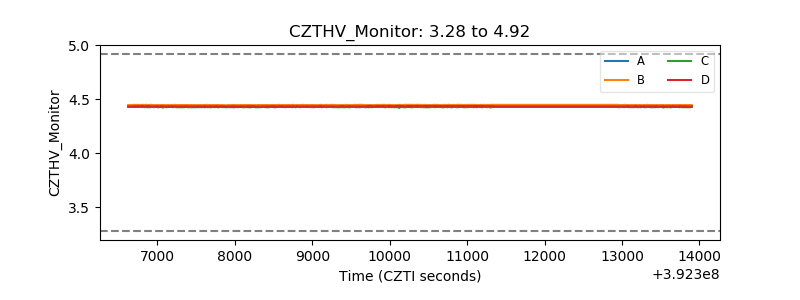 |
| D_VDD | 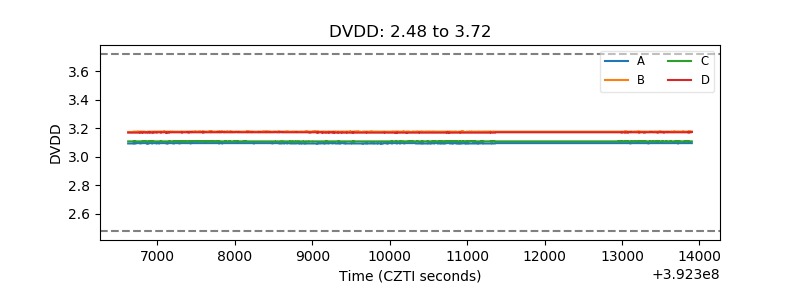 |
| Temperature 1 | 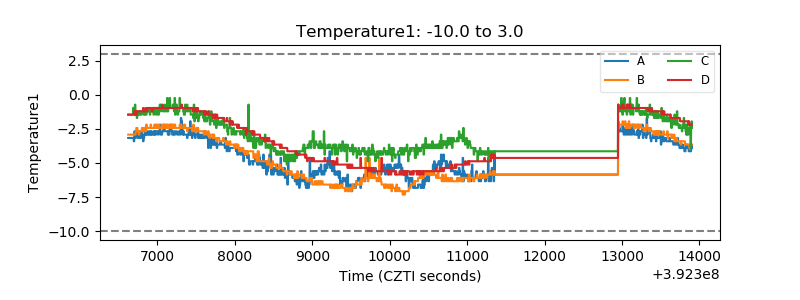 |
| Veto HV Monitor | 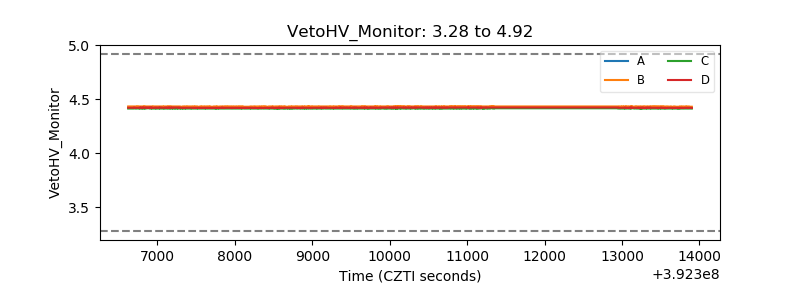 |
| Veto LLD | 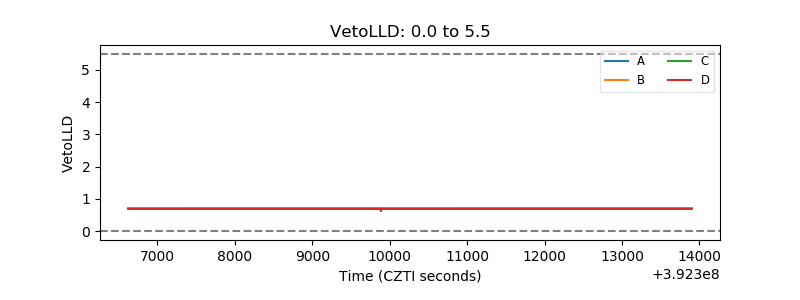 |
| Alpha Counter | 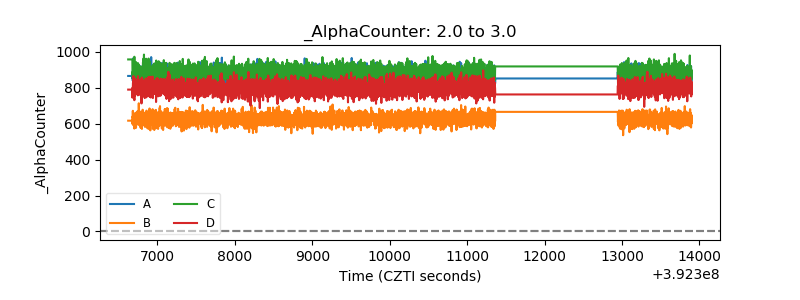 |
| _CPM_Rate | 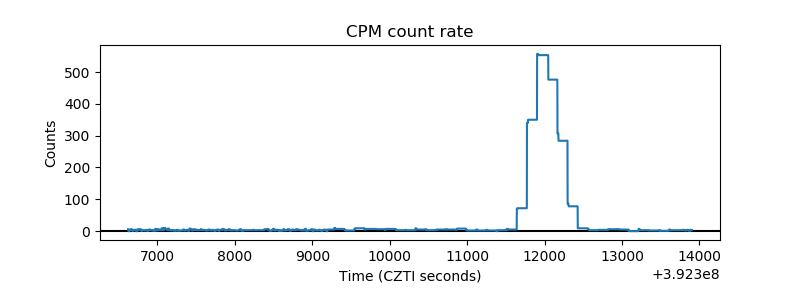 |
| CZT Counter | 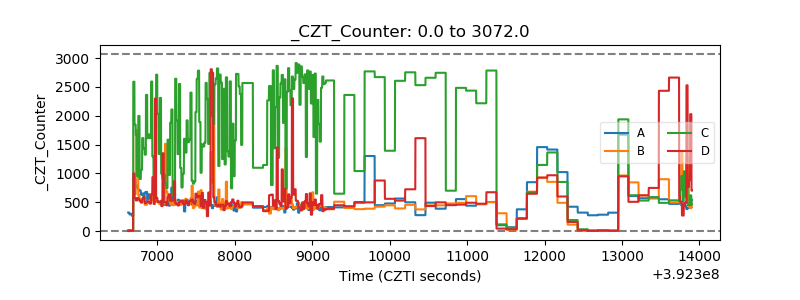 |
| +2.5 Volts monitor | 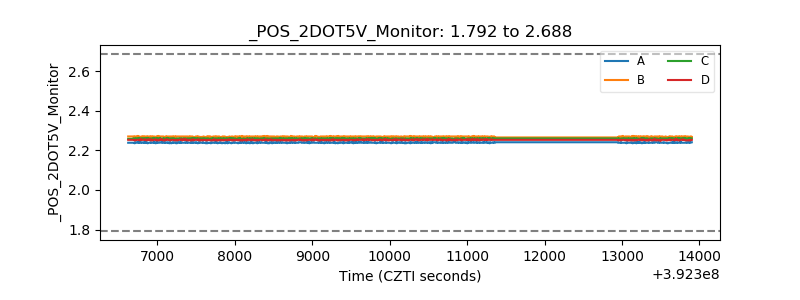 |
| +5 Volts monitor | 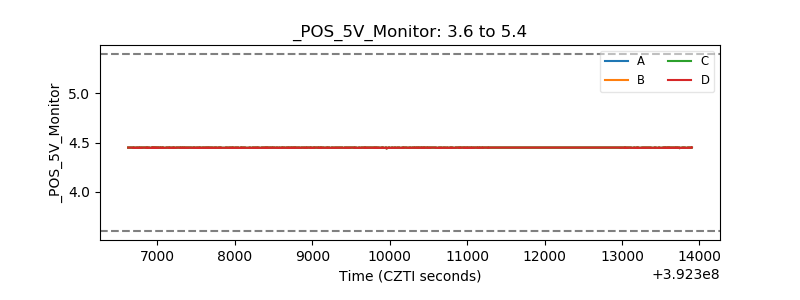 |
| _ROLL_ROT | 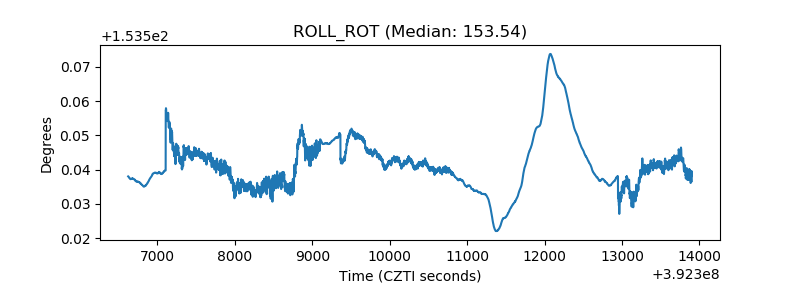 |
| _Roll_DEC | 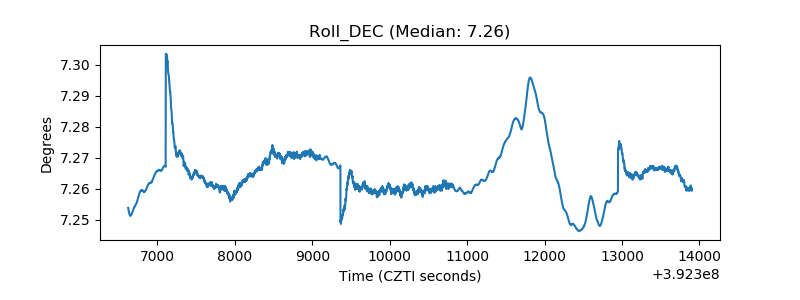 |
| _Roll_RA | 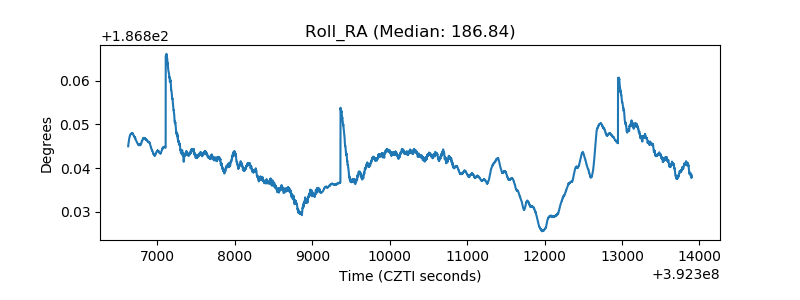 |
| Veto Counter | 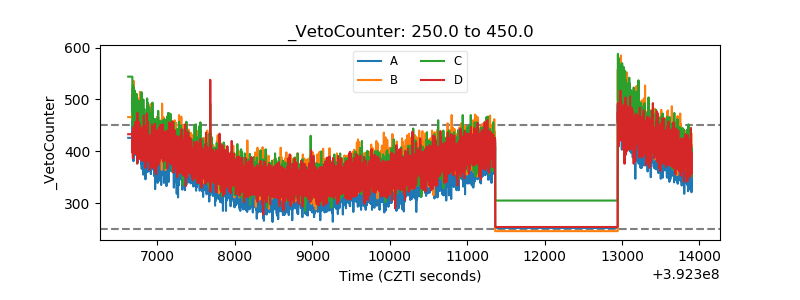 |