| Param | Original file | Final file |
|---|---|---|
| Filename | modeM0/AS1A10_071T50_9000005166_36179cztM0_level2.evt | modeM0/AS1A10_071T50_9000005166_36179cztM0_level2_quad_clean.evt |
| Size (bytes) | 621,622,080 | 95,117,760 |
| Size | 592.8 MB | 90.7 MB |
| Events in quadrant A | 3,341,818 | 618,822 |
| Events in quadrant B | 3,817,854 | 627,214 |
| Events in quadrant C | 4,142,621 | 606,433 |
| Events in quadrant D | 7,054,962 | 545,656 |
| Mode M0 | |||
|---|---|---|---|
| Quadrant | BADHDUFLAG | Total packets | Discarded packets |
| A | 0 | 14182 | 3 |
| B | 0 | 15674 | 2 |
| C | 0 | 16289 | 2 |
| D | 0 | 25572 | 2 |
| Mode M9 | |||
|---|---|---|---|
| Quadrant | BADHDUFLAG | Total packets | Discarded packets |
| A | 0 | 28 | 0 |
| B | 0 | 28 | 0 |
| C | 0 | 28 | 0 |
| D | 0 | 28 | 0 |
| Mode SS | |||
|---|---|---|---|
| Quadrant | BADHDUFLAG | Total packets | Discarded packets |
| A | 0 | 142 | 0 |
| B | 0 | 142 | 0 |
| C | 0 | 142 | 0 |
| D | 0 | 142 | 0 |
| Quadrant | Total seconds | Saturated seconds | Saturation percentage |
|---|---|---|---|
| A | 6921 | 11 | 0.158937% |
| B | 6921 | 95 | 1.372634% |
| C | 6921 | 165 | 2.384049% |
| D | 6921 | 1170 | 16.905072% |
Noise dominated data is calculated using 1-second bins in cleaned event files. If a bin has >2000 counts, and if more than 50% of those come from <1% of pixels, then it is considered to be noise-dominated and hence unusable.
| Quadrant | # 1 sec bins | Bins with >0 counts | Bins with >2000 counts | High rate bins dominated by noise | Noise dominated (total time) | Noise dominated (detector-on time) | Marked lightcurve |
|---|---|---|---|---|---|---|---|
| A | 9757 | 6923 | 1 | 1 | 0.01% | 0.01% | 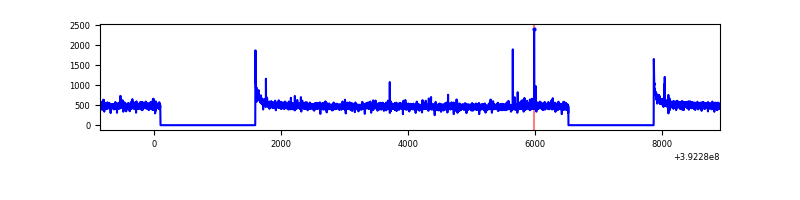 |
| B | 9757 | 6923 | 50 | 50 | 0.51% | 0.72% | 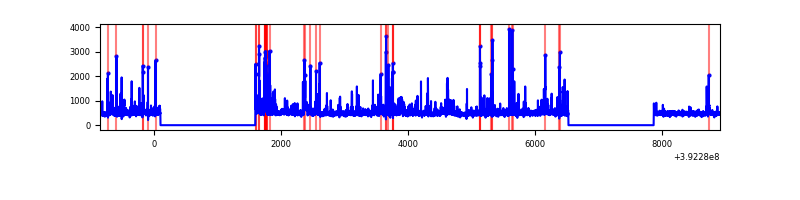 |
| C | 9757 | 6923 | 143 | 143 | 1.47% | 2.07% | 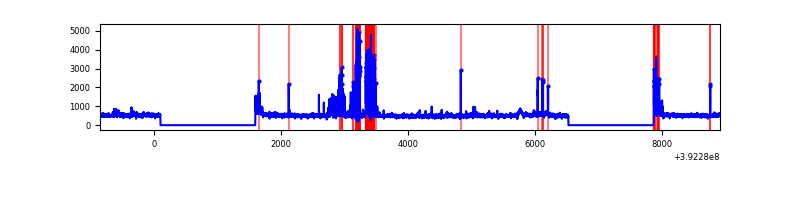 |
| D | 9757 | 6922 | 974 | 974 | 9.98% | 14.07% | 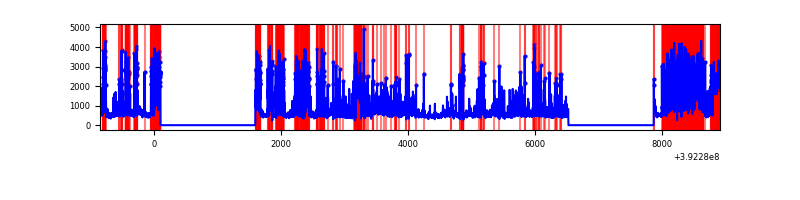 |
Top three noisy pixels from each quadrant. If the there are fewer than three noisy pixels in the level2.evt file, extra rows are filled as -1
| Pixel properties | Quadrant properties | ||||||
|---|---|---|---|---|---|---|---|
| Quadrant | DetID | PixID | Counts | Sigma | Mean | Median | Sigma |
| A | 10 | 83 | 200931 | 1230.3 | 803 | 786 | 162.7 |
| A | 8 | 144 | 16540 | 96.84 | 803 | 786 | 162.7 |
| A | 9 | 143 | 12047 | 69.22 | 803 | 786 | 162.7 |
| B | 5 | 172 | 381430 | 2450.05 | 796 | 774 | 155.4 |
| B | 5 | 236 | 168930 | 1082.32 | 796 | 774 | 155.4 |
| B | 0 | 213 | 72233 | 459.94 | 796 | 774 | 155.4 |
| C | 15 | 208 | 575000 | 3140.9 | 776 | 781 | 182.8 |
| C | 15 | 214 | 311670 | 1700.52 | 776 | 781 | 182.8 |
| C | 0 | 10 | 195070 | 1062.73 | 776 | 781 | 182.8 |
| D | 2 | 250 | 2503972 | 14162.33 | 719 | 697 | 176.8 |
| D | 12 | 235 | 848306 | 4795.37 | 719 | 697 | 176.8 |
| D | 13 | 249 | 408248 | 2305.73 | 719 | 697 | 176.8 |
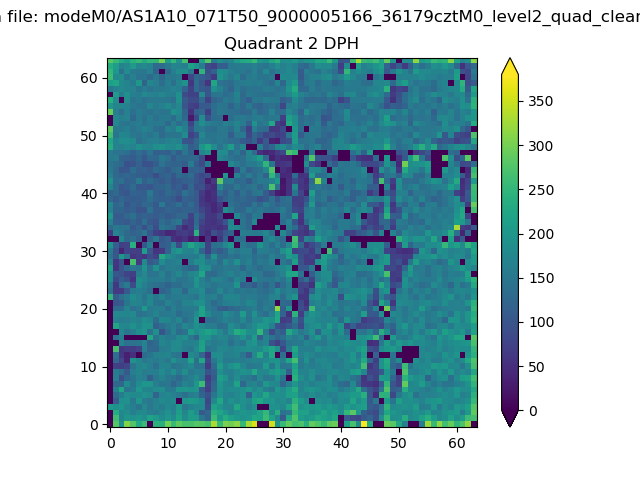
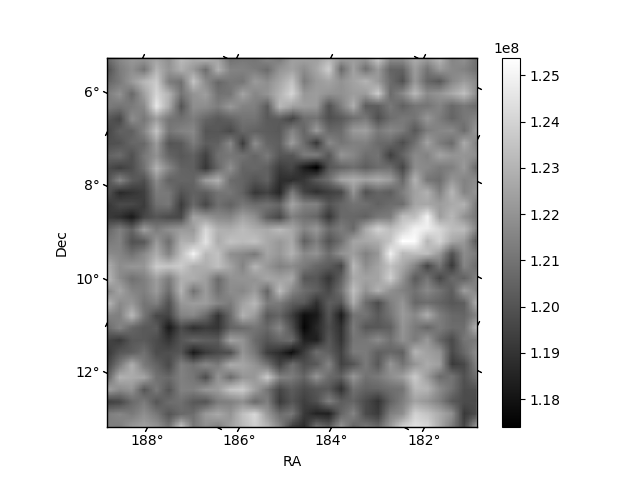
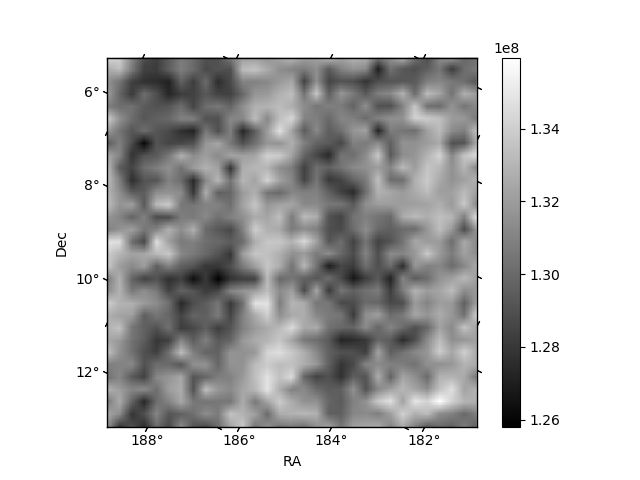
Histogram calculated using DETX and DETY for each event in the final _common_clean file
| Quadrant A | 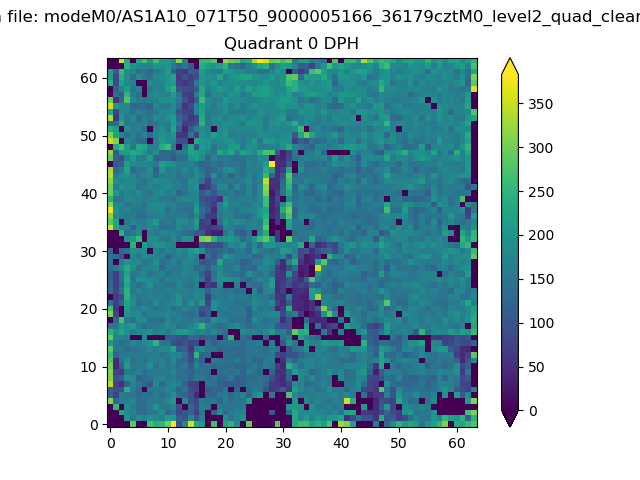 |
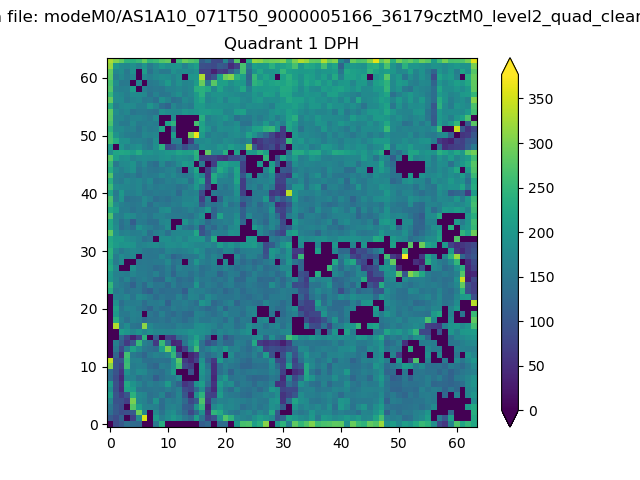 |
Quadrant B |
|---|---|---|---|
| Quadrant D | 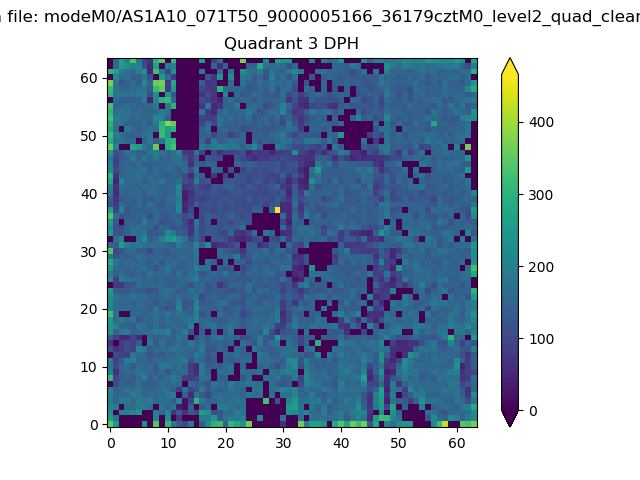 |
 |
Quadrant C |
| Plot type | Count rate plots | Images |
|---|---|---|
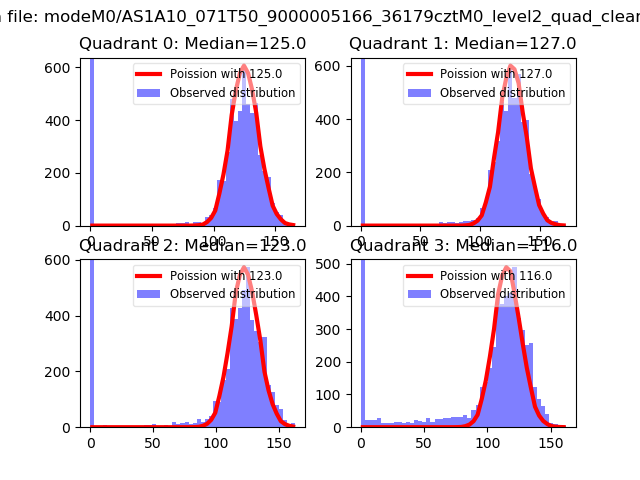
| Comparison with Poisson distribution Blue bars denote a histogram of data divided into 1 sec bins. Red curve is a Poisson curve with rate = median count rate of data. |
 |
 |
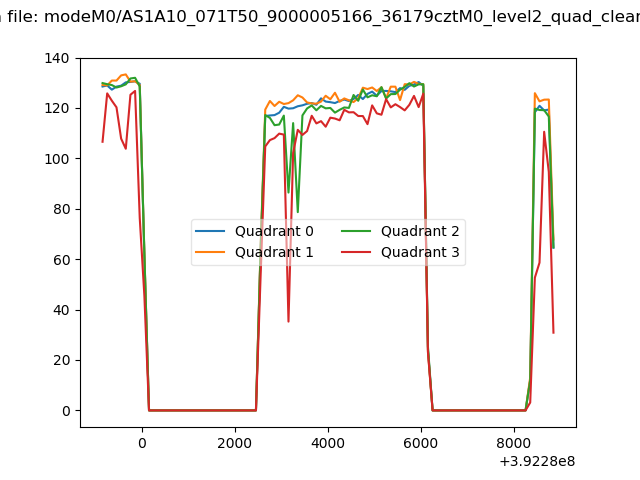
| Quadrant-wise count rates Data is divided into 100 sec bins |
 |
|
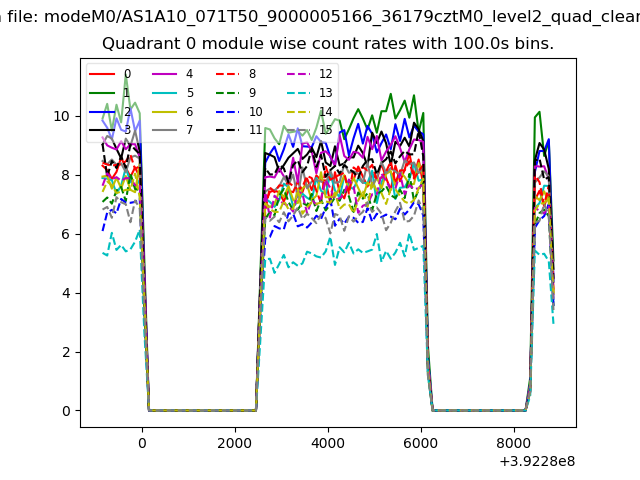
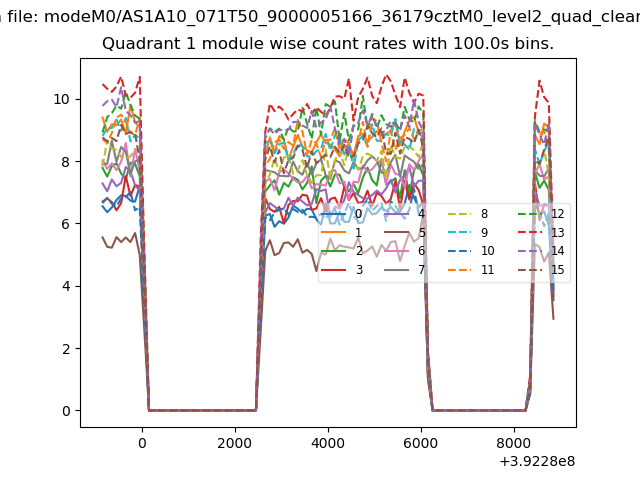
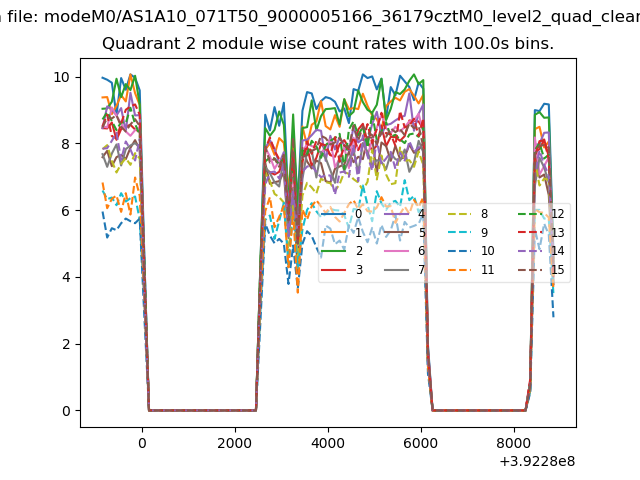
| Module-wise count rates for Quadrant A Data is divided into 100 sec bins |
 |
 |
| Module-wise count rates for Quadrant B Data is divided into 100 sec bins |
 |
 |
| Module-wise count rates for Quadrant C Data is divided into 100 sec bins |
 |
 |
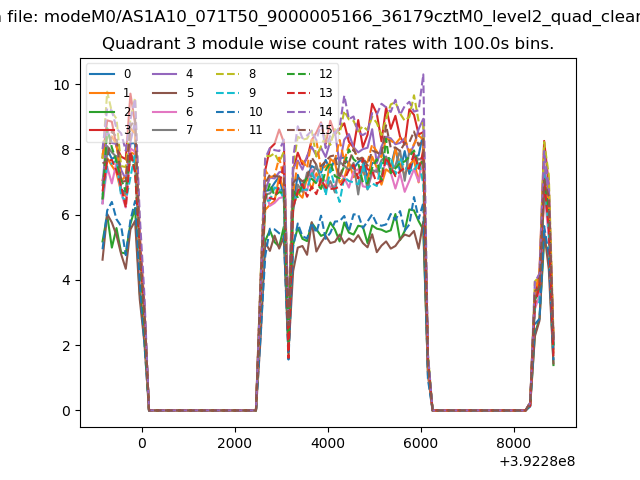
| Module-wise count rates for Quadrant D Data is divided into 100 sec bins |
 |
 |
| Parameter | Plot |
|---|---|
| CZT HV Monitor | 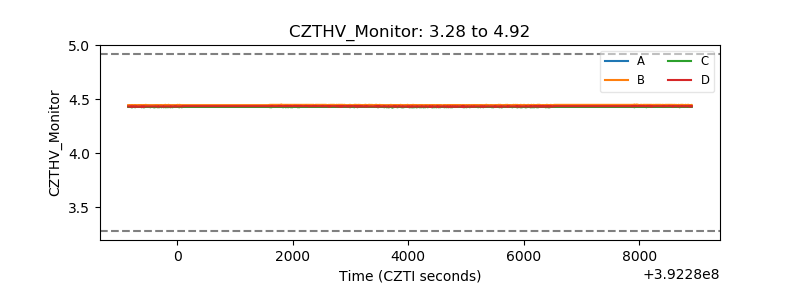 |
| D_VDD | 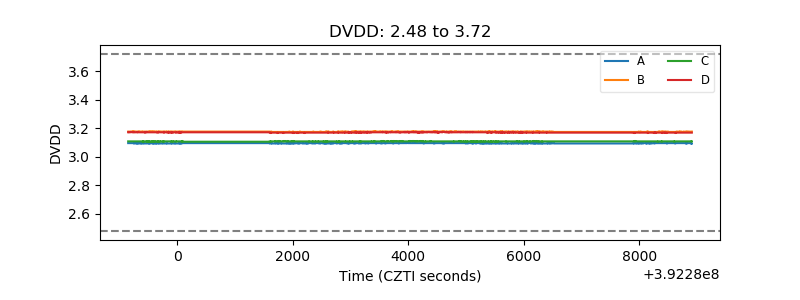 |
| Temperature 1 | 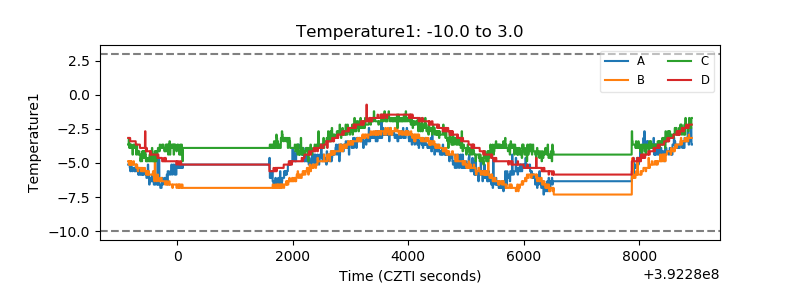 |
| Veto HV Monitor | 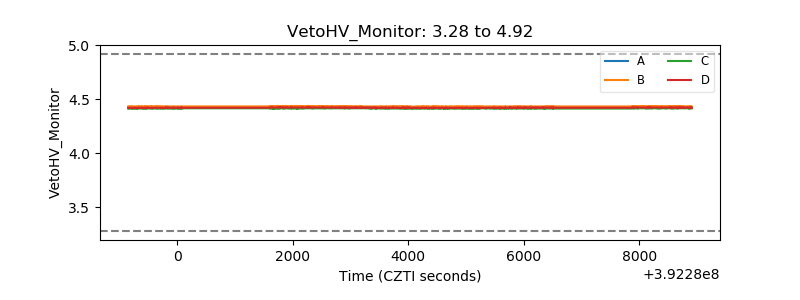 |
| Veto LLD | 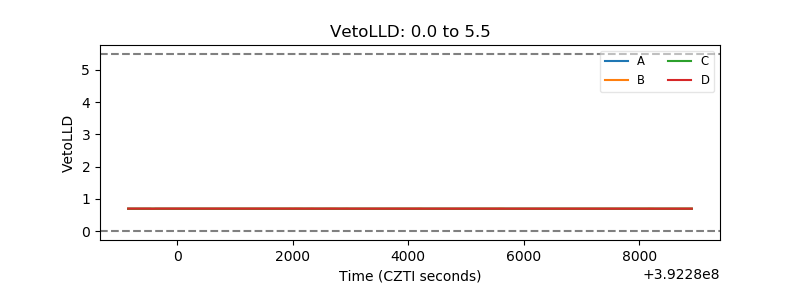 |
| Alpha Counter | 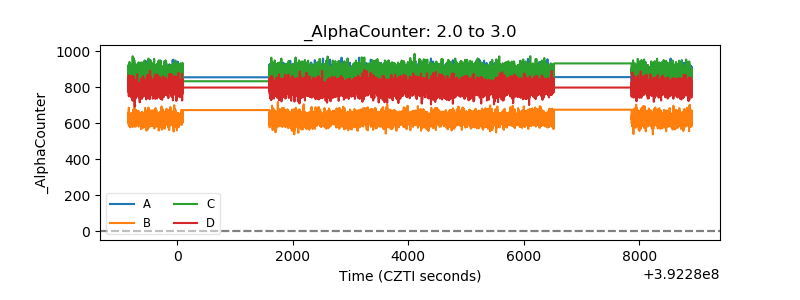 |
| _CPM_Rate | 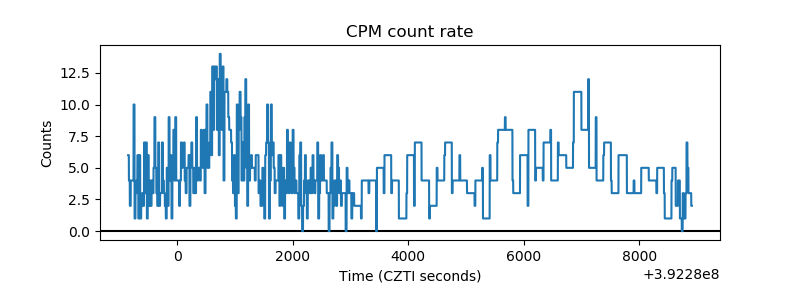 |
| CZT Counter | 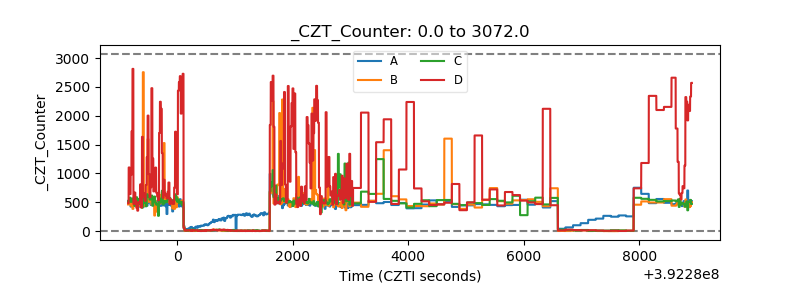 |
| +2.5 Volts monitor | 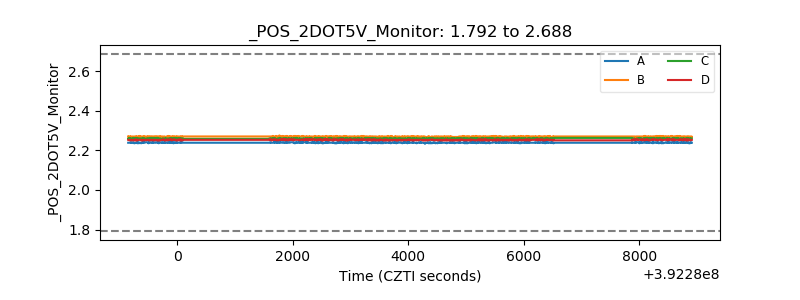 |
| +5 Volts monitor | 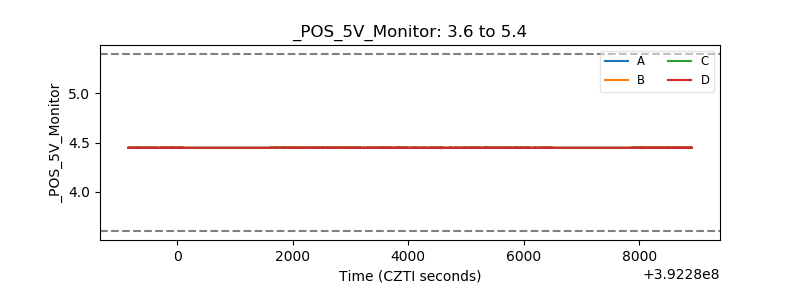 |
| _ROLL_ROT | 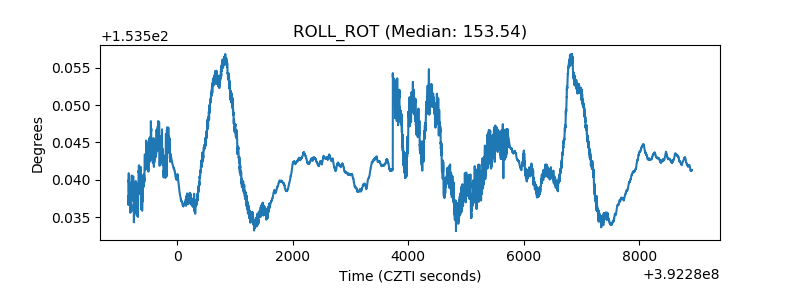 |
| _Roll_DEC | 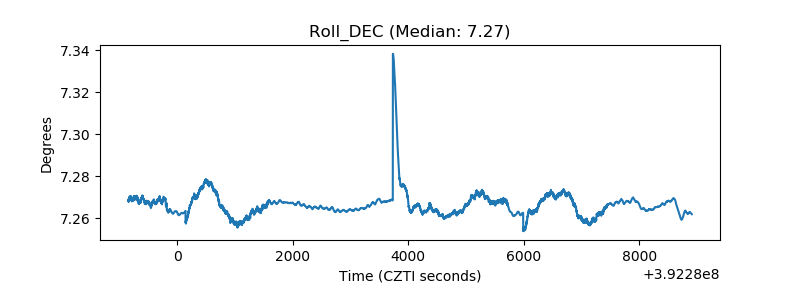 |
| _Roll_RA | 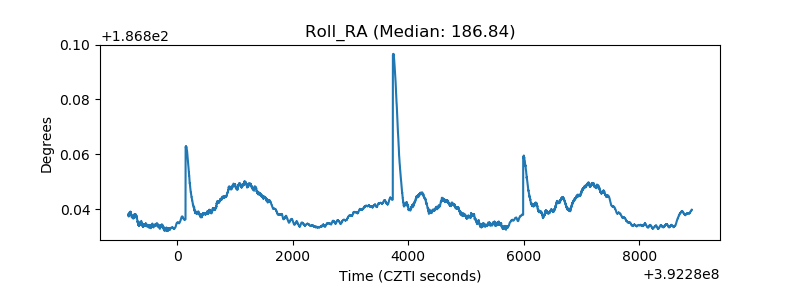 |
| Veto Counter | 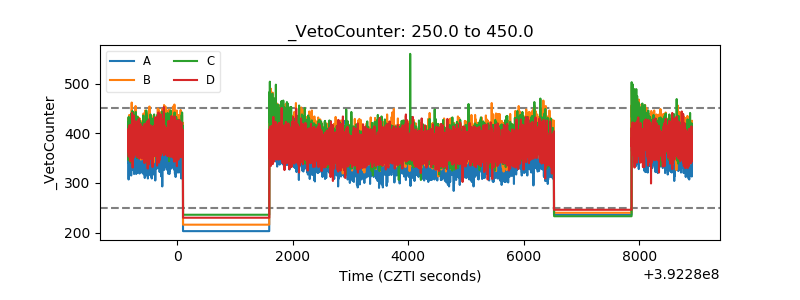 |