| Param | Original file | Final file |
|---|---|---|
| Filename | modeM0/AS1A10_071T50_9000005166_36177cztM0_level2.evt | modeM0/AS1A10_071T50_9000005166_36177cztM0_level2_quad_clean.evt |
| Size (bytes) | 434,560,320 | 55,995,840 |
| Size | 414.4 MB | 53.4 MB |
| Events in quadrant A | 2,618,147 | 338,816 |
| Events in quadrant B | 3,544,655 | 333,148 |
| Events in quadrant C | 3,138,499 | 333,969 |
| Events in quadrant D | 3,499,655 | 318,231 |
| Mode M0 | |||
|---|---|---|---|
| Quadrant | BADHDUFLAG | Total packets | Discarded packets |
| A | 0 | 10896 | 3 |
| B | 0 | 13917 | 2 |
| C | 0 | 12326 | 2 |
| D | 0 | 13883 | 2 |
| Mode M9 | |||
|---|---|---|---|
| Quadrant | BADHDUFLAG | Total packets | Discarded packets |
| A | 0 | 40 | 0 |
| B | 0 | 40 | 0 |
| C | 0 | 40 | 0 |
| D | 0 | 40 | 0 |
| Mode SS | |||
|---|---|---|---|
| Quadrant | BADHDUFLAG | Total packets | Discarded packets |
| A | 0 | 108 | 0 |
| B | 0 | 108 | 0 |
| C | 0 | 108 | 0 |
| D | 0 | 108 | 0 |
| Quadrant | Total seconds | Saturated seconds | Saturation percentage |
|---|---|---|---|
| A | 5303 | 10 | 0.188573% |
| B | 5303 | 223 | 4.205167% |
| C | 5303 | 69 | 1.301150% |
| D | 5303 | 239 | 4.506883% |
Noise dominated data is calculated using 1-second bins in cleaned event files. If a bin has >2000 counts, and if more than 50% of those come from <1% of pixels, then it is considered to be noise-dominated and hence unusable.
| Quadrant | # 1 sec bins | Bins with >0 counts | Bins with >2000 counts | High rate bins dominated by noise | Noise dominated (total time) | Noise dominated (detector-on time) | Marked lightcurve |
|---|---|---|---|---|---|---|---|
| A | 9219 | 5306 | 0 | 0 | 0.00% | 0.00% | 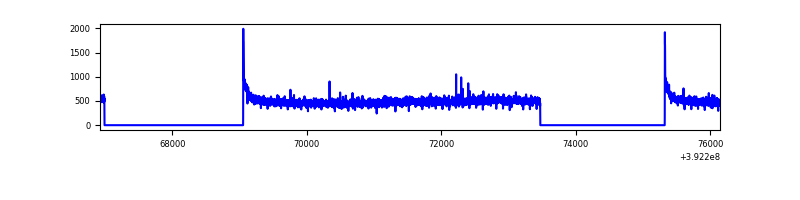 |
| B | 9219 | 5306 | 115 | 115 | 1.25% | 2.17% | 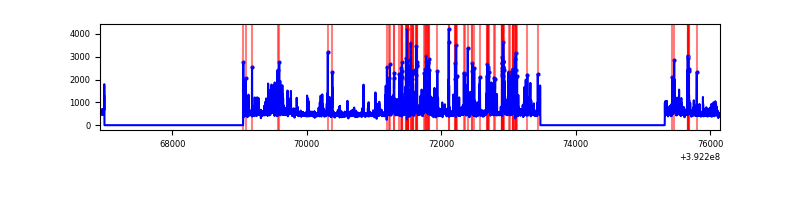 |
| C | 9219 | 5306 | 57 | 57 | 0.62% | 1.07% | 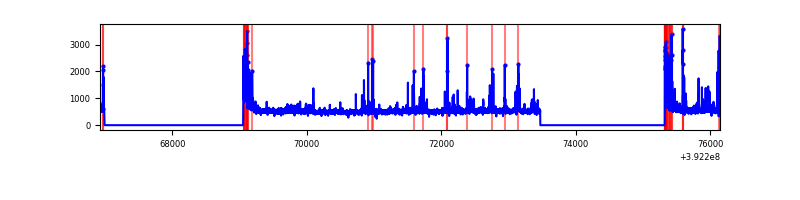 |
| D | 9219 | 5306 | 209 | 209 | 2.27% | 3.94% | 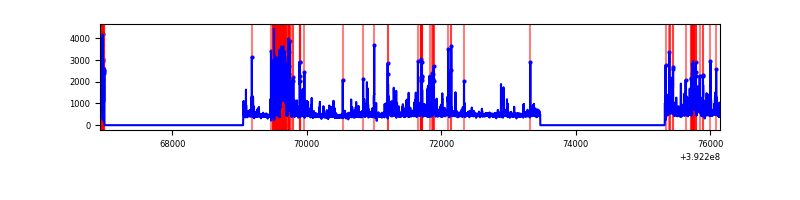 |
Top three noisy pixels from each quadrant. If the there are fewer than three noisy pixels in the level2.evt file, extra rows are filled as -1
| Pixel properties | Quadrant properties | ||||||
|---|---|---|---|---|---|---|---|
| Quadrant | DetID | PixID | Counts | Sigma | Mean | Median | Sigma |
| A | 10 | 83 | 175793 | 1389.65 | 620 | 606 | 126.1 |
| A | 8 | 144 | 35939 | 280.28 | 620 | 606 | 126.1 |
| A | 13 | 254 | 9336 | 69.25 | 620 | 606 | 126.1 |
| B | 4 | 171 | 577376 | 4888.84 | 610 | 594 | 118.0 |
| B | 5 | 172 | 240439 | 2032.94 | 610 | 594 | 118.0 |
| B | 5 | 236 | 215781 | 1823.93 | 610 | 594 | 118.0 |
| C | 15 | 214 | 243870 | 1715.74 | 602 | 605 | 141.8 |
| C | 0 | 10 | 239720 | 1686.47 | 602 | 605 | 141.8 |
| C | 0 | 207 | 131919 | 926.15 | 602 | 605 | 141.8 |
| D | 12 | 233 | 382571 | 2582.13 | 596 | 579 | 147.9 |
| D | 13 | 249 | 333101 | 2247.73 | 596 | 579 | 147.9 |
| D | 1 | 52 | 174467 | 1175.42 | 596 | 579 | 147.9 |
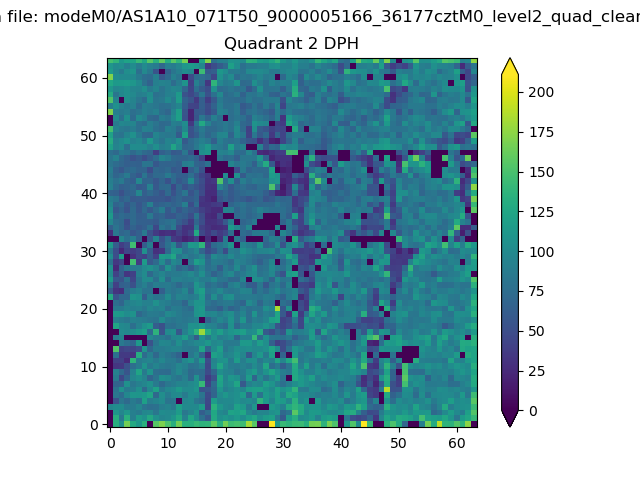
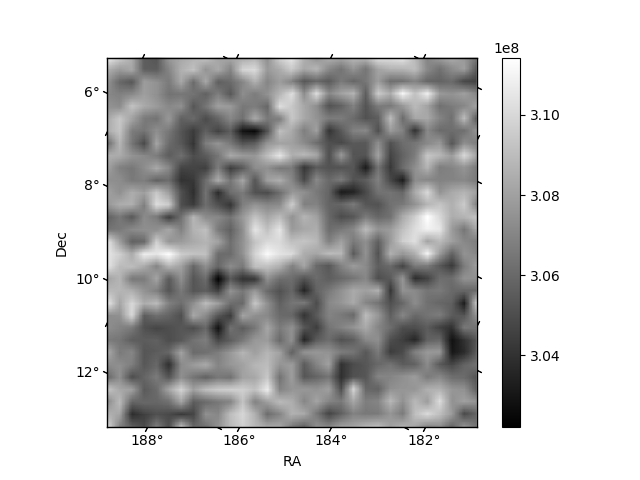
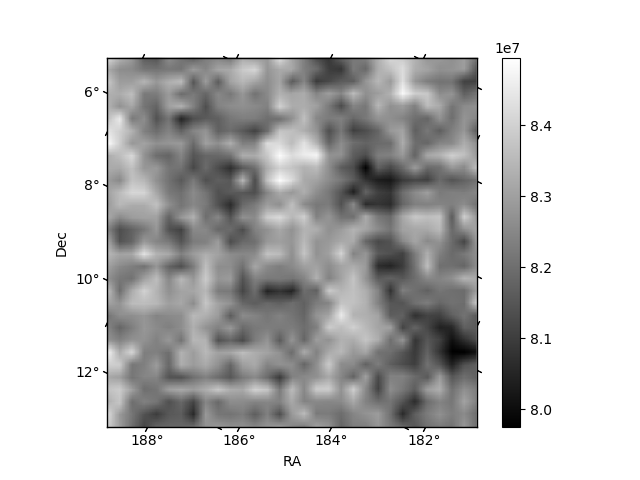
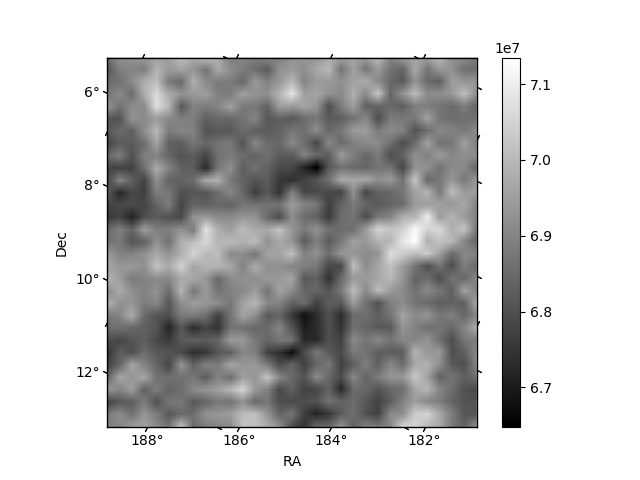
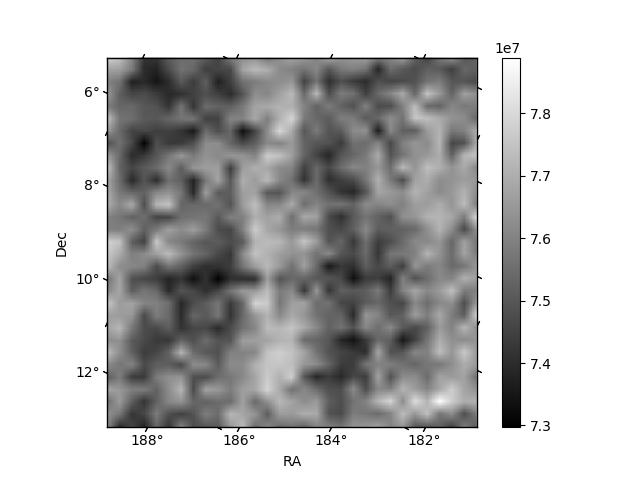
Histogram calculated using DETX and DETY for each event in the final _common_clean file
| Quadrant A | 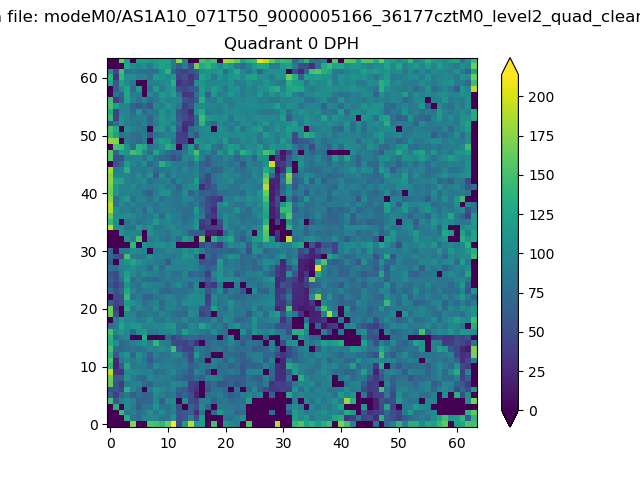 |
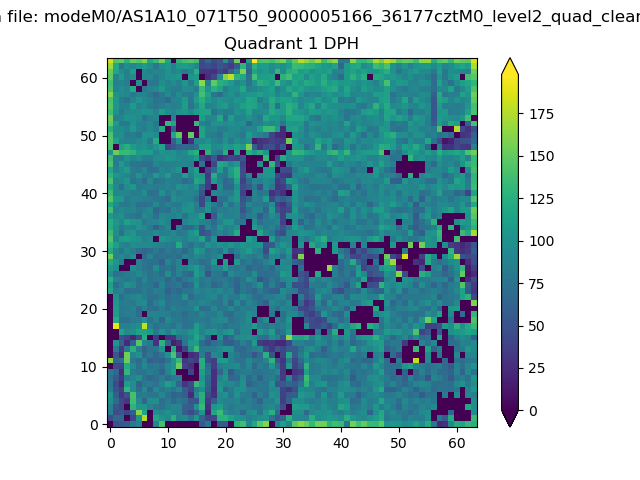 |
Quadrant B |
|---|---|---|---|
| Quadrant D | 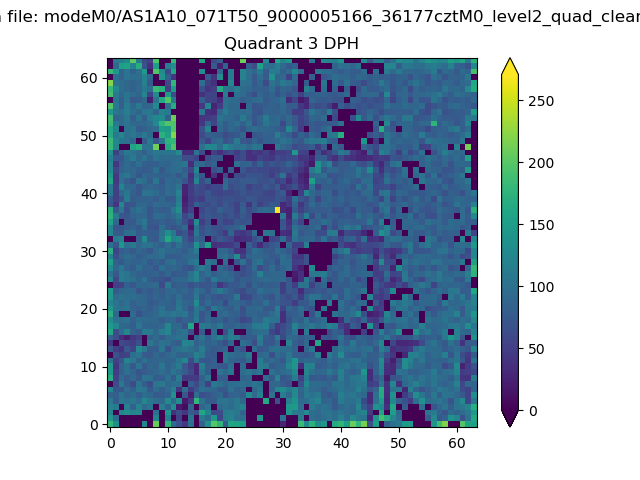 |
 |
Quadrant C |
| Plot type | Count rate plots | Images |
|---|---|---|
| Comparison with Poisson distribution Blue bars denote a histogram of data divided into 1 sec bins. Red curve is a Poisson curve with rate = median count rate of data. |
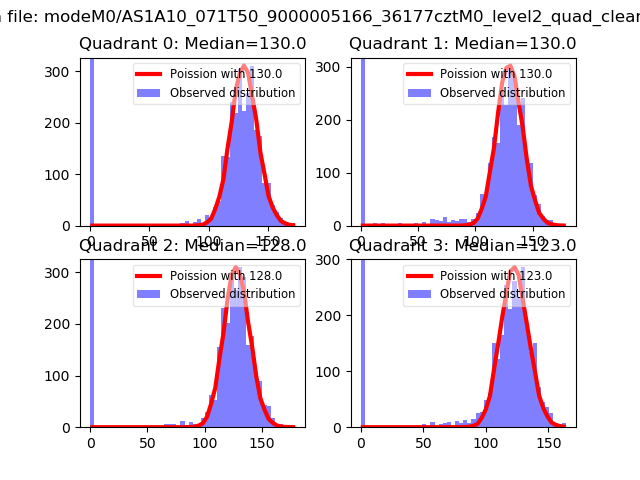 |
 |
| Quadrant-wise count rates Data is divided into 100 sec bins |
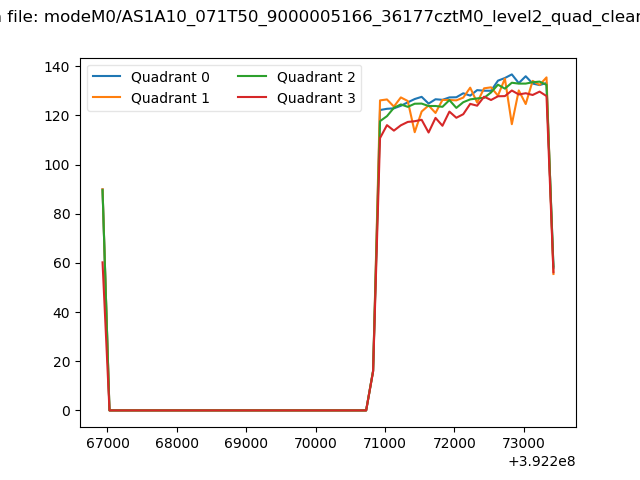 |
|
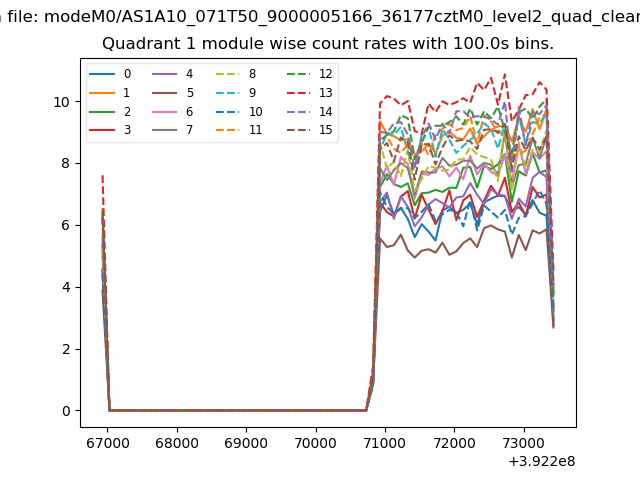
| Module-wise count rates for Quadrant A Data is divided into 100 sec bins |
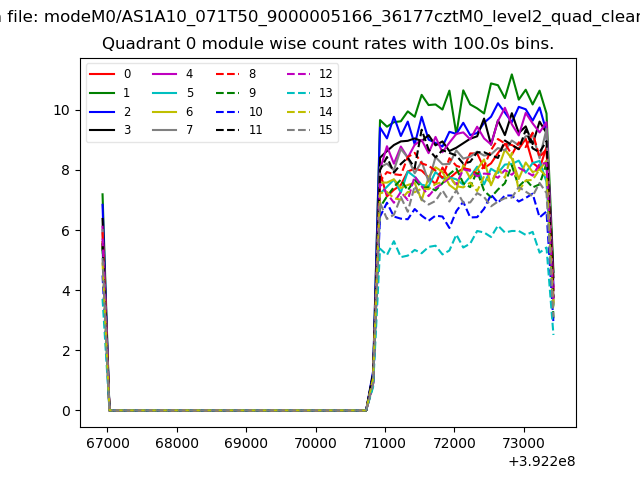 |
 |
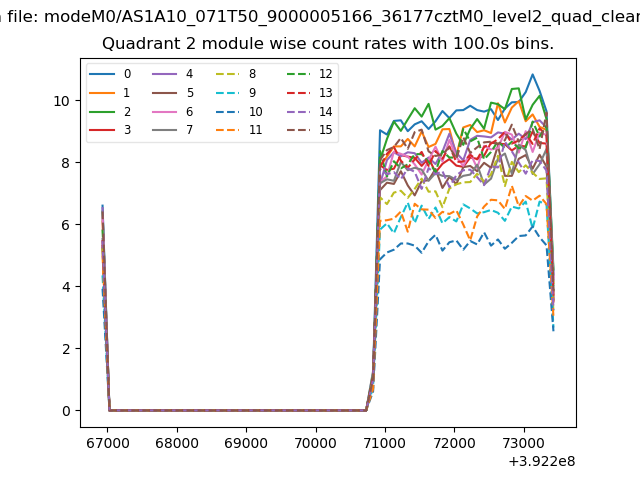
| Module-wise count rates for Quadrant B Data is divided into 100 sec bins |
 |
 |
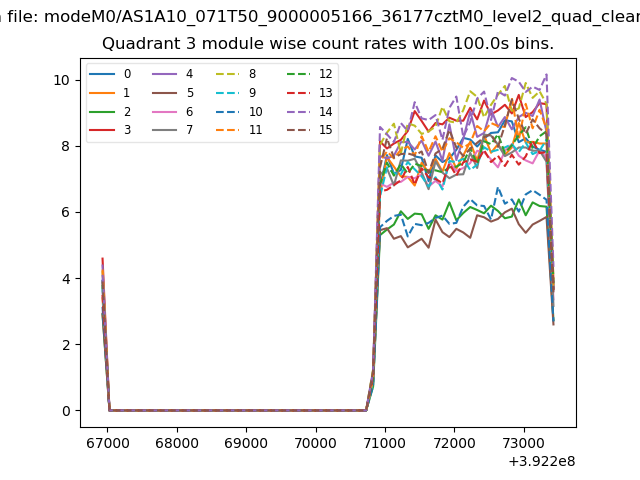
| Module-wise count rates for Quadrant C Data is divided into 100 sec bins |
 |
 |
| Module-wise count rates for Quadrant D Data is divided into 100 sec bins |
 |
 |
| Parameter | Plot |
|---|---|
| CZT HV Monitor | 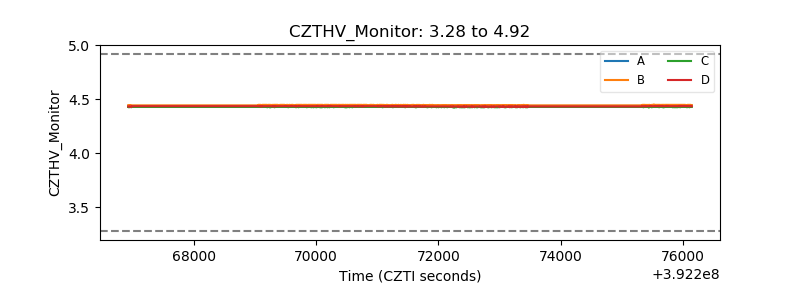 |
| D_VDD | 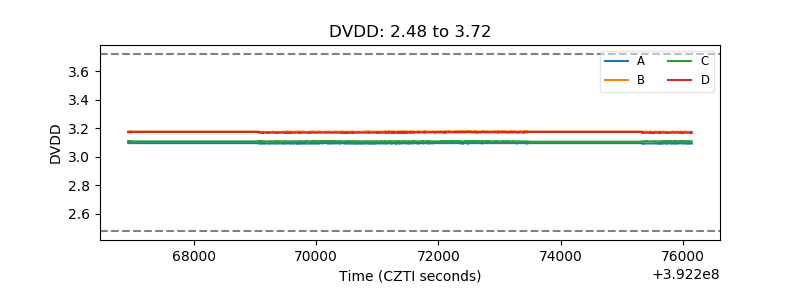 |
| Temperature 1 | 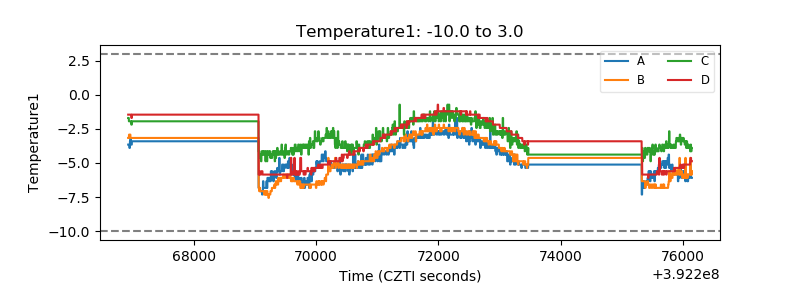 |
| Veto HV Monitor | 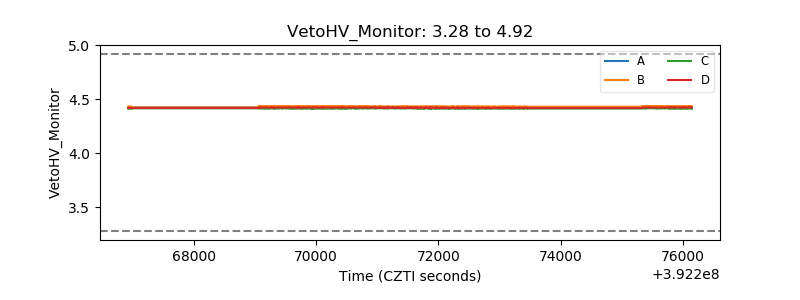 |
| Veto LLD | 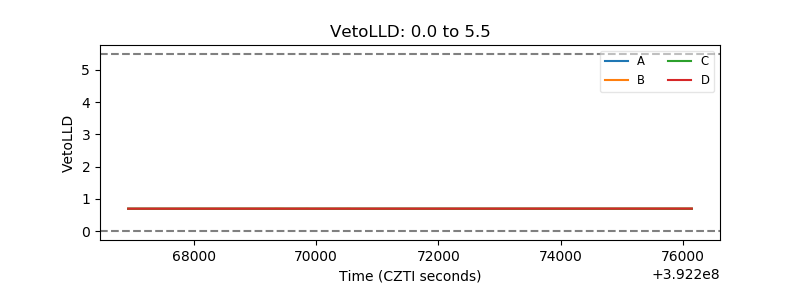 |
| Alpha Counter | 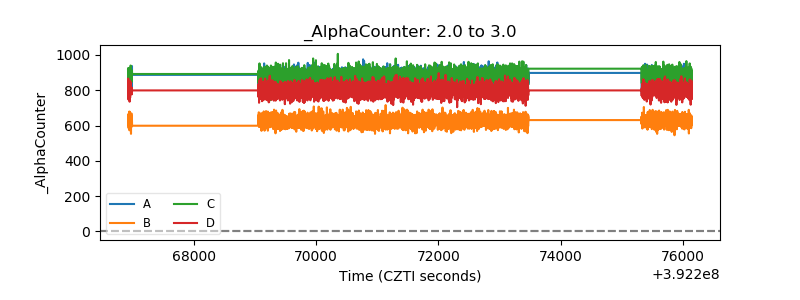 |
| _CPM_Rate | 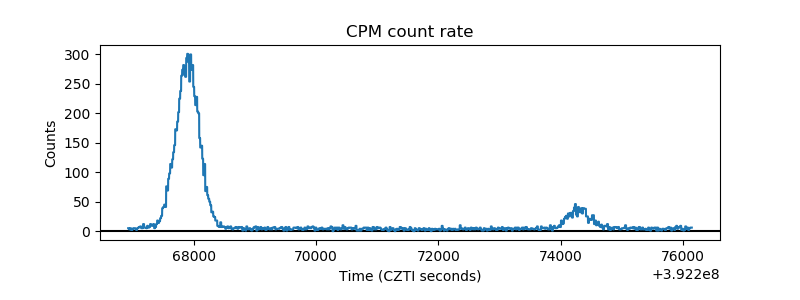 |
| CZT Counter | 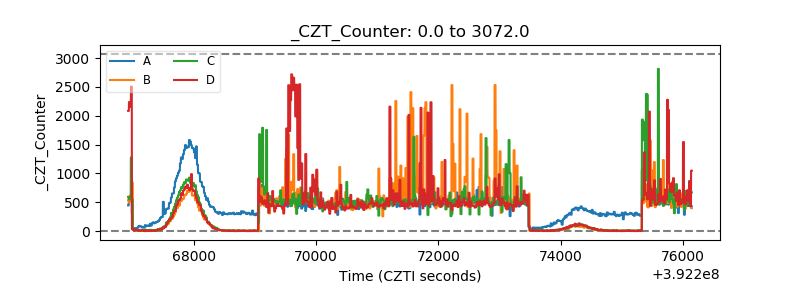 |
| +2.5 Volts monitor | 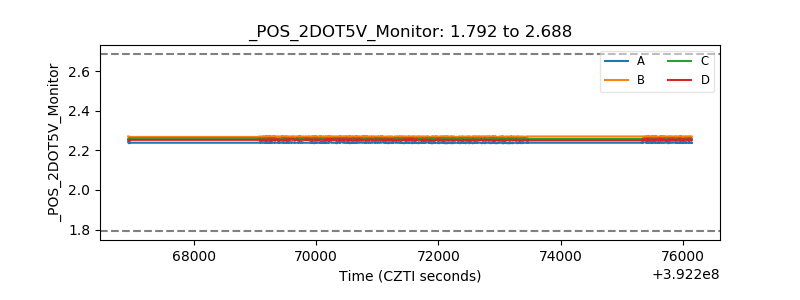 |
| +5 Volts monitor | 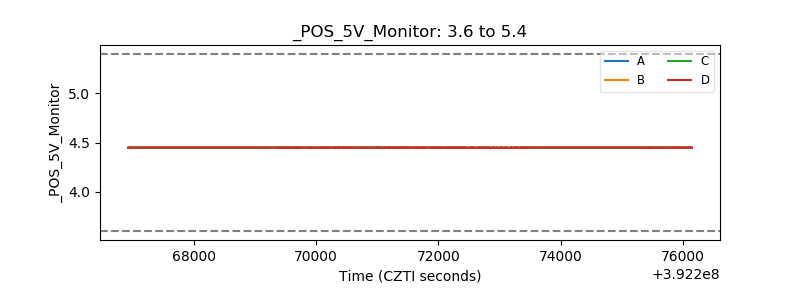 |
| _ROLL_ROT | 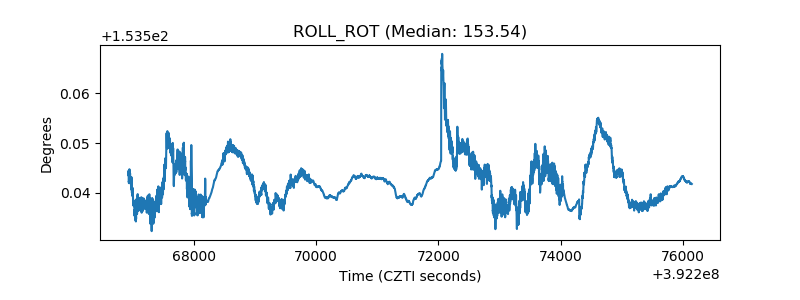 |
| _Roll_DEC | 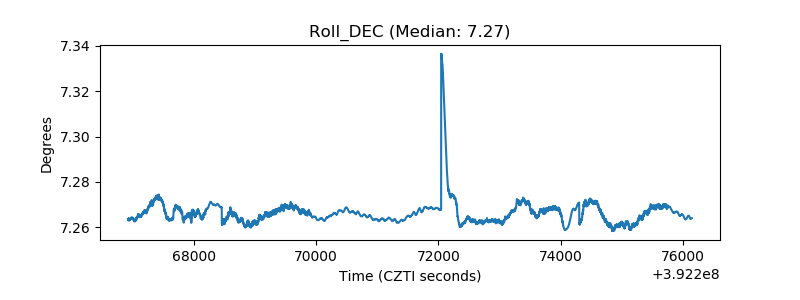 |
| _Roll_RA | 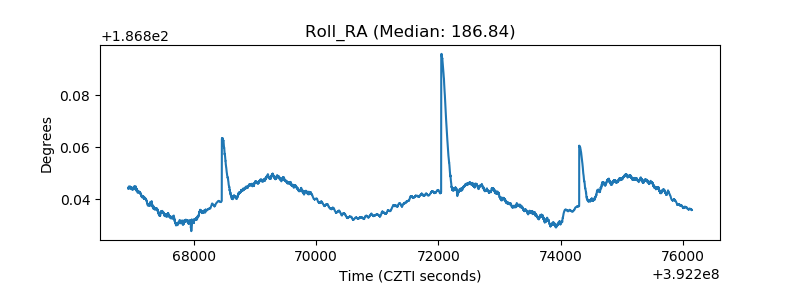 |
| Veto Counter | 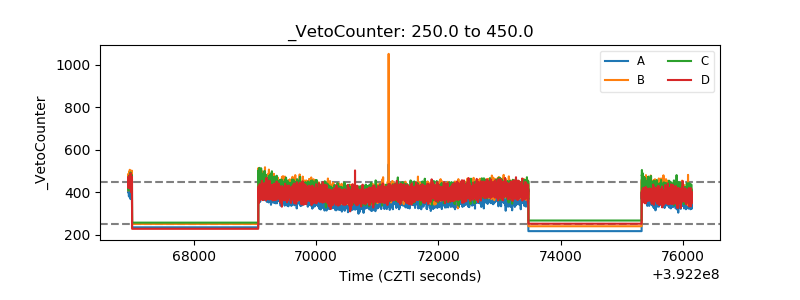 |