| Param | Original file | Final file |
|---|---|---|
| Filename | modeM0/AS1A10_071T50_9000005166_36176cztM0_level2.evt | modeM0/AS1A10_071T50_9000005166_36176cztM0_level2_quad_clean.evt |
| Size (bytes) | 457,243,200 | 48,862,080 |
| Size | 436.1 MB | 46.6 MB |
| Events in quadrant A | 2,670,381 | 290,798 |
| Events in quadrant B | 3,397,238 | 292,776 |
| Events in quadrant C | 4,010,307 | 270,726 |
| Events in quadrant D | 3,423,082 | 266,513 |
| Mode M0 | |||
|---|---|---|---|
| Quadrant | BADHDUFLAG | Total packets | Discarded packets |
| A | 0 | 10922 | 3 |
| B | 0 | 13374 | 2 |
| C | 0 | 15032 | 2 |
| D | 0 | 13554 | 2 |
| Mode M9 | |||
|---|---|---|---|
| Quadrant | BADHDUFLAG | Total packets | Discarded packets |
| A | 0 | 42 | 0 |
| B | 0 | 42 | 0 |
| C | 0 | 42 | 0 |
| D | 0 | 42 | 0 |
| Mode SS | |||
|---|---|---|---|
| Quadrant | BADHDUFLAG | Total packets | Discarded packets |
| A | 0 | 106 | 0 |
| B | 0 | 106 | 0 |
| C | 0 | 106 | 0 |
| D | 0 | 106 | 0 |
| Quadrant | Total seconds | Saturated seconds | Saturation percentage |
|---|---|---|---|
| A | 5109 | 10 | 0.195733% |
| B | 5109 | 120 | 2.348796% |
| C | 5109 | 361 | 7.065962% |
| D | 5109 | 288 | 5.637111% |
Noise dominated data is calculated using 1-second bins in cleaned event files. If a bin has >2000 counts, and if more than 50% of those come from <1% of pixels, then it is considered to be noise-dominated and hence unusable.
| Quadrant | # 1 sec bins | Bins with >0 counts | Bins with >2000 counts | High rate bins dominated by noise | Noise dominated (total time) | Noise dominated (detector-on time) | Marked lightcurve |
|---|---|---|---|---|---|---|---|
| A | 9295 | 5111 | 6 | 6 | 0.06% | 0.12% | 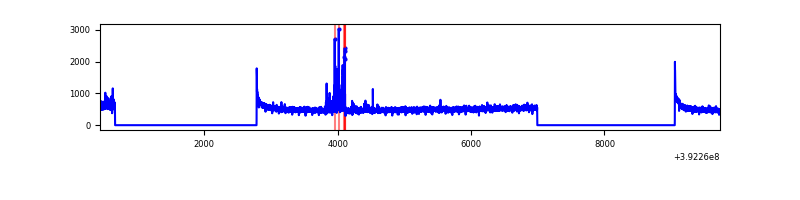 |
| B | 9295 | 5111 | 65 | 65 | 0.70% | 1.27% | 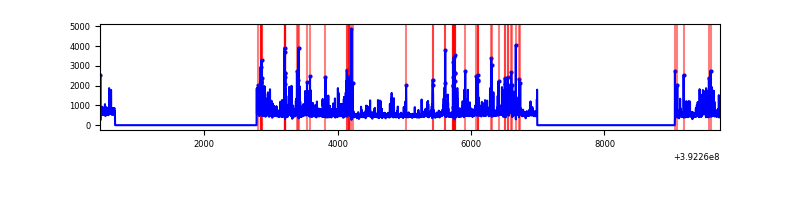 |
| C | 9295 | 5111 | 303 | 303 | 3.26% | 5.93% | 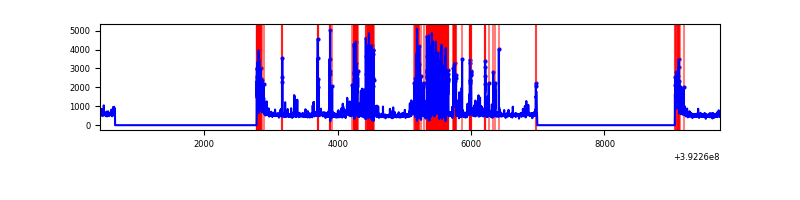 |
| D | 9295 | 5111 | 239 | 239 | 2.57% | 4.68% | 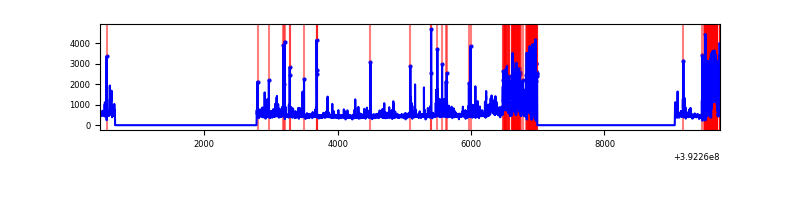 |
Top three noisy pixels from each quadrant. If the there are fewer than three noisy pixels in the level2.evt file, extra rows are filled as -1
| Pixel properties | Quadrant properties | ||||||
|---|---|---|---|---|---|---|---|
| Quadrant | DetID | PixID | Counts | Sigma | Mean | Median | Sigma |
| A | 10 | 83 | 172753 | 1390.47 | 615 | 604 | 123.8 |
| A | 10 | 255 | 87237 | 699.75 | 615 | 604 | 123.8 |
| A | 8 | 144 | 21274 | 166.95 | 615 | 604 | 123.8 |
| B | 5 | 236 | 383666 | 3265.37 | 609 | 594 | 117.3 |
| B | 4 | 171 | 288334 | 2452.74 | 609 | 594 | 117.3 |
| B | 5 | 172 | 158474 | 1345.8 | 609 | 594 | 117.3 |
| C | 1 | 23 | 951742 | 7012.78 | 579 | 585 | 135.6 |
| C | 0 | 10 | 323007 | 2377.18 | 579 | 585 | 135.6 |
| C | 15 | 208 | 232288 | 1708.32 | 579 | 585 | 135.6 |
| D | 1 | 52 | 527754 | 3654.92 | 584 | 569 | 144.2 |
| D | 12 | 233 | 229566 | 1587.61 | 584 | 569 | 144.2 |
| D | 13 | 249 | 166594 | 1151.03 | 584 | 569 | 144.2 |
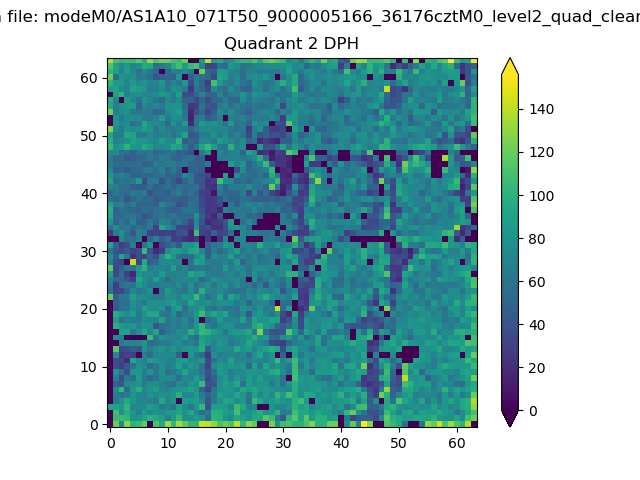
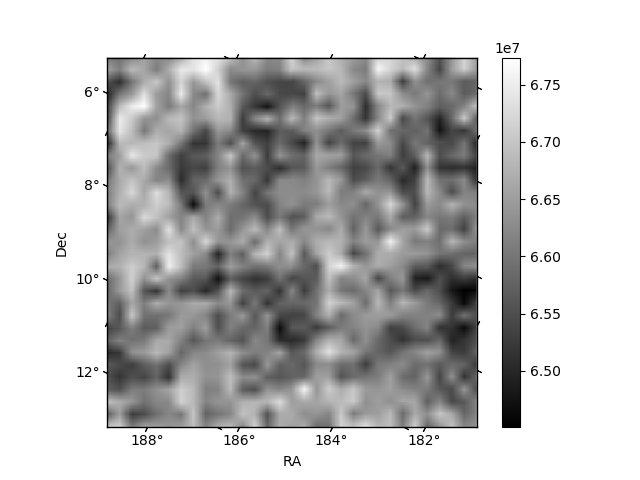
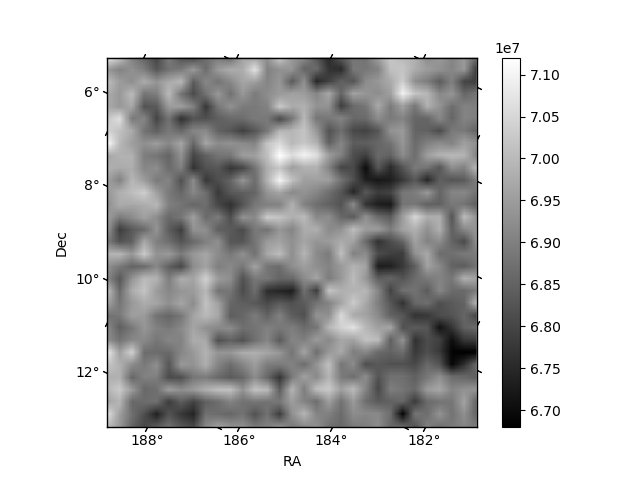
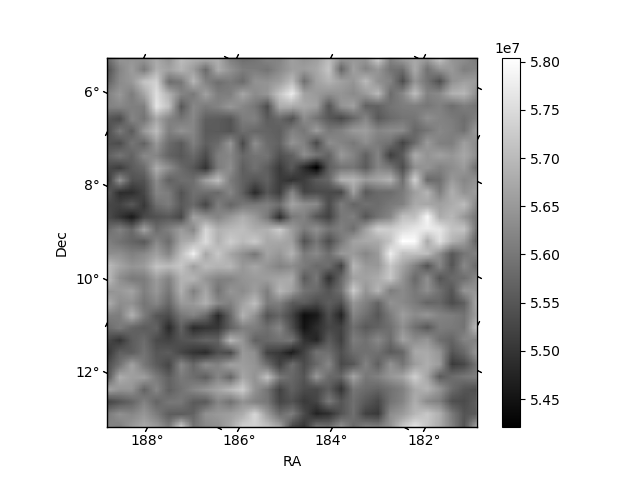
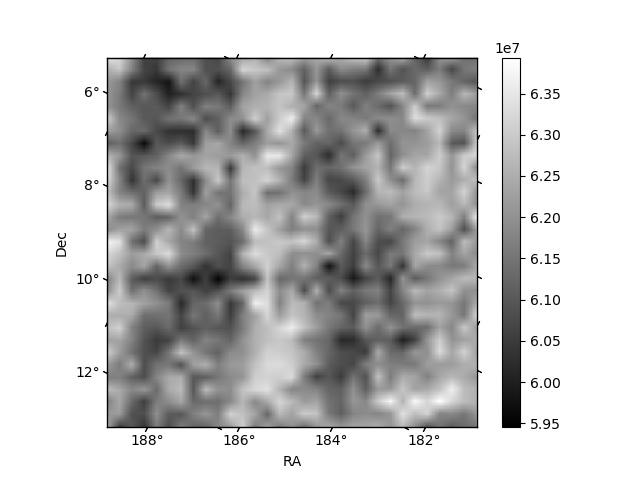
Histogram calculated using DETX and DETY for each event in the final _common_clean file
| Quadrant A | 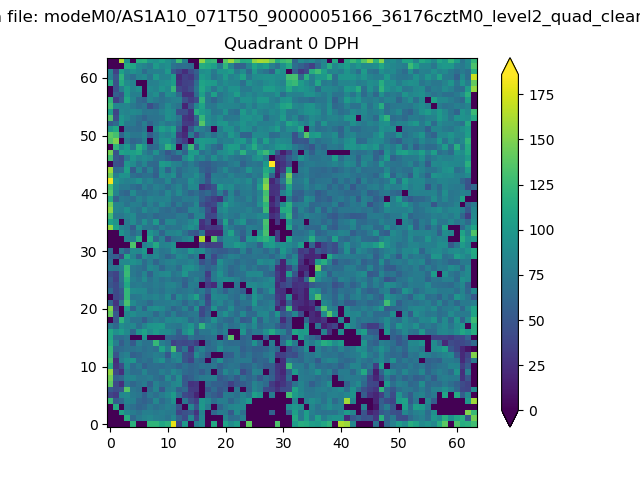 |
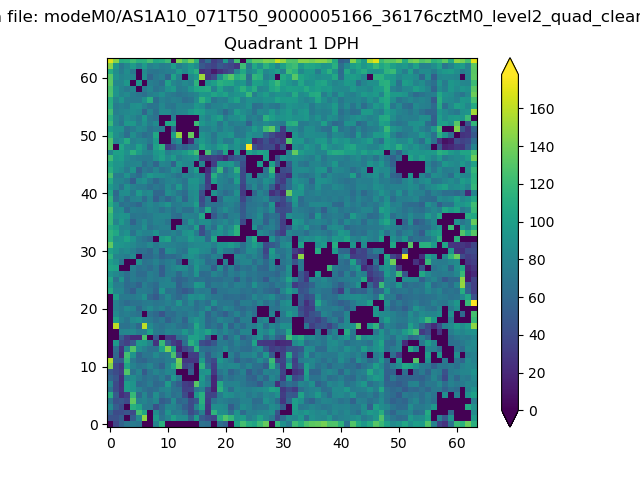 |
Quadrant B |
|---|---|---|---|
| Quadrant D | 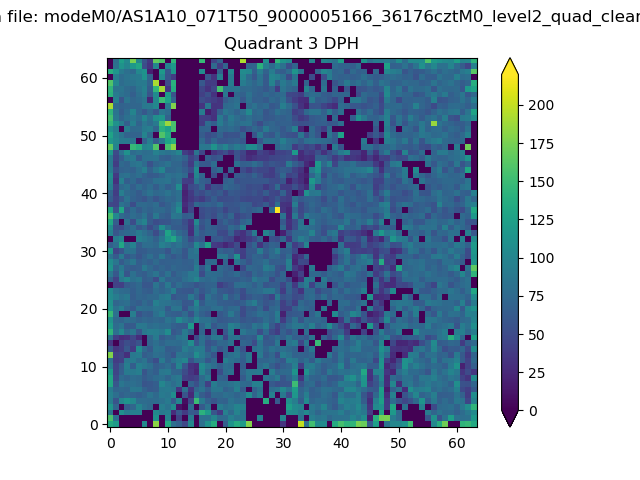 |
 |
Quadrant C |
| Plot type | Count rate plots | Images |
|---|---|---|
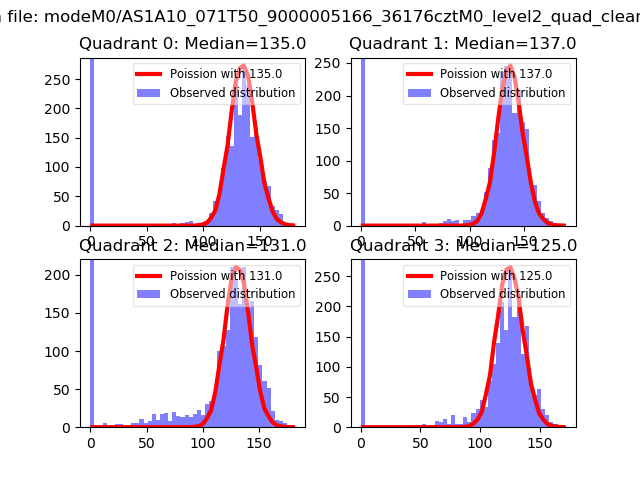
| Comparison with Poisson distribution Blue bars denote a histogram of data divided into 1 sec bins. Red curve is a Poisson curve with rate = median count rate of data. |
 |
 |
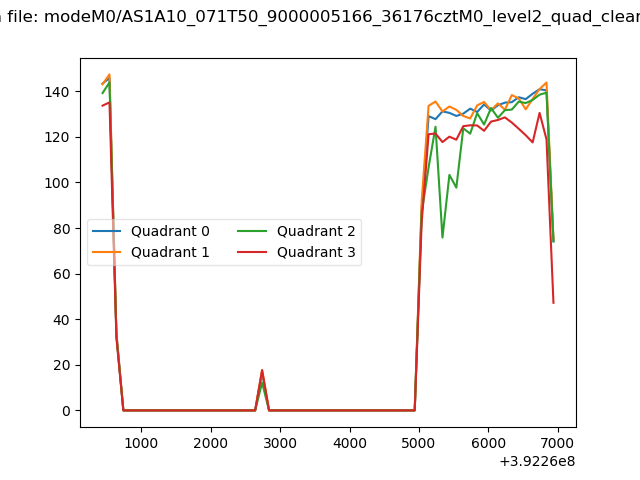
| Quadrant-wise count rates Data is divided into 100 sec bins |
 |
|
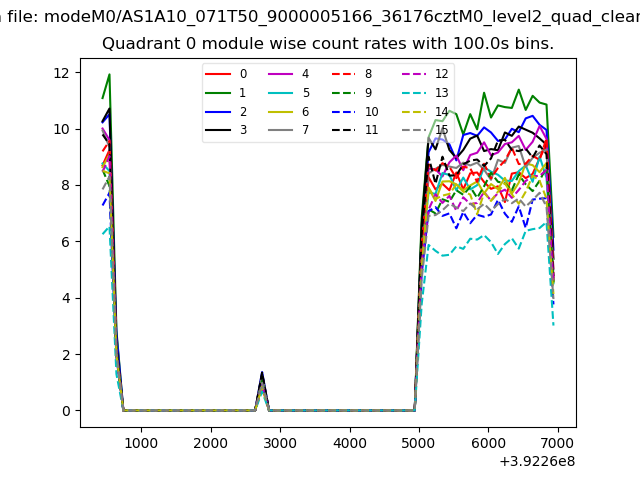
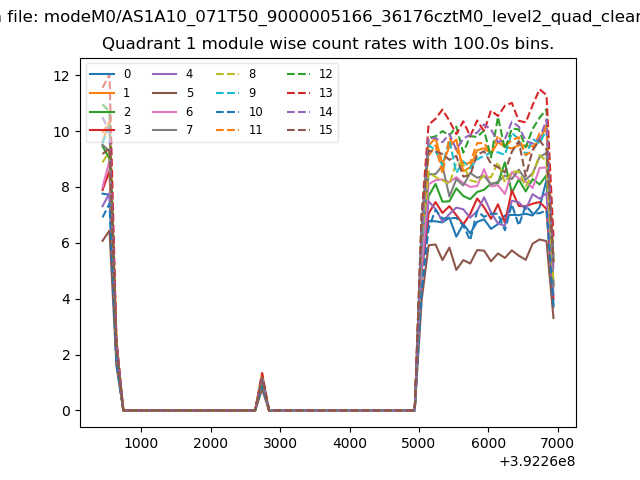
| Module-wise count rates for Quadrant A Data is divided into 100 sec bins |
 |
 |
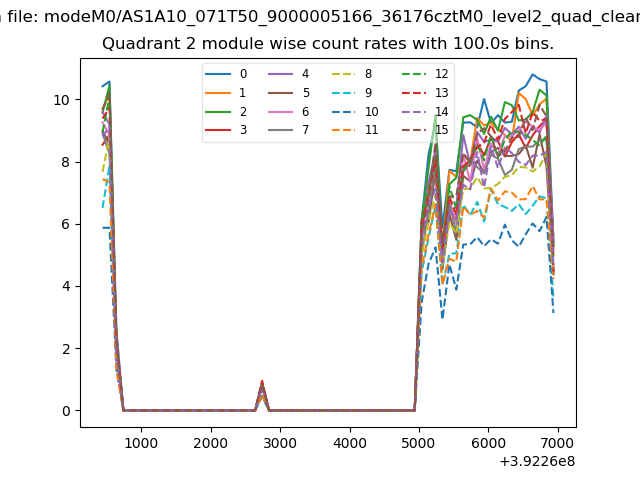
| Module-wise count rates for Quadrant B Data is divided into 100 sec bins |
 |
 |
| Module-wise count rates for Quadrant C Data is divided into 100 sec bins |
 |
 |
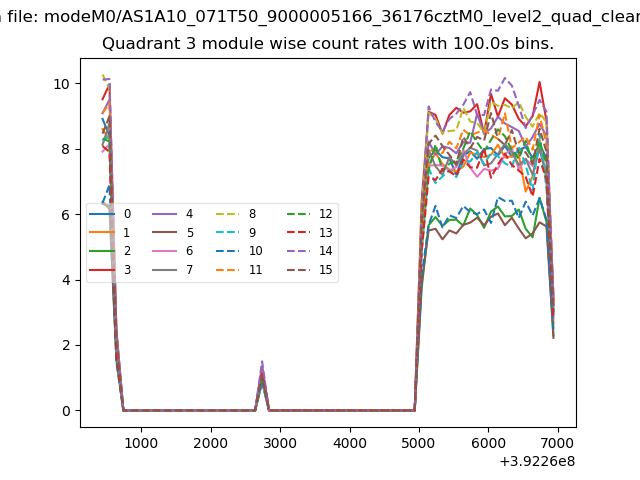
| Module-wise count rates for Quadrant D Data is divided into 100 sec bins |
 |
 |
| Parameter | Plot |
|---|---|
| CZT HV Monitor |  |
| D_VDD | 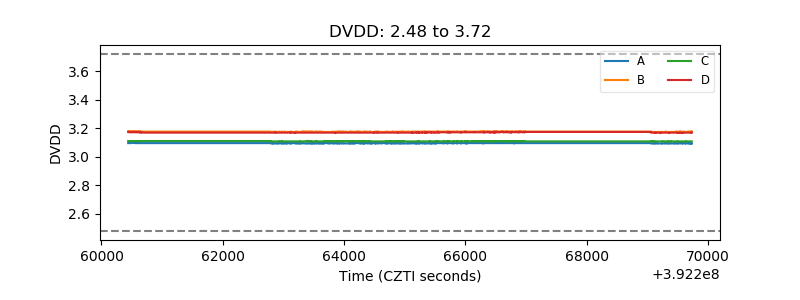 |
| Temperature 1 | 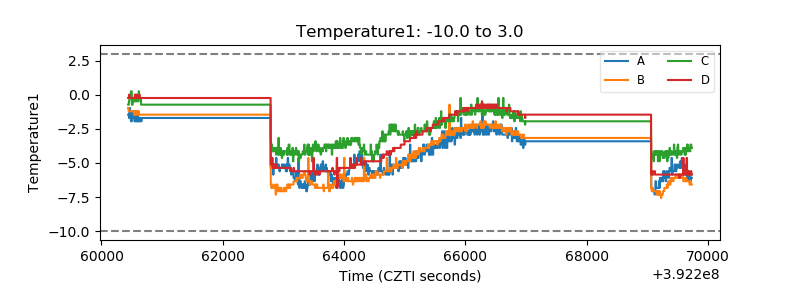 |
| Veto HV Monitor | 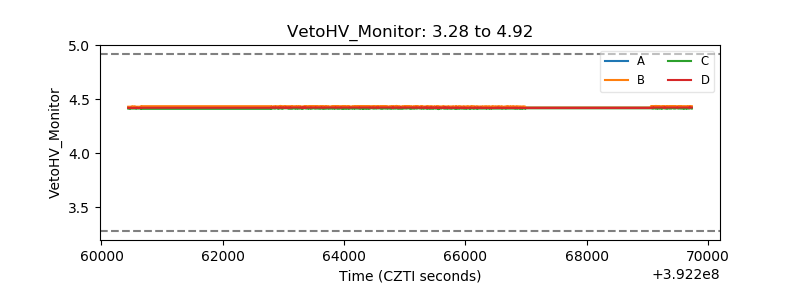 |
| Veto LLD | 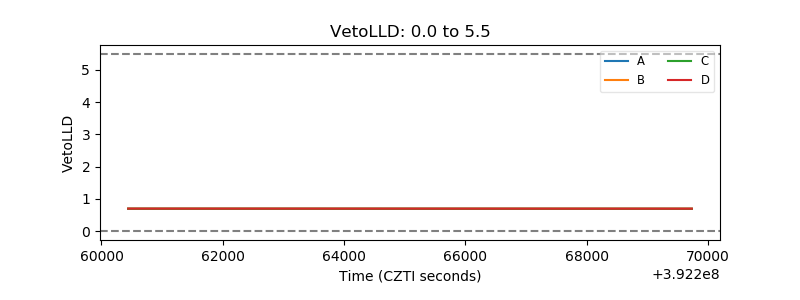 |
| Alpha Counter | 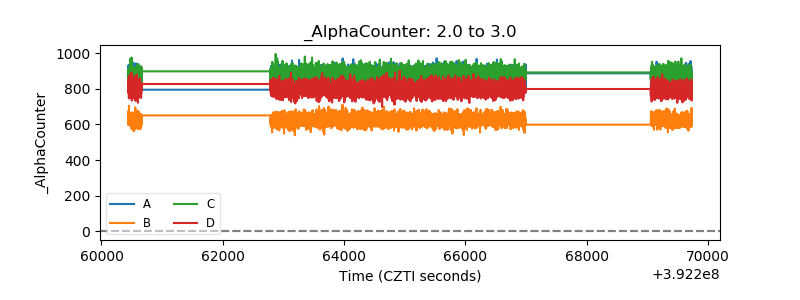 |
| _CPM_Rate | 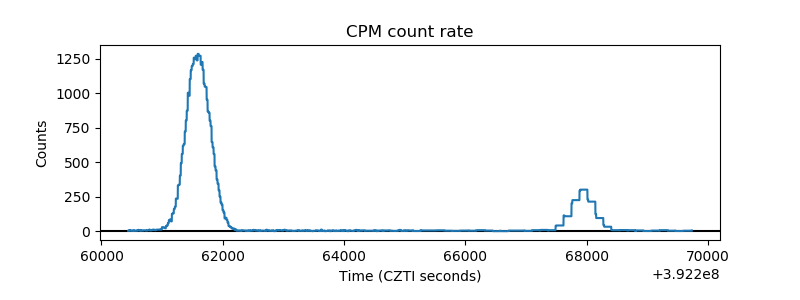 |
| CZT Counter | 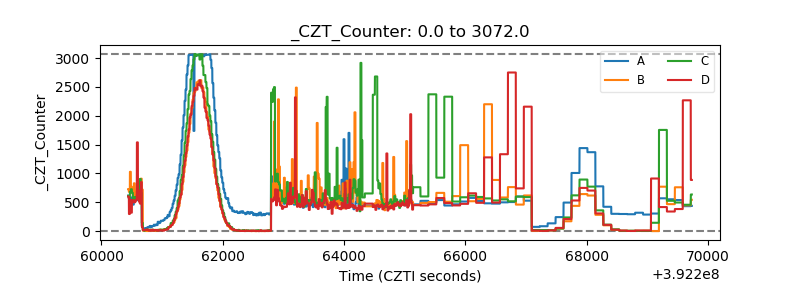 |
| +2.5 Volts monitor | 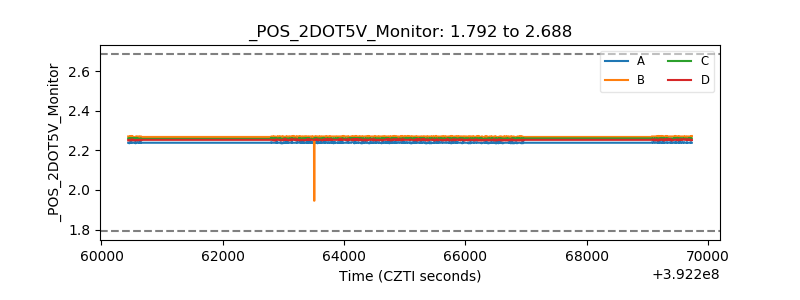 |
| +5 Volts monitor | 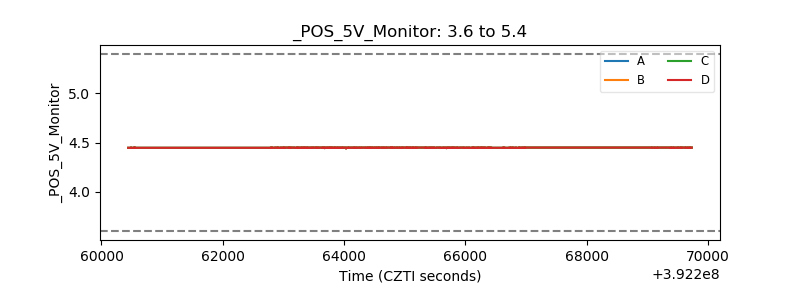 |
| _ROLL_ROT | 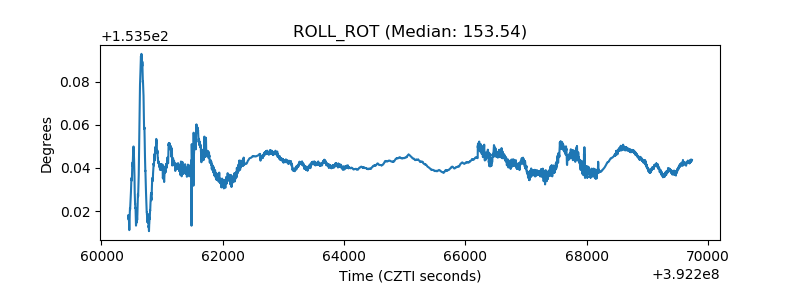 |
| _Roll_DEC | 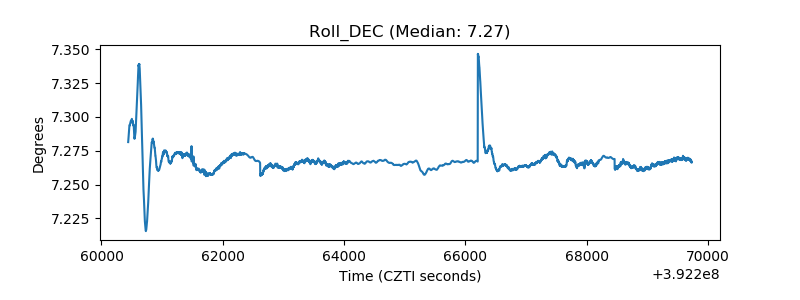 |
| _Roll_RA | 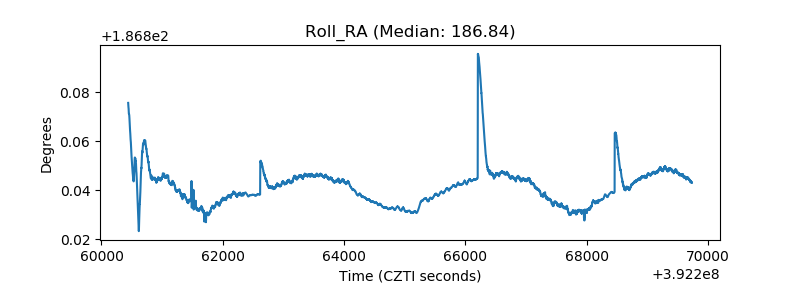 |
| Veto Counter | 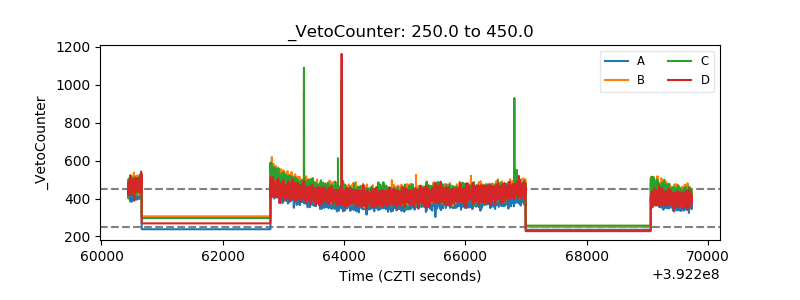 |