| Param | Original file | Final file |
|---|---|---|
| Filename | modeM0/AS1T05_009T05_9000005162_36173cztM0_level2.evt | modeM0/AS1T05_009T05_9000005162_36173cztM0_level2_quad_clean.evt |
| Size (bytes) | 324,241,920 | 66,346,560 |
| Size | 309.2 MB | 63.3 MB |
| Events in quadrant A | 1,870,764 | 433,746 |
| Events in quadrant B | 2,416,230 | 444,052 |
| Events in quadrant C | 2,082,787 | 454,153 |
| Events in quadrant D | 3,182,749 | 400,291 |
| Mode M9 | |||
|---|---|---|---|
| Quadrant | BADHDUFLAG | Total packets | Discarded packets |
| A | 0 | 20 | 0 |
| B | 0 | 20 | 0 |
| C | 0 | 20 | 0 |
| D | 0 | 20 | 0 |
| Mode SS | |||
|---|---|---|---|
| Quadrant | BADHDUFLAG | Total packets | Discarded packets |
| A | 0 | 80 | 0 |
| B | 0 | 80 | 0 |
| C | 0 | 80 | 0 |
| D | 0 | 80 | 0 |
| Mode M0 | |||
|---|---|---|---|
| Quadrant | BADHDUFLAG | Total packets | Discarded packets |
| A | 0 | 8096 | 2 |
| B | 0 | 9775 | 1 |
| C | 0 | 8518 | 1 |
| D | 0 | 12140 | 1 |
| Quadrant | Total seconds | Saturated seconds | Saturation percentage |
|---|---|---|---|
| A | 3921 | 6 | 0.153022% |
| B | 3921 | 90 | 2.295333% |
| C | 3921 | 23 | 0.586585% |
| D | 3921 | 381 | 9.716909% |
Noise dominated data is calculated using 1-second bins in cleaned event files. If a bin has >2000 counts, and if more than 50% of those come from <1% of pixels, then it is considered to be noise-dominated and hence unusable.
| Quadrant | # 1 sec bins | Bins with >0 counts | Bins with >2000 counts | High rate bins dominated by noise | Noise dominated (total time) | Noise dominated (detector-on time) | Marked lightcurve |
|---|---|---|---|---|---|---|---|
| A | 5924 | 3922 | 0 | 0 | 0.00% | 0.00% | 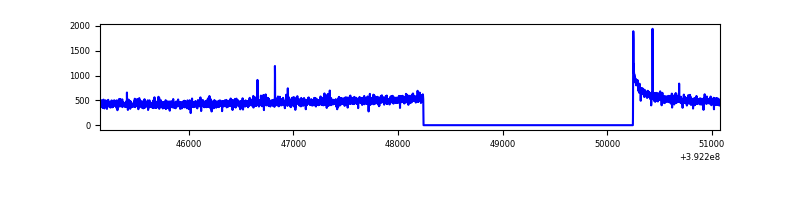 |
| B | 5924 | 3922 | 61 | 61 | 1.03% | 1.56% | 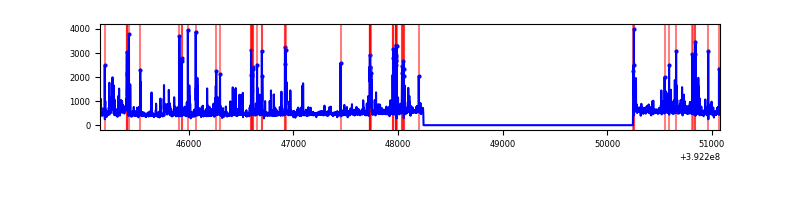 |
| C | 5924 | 3922 | 15 | 15 | 0.25% | 0.38% | 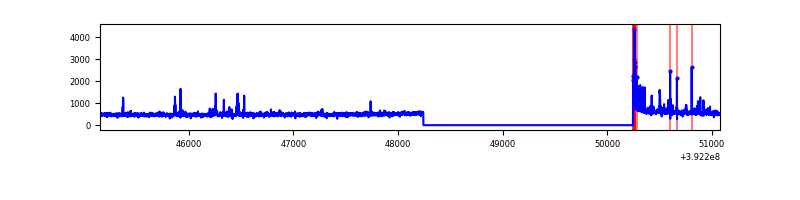 |
| D | 5924 | 3922 | 334 | 334 | 5.64% | 8.52% | 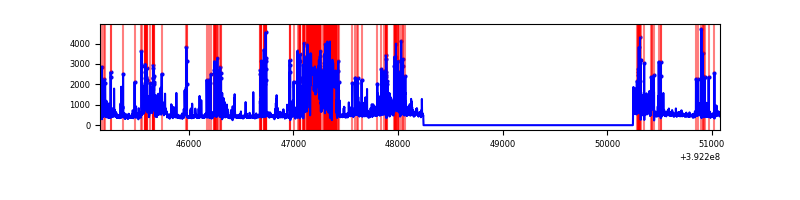 |
Top three noisy pixels from each quadrant. If the there are fewer than three noisy pixels in the level2.evt file, extra rows are filled as -1
| Pixel properties | Quadrant properties | ||||||
|---|---|---|---|---|---|---|---|
| Quadrant | DetID | PixID | Counts | Sigma | Mean | Median | Sigma |
| A | 10 | 83 | 102928 | 1138.07 | 451 | 443 | 90.1 |
| A | 8 | 144 | 9753 | 103.39 | 451 | 443 | 90.1 |
| A | 13 | 254 | 6968 | 72.46 | 451 | 443 | 90.1 |
| B | 5 | 172 | 278425 | 3251.14 | 451 | 439 | 85.5 |
| B | 4 | 171 | 268996 | 3140.87 | 451 | 439 | 85.5 |
| B | 0 | 190 | 47721 | 552.98 | 451 | 439 | 85.5 |
| C | 15 | 214 | 171434 | 1647.01 | 447 | 451 | 103.8 |
| C | 0 | 10 | 96802 | 928.11 | 447 | 451 | 103.8 |
| C | 1 | 23 | 58736 | 561.43 | 447 | 451 | 103.8 |
| D | 13 | 249 | 741014 | 7399.81 | 418 | 407 | 100.1 |
| D | 2 | 250 | 217556 | 2169.65 | 418 | 407 | 100.1 |
| D | 12 | 17 | 154657 | 1541.2 | 418 | 407 | 100.1 |
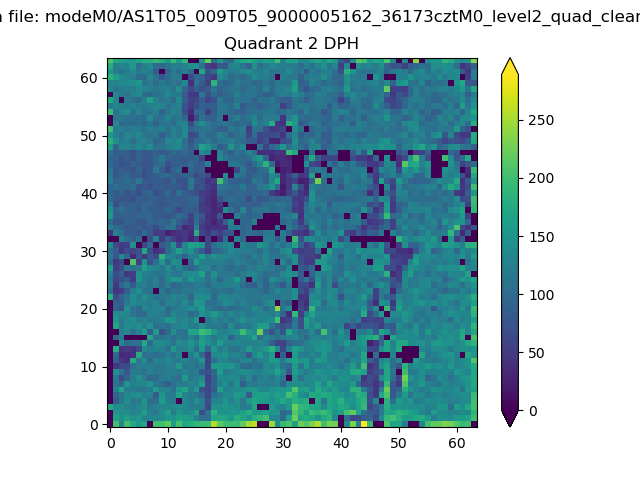
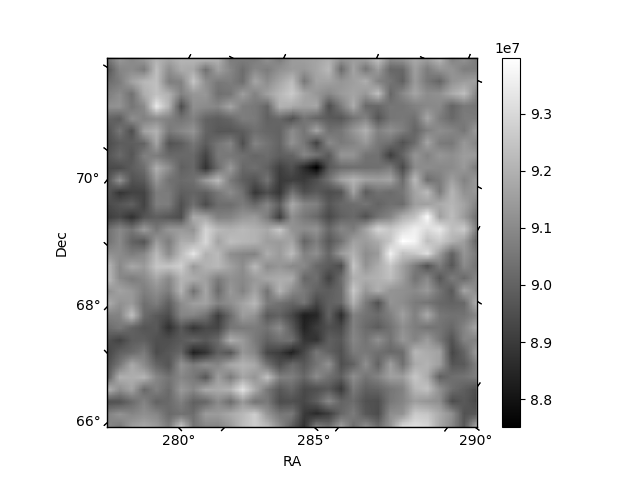
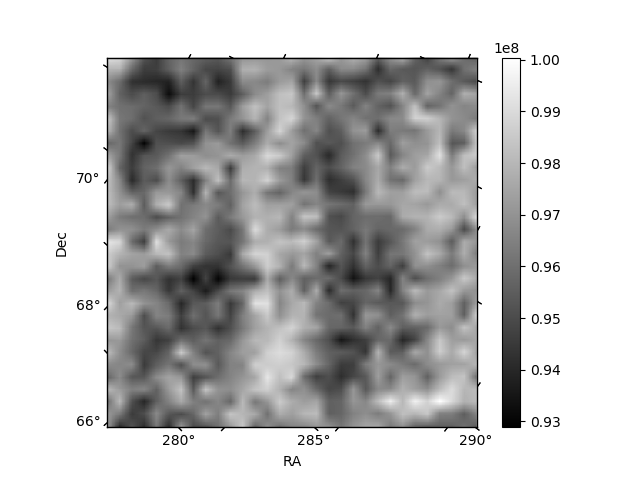
Histogram calculated using DETX and DETY for each event in the final _common_clean file
| Quadrant A | 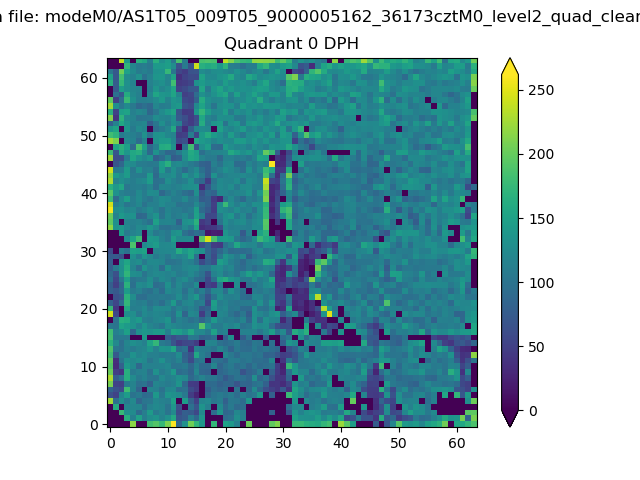 |
 |
Quadrant B |
|---|---|---|---|
| Quadrant D |  |
 |
Quadrant C |
| Plot type | Count rate plots | Images |
|---|---|---|
| Comparison with Poisson distribution Blue bars denote a histogram of data divided into 1 sec bins. Red curve is a Poisson curve with rate = median count rate of data. |
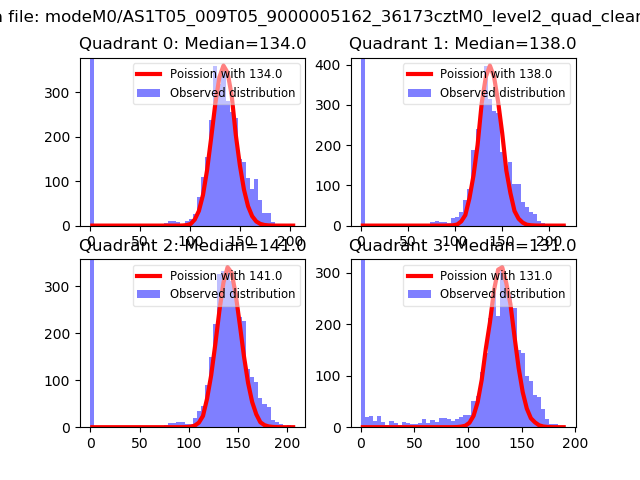 |
 |
| Quadrant-wise count rates Data is divided into 100 sec bins |
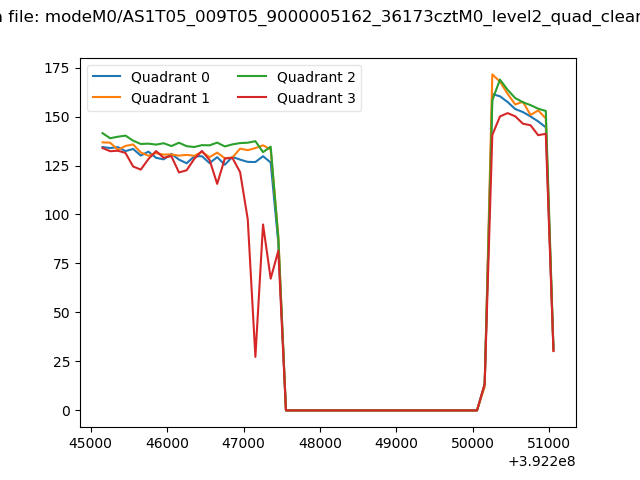 |
|
| Module-wise count rates for Quadrant A Data is divided into 100 sec bins |
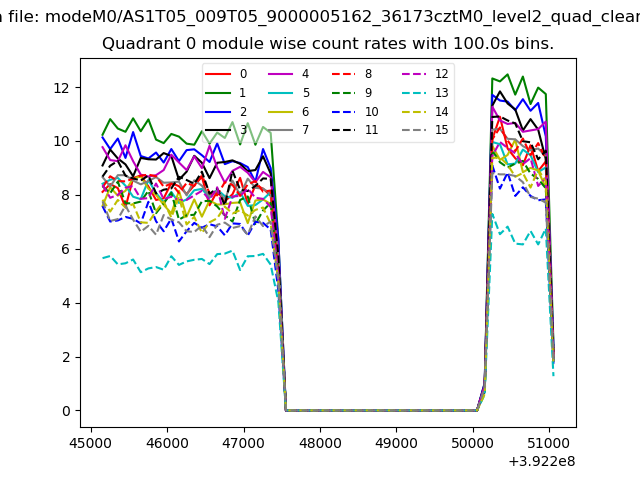 |
 |
| Module-wise count rates for Quadrant B Data is divided into 100 sec bins |
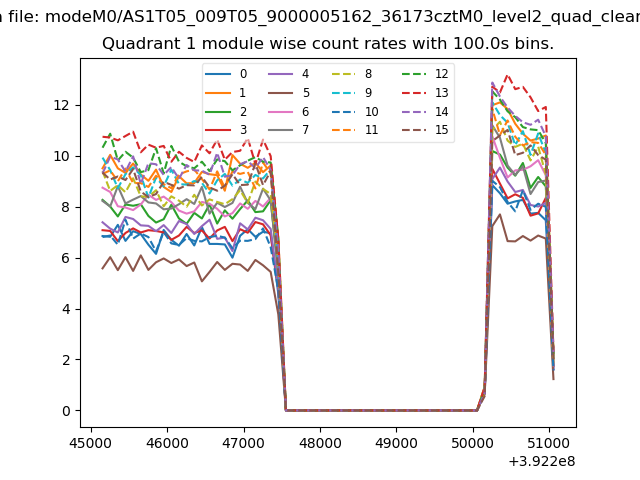 |
 |
| Module-wise count rates for Quadrant C Data is divided into 100 sec bins |
 |
 |
| Module-wise count rates for Quadrant D Data is divided into 100 sec bins |
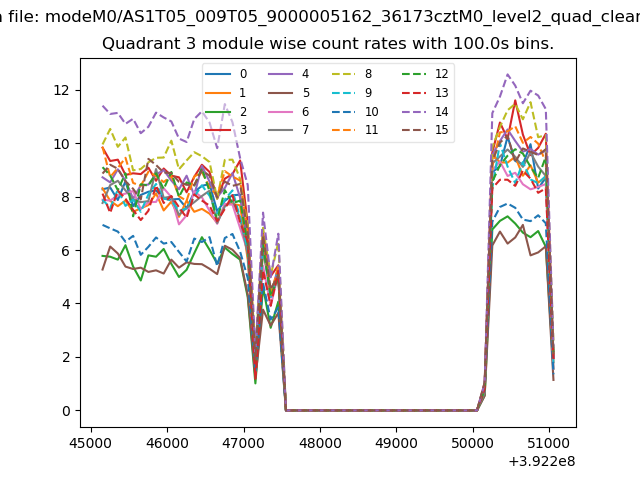 |
 |
| Parameter | Plot |
|---|---|
| CZT HV Monitor | 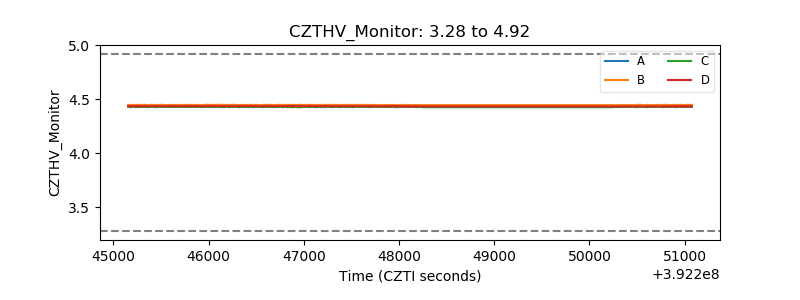 |
| D_VDD | 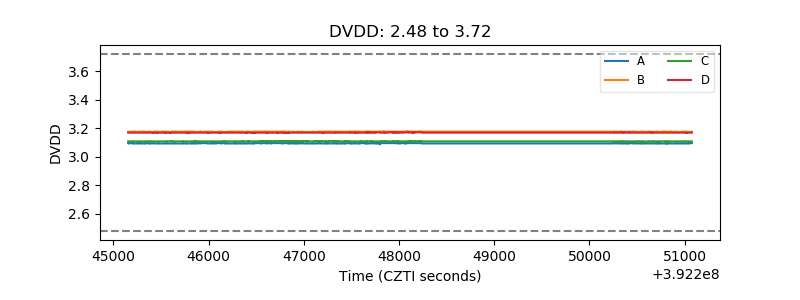 |
| Temperature 1 | 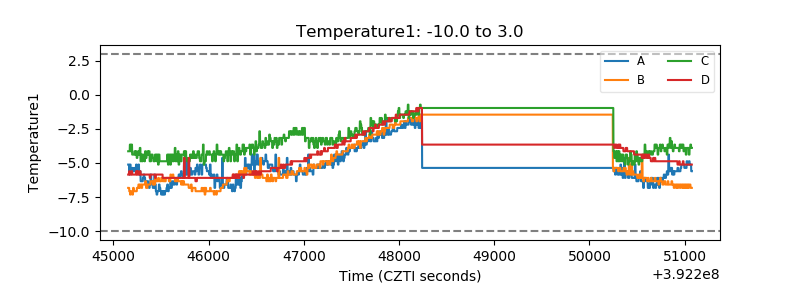 |
| Veto HV Monitor | 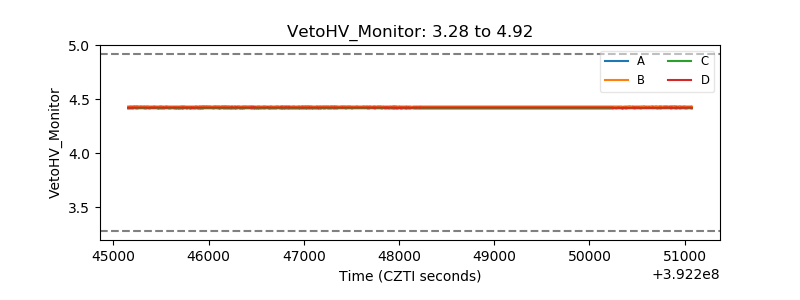 |
| Veto LLD | 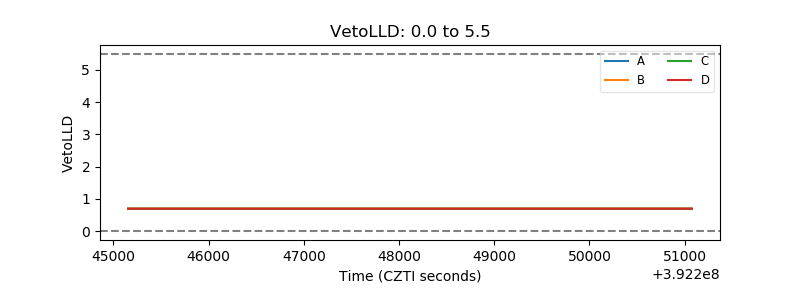 |
| Alpha Counter | 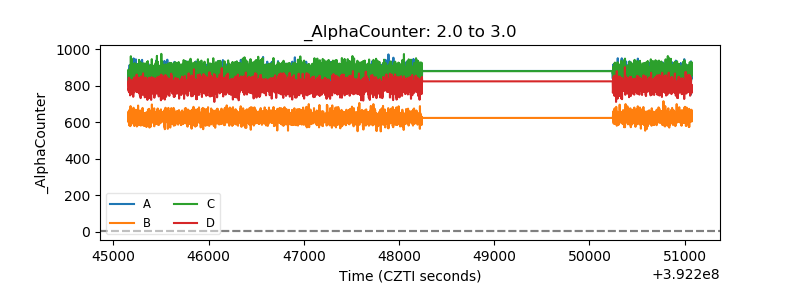 |
| _CPM_Rate | 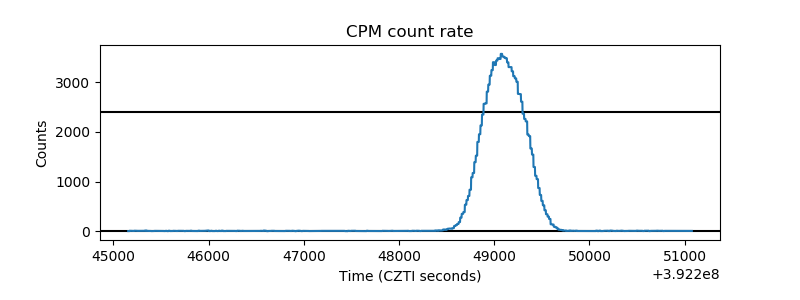 |
| CZT Counter |  |
| +2.5 Volts monitor | 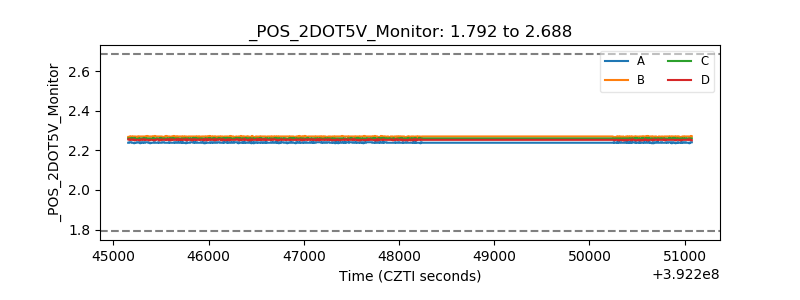 |
| +5 Volts monitor | 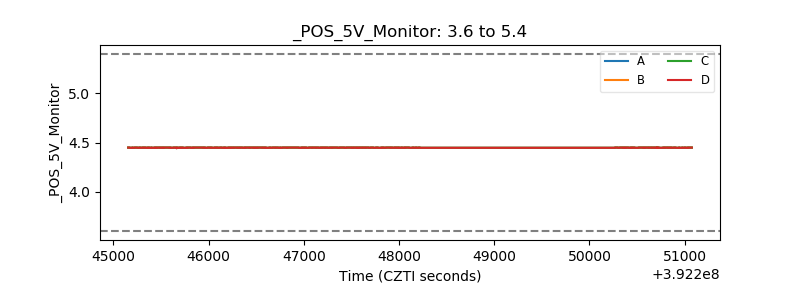 |
| _ROLL_ROT | 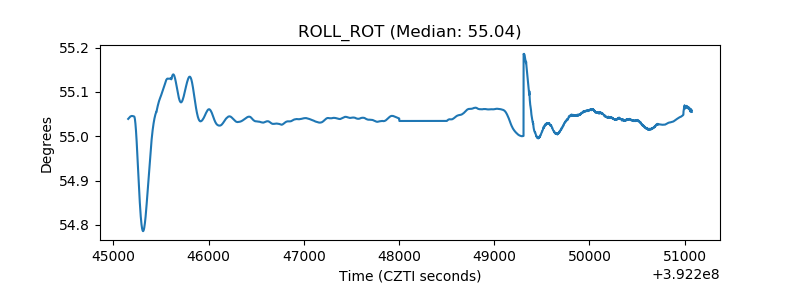 |
| _Roll_DEC | 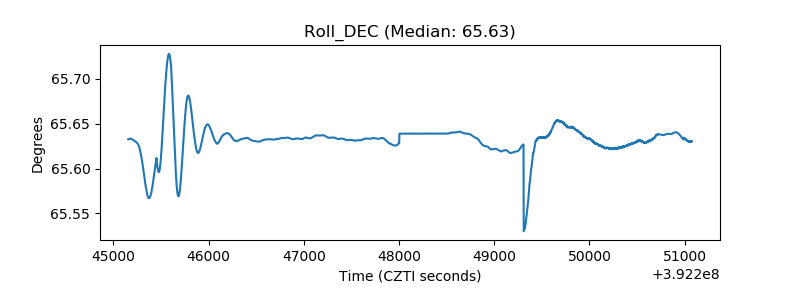 |
| _Roll_RA | 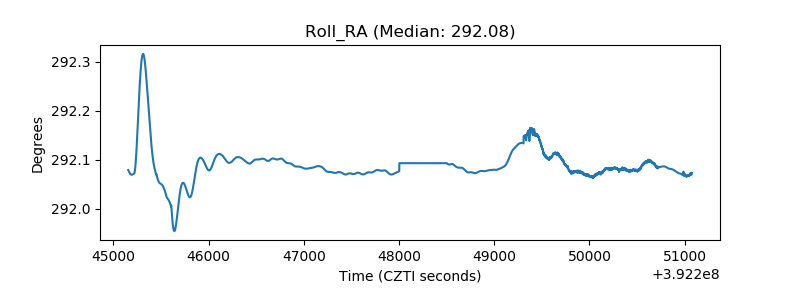 |
| Veto Counter | 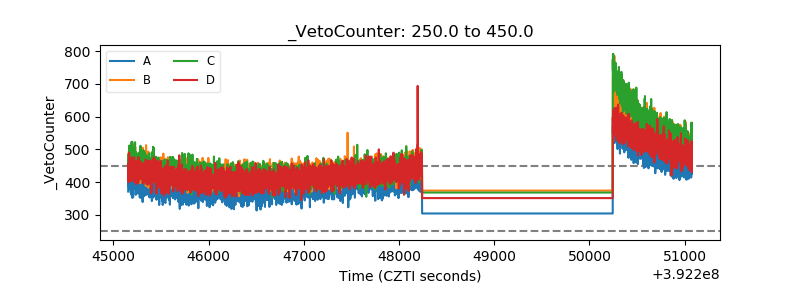 |