| Param | Original file | Final file |
|---|---|---|
| Filename | modeM0/AS1T05_009T03_9000005164_36175cztM0_level2.evt | modeM0/AS1T05_009T03_9000005164_36175cztM0_level2_quad_clean.evt |
| Size (bytes) | 203,313,600 | 53,988,480 |
| Size | 193.9 MB | 51.5 MB |
| Events in quadrant A | 1,244,644 | 357,987 |
| Events in quadrant B | 1,776,576 | 364,068 |
| Events in quadrant C | 1,644,885 | 370,002 |
| Events in quadrant D | 1,306,804 | 350,573 |
| Mode M9 | |||
|---|---|---|---|
| Quadrant | BADHDUFLAG | Total packets | Discarded packets |
| A | 0 | 9 | 0 |
| B | 0 | 9 | 0 |
| C | 0 | 9 | 0 |
| D | 0 | 10 | 0 |
| Mode M0 | |||
|---|---|---|---|
| Quadrant | BADHDUFLAG | Total packets | Discarded packets |
| A | 0 | 5522 | 1 |
| B | 0 | 7087 | 1 |
| C | 0 | 6507 | 1 |
| D | 0 | 5819 | 1 |
| Mode SS | |||
|---|---|---|---|
| Quadrant | BADHDUFLAG | Total packets | Discarded packets |
| A | 0 | 54 | 0 |
| B | 0 | 54 | 0 |
| C | 0 | 54 | 0 |
| D | 0 | 54 | 0 |
| Quadrant | Total seconds | Saturated seconds | Saturation percentage |
|---|---|---|---|
| A | 2684 | 3 | 0.111773% |
| B | 2684 | 98 | 3.651267% |
| C | 2684 | 55 | 2.049180% |
| D | 2684 | 23 | 0.856930% |
Noise dominated data is calculated using 1-second bins in cleaned event files. If a bin has >2000 counts, and if more than 50% of those come from <1% of pixels, then it is considered to be noise-dominated and hence unusable.
| Quadrant | # 1 sec bins | Bins with >0 counts | Bins with >2000 counts | High rate bins dominated by noise | Noise dominated (total time) | Noise dominated (detector-on time) | Marked lightcurve |
|---|---|---|---|---|---|---|---|
| A | 2684 | 2684 | 0 | 0 | 0.00% | 0.00% | 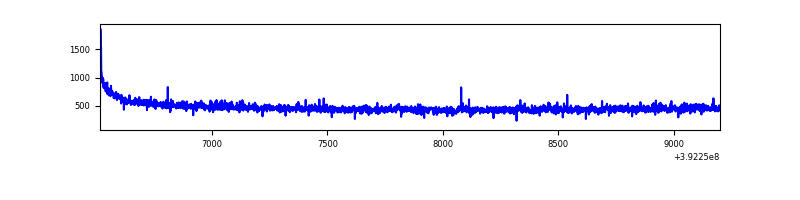 |
| B | 2684 | 2684 | 75 | 75 | 2.79% | 2.79% | 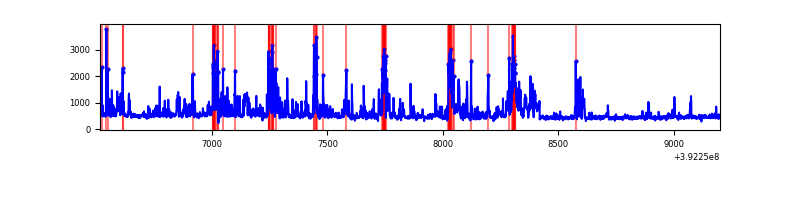 |
| C | 2684 | 2684 | 49 | 49 | 1.83% | 1.83% |  |
| D | 2684 | 2684 | 17 | 17 | 0.63% | 0.63% | 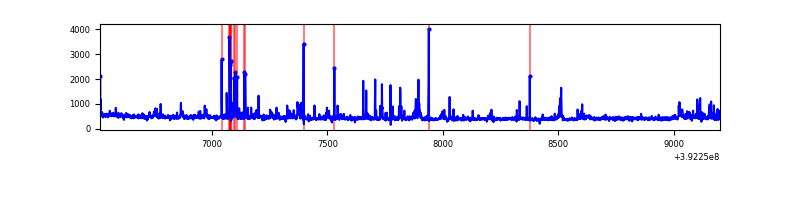 |
Top three noisy pixels from each quadrant. If the there are fewer than three noisy pixels in the level2.evt file, extra rows are filled as -1
| Pixel properties | Quadrant properties | ||||||
|---|---|---|---|---|---|---|---|
| Quadrant | DetID | PixID | Counts | Sigma | Mean | Median | Sigma |
| A | 10 | 83 | 86417 | 1426.71 | 296 | 290 | 60.4 |
| A | 8 | 144 | 7545 | 120.18 | 296 | 290 | 60.4 |
| A | 13 | 254 | 4979 | 77.67 | 296 | 290 | 60.4 |
| B | 5 | 172 | 307241 | 5432.83 | 297 | 290 | 56.5 |
| B | 4 | 171 | 281086 | 4969.91 | 297 | 290 | 56.5 |
| B | 4 | 232 | 8884 | 152.11 | 297 | 290 | 56.5 |
| C | 15 | 208 | 245334 | 3569.58 | 293 | 295 | 68.6 |
| C | 15 | 214 | 121271 | 1762.31 | 293 | 295 | 68.6 |
| C | 0 | 10 | 97673 | 1418.54 | 293 | 295 | 68.6 |
| D | 13 | 249 | 68215 | 967.94 | 286 | 279 | 70.2 |
| D | 10 | 118 | 32787 | 463.17 | 286 | 279 | 70.2 |
| D | 13 | 171 | 30914 | 436.48 | 286 | 279 | 70.2 |
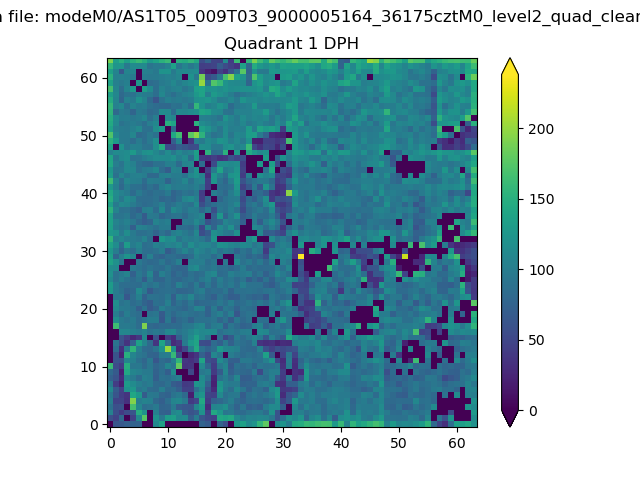
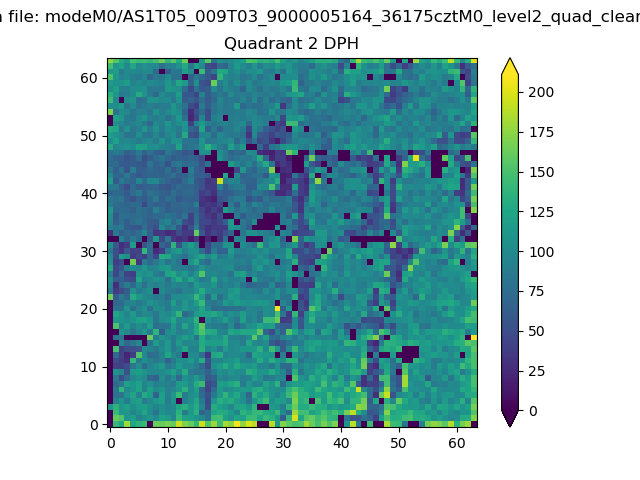
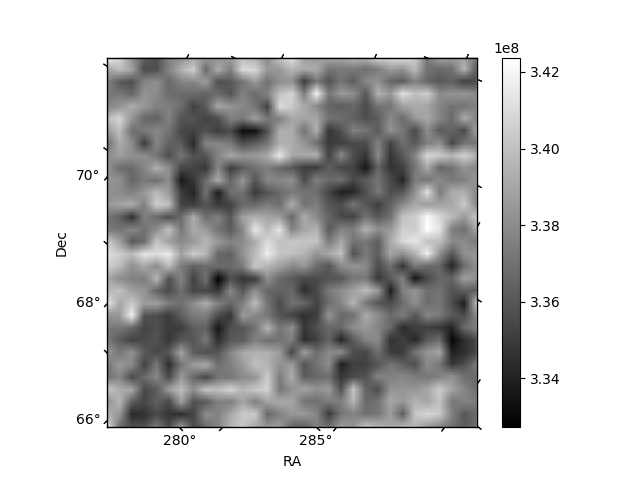
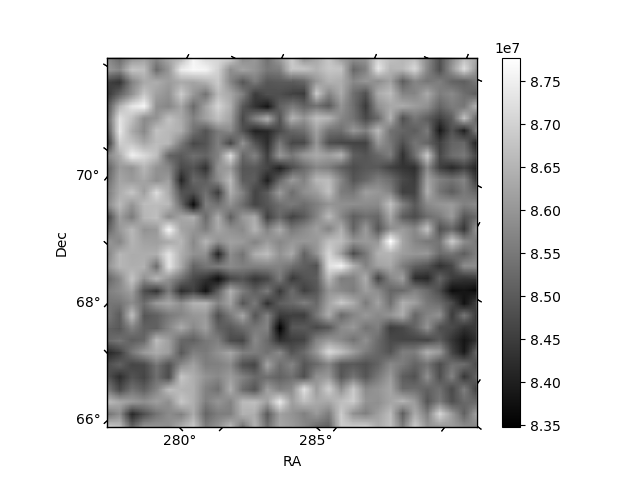
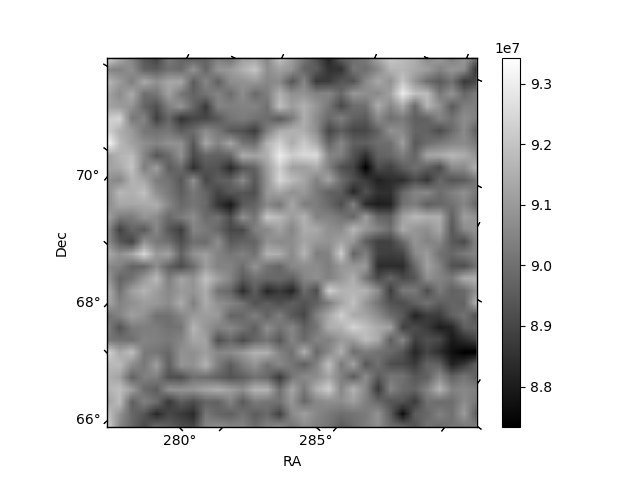
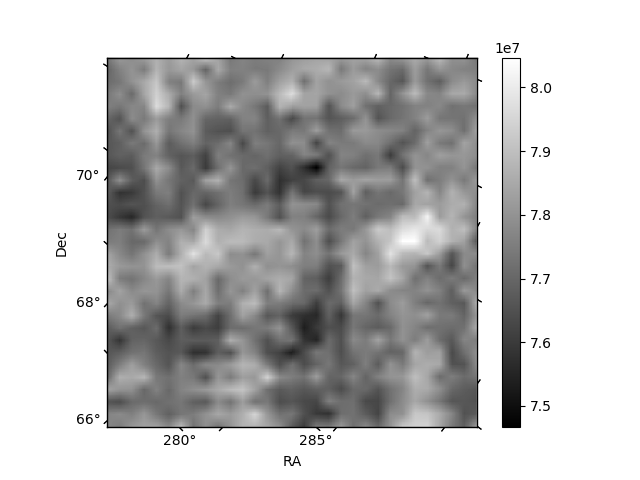
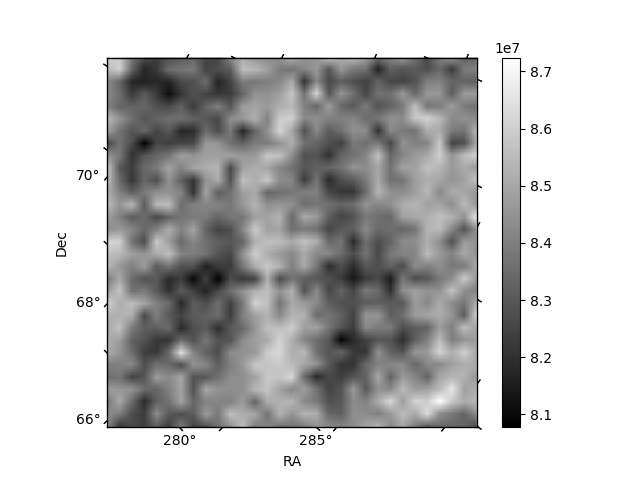
Histogram calculated using DETX and DETY for each event in the final _common_clean file
| Quadrant A |  |
 |
Quadrant B |
|---|---|---|---|
| Quadrant D | 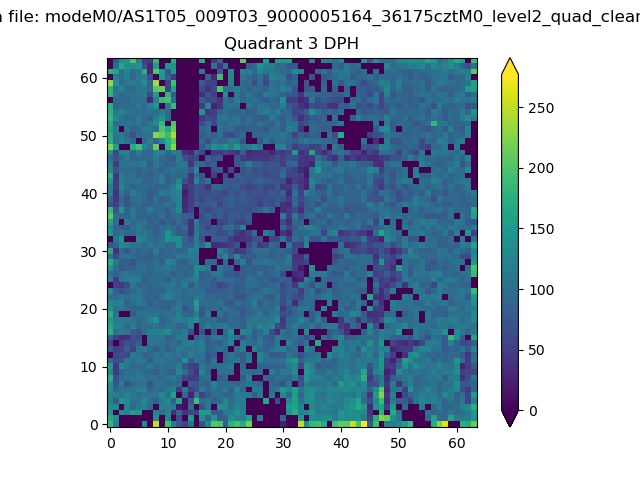 |
 |
Quadrant C |
| Plot type | Count rate plots | Images |
|---|---|---|
| Comparison with Poisson distribution Blue bars denote a histogram of data divided into 1 sec bins. Red curve is a Poisson curve with rate = median count rate of data. |
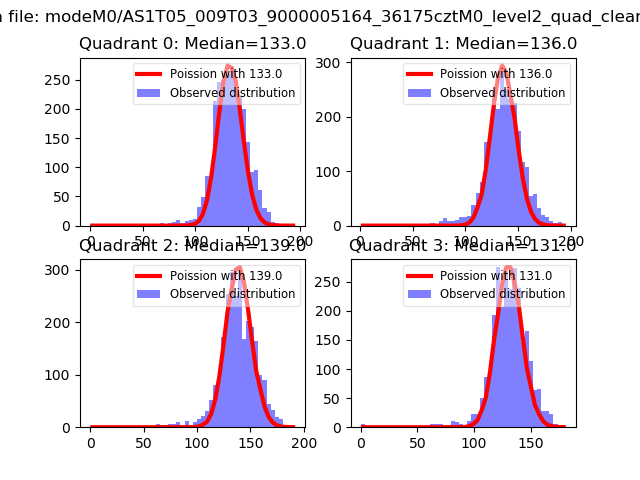 |
 |
| Quadrant-wise count rates Data is divided into 100 sec bins |
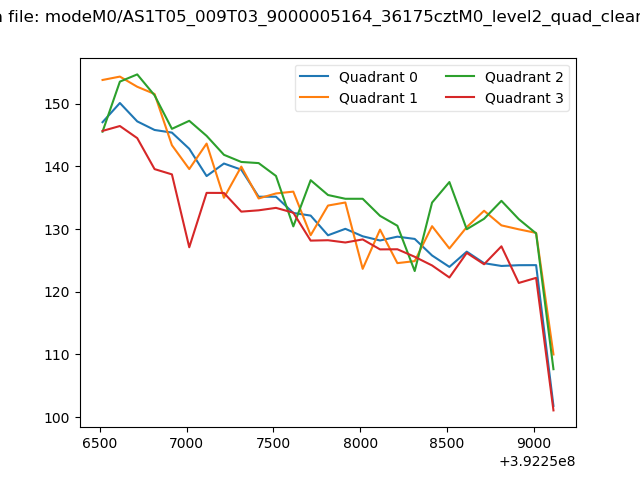 |
|
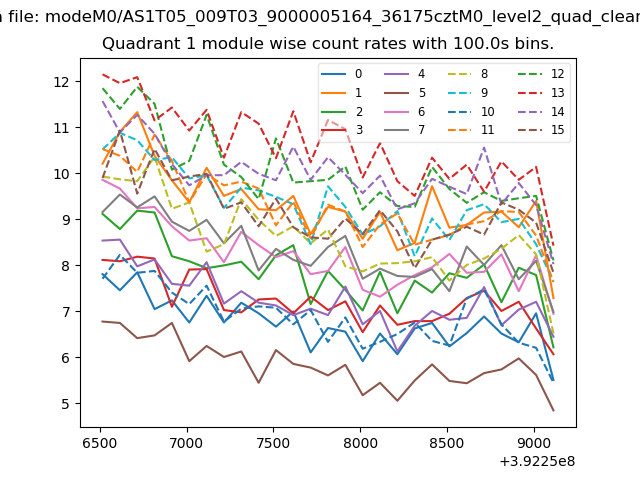
| Module-wise count rates for Quadrant A Data is divided into 100 sec bins |
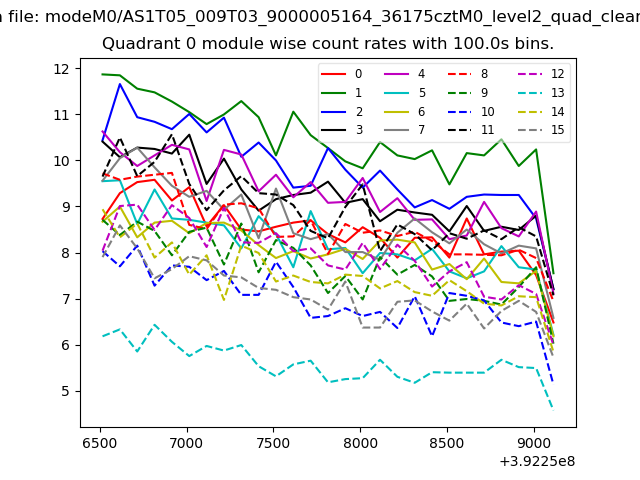 |
 |
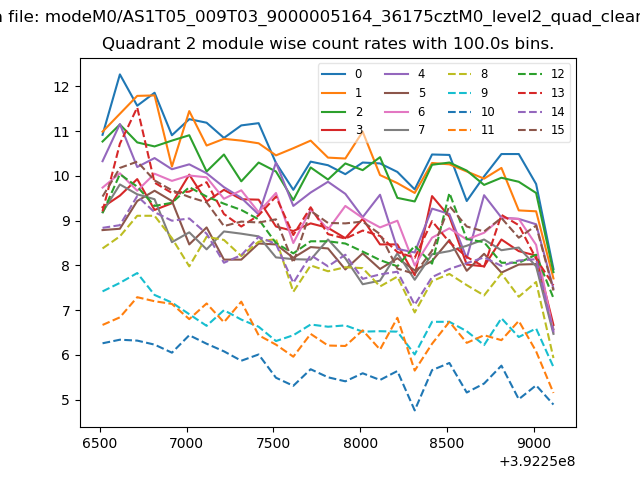
| Module-wise count rates for Quadrant B Data is divided into 100 sec bins |
 |
 |
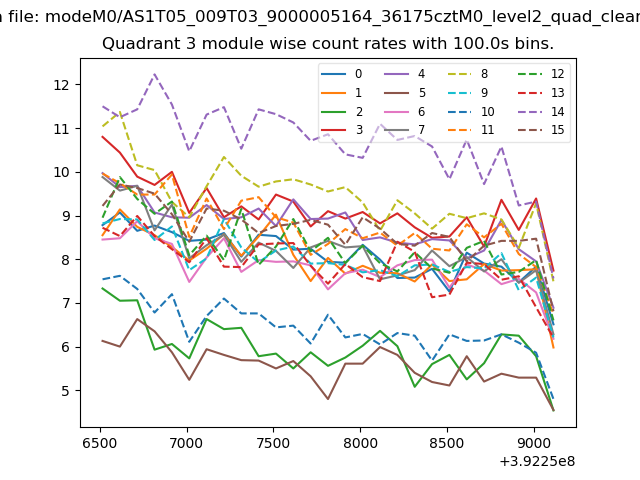
| Module-wise count rates for Quadrant C Data is divided into 100 sec bins |
 |
 |
| Module-wise count rates for Quadrant D Data is divided into 100 sec bins |
 |
 |
| Parameter | Plot |
|---|---|
| CZT HV Monitor | 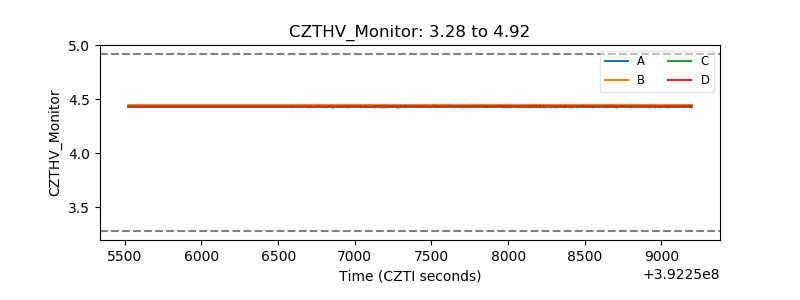 |
| D_VDD | 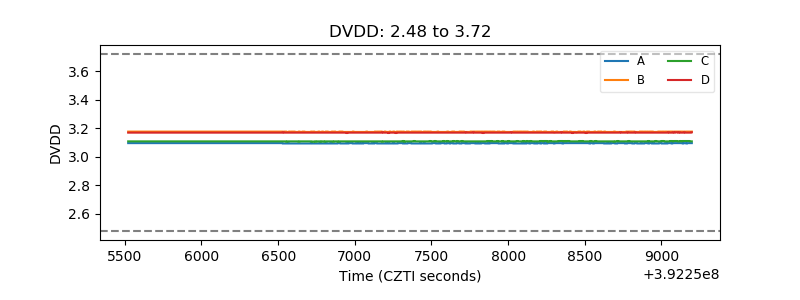 |
| Temperature 1 | 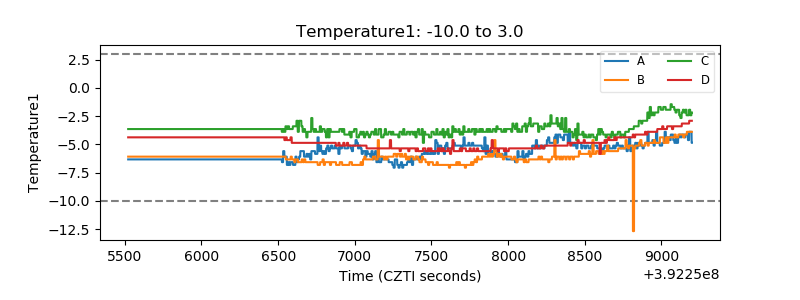 |
| Veto HV Monitor |  |
| Veto LLD | 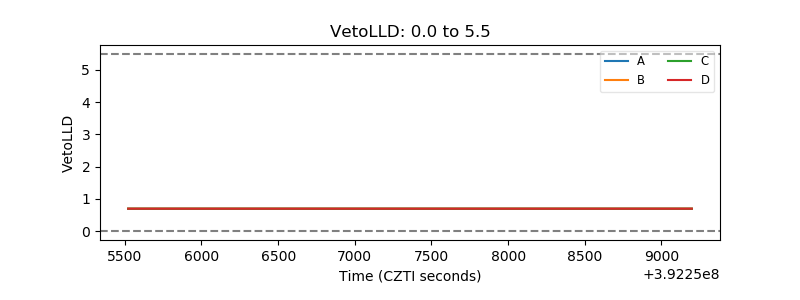 |
| Alpha Counter | 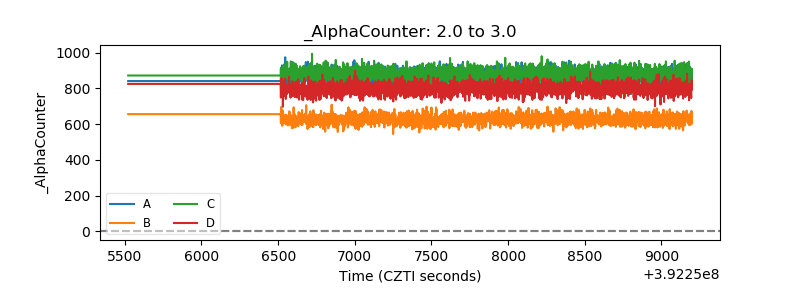 |
| _CPM_Rate | 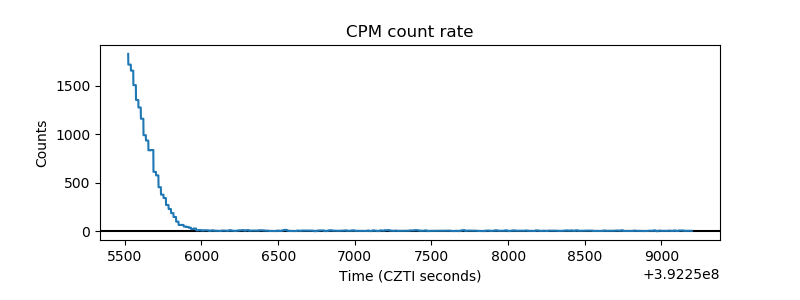 |
| CZT Counter | 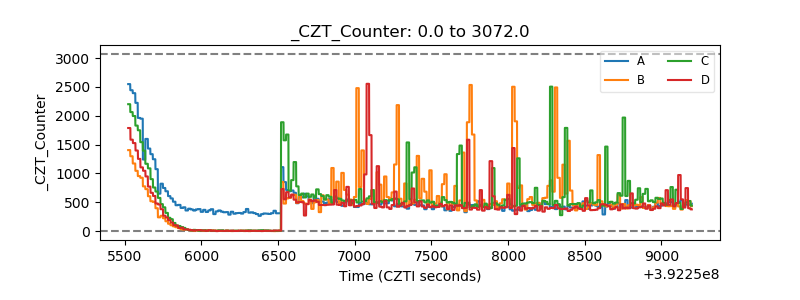 |
| +2.5 Volts monitor | 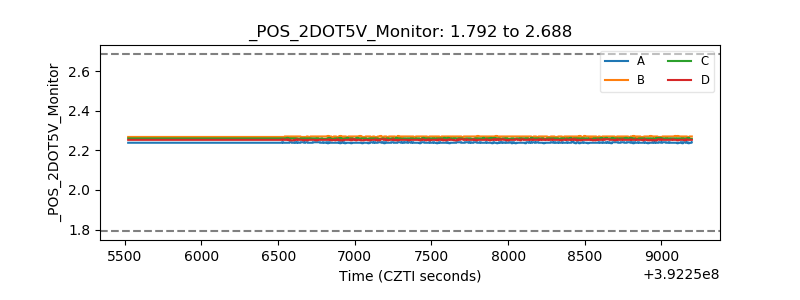 |
| +5 Volts monitor | 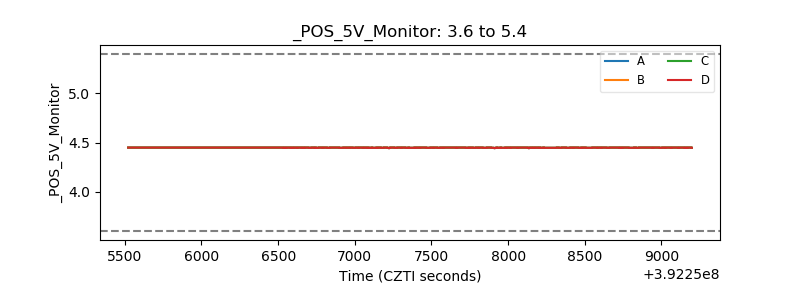 |
| _ROLL_ROT | 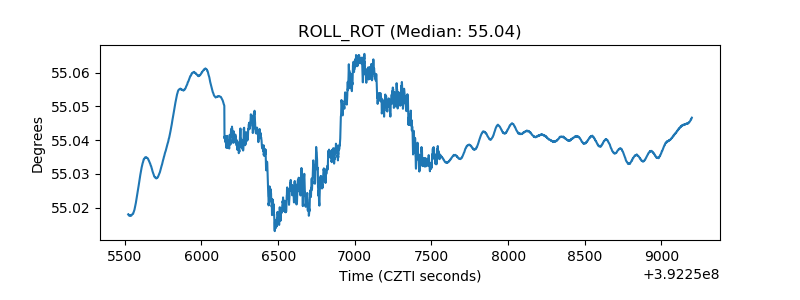 |
| _Roll_DEC | 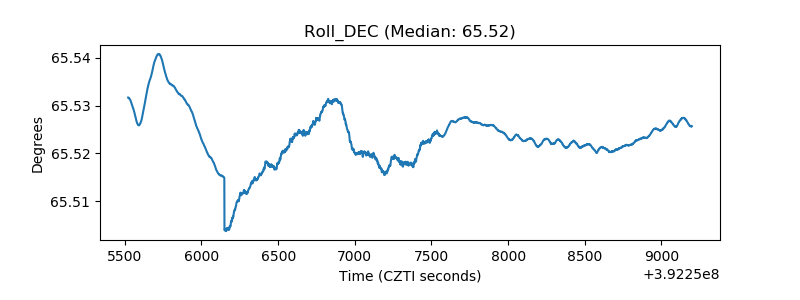 |
| _Roll_RA | 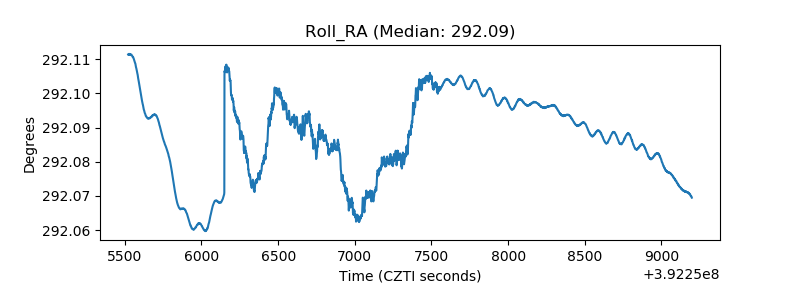 |
| Veto Counter | 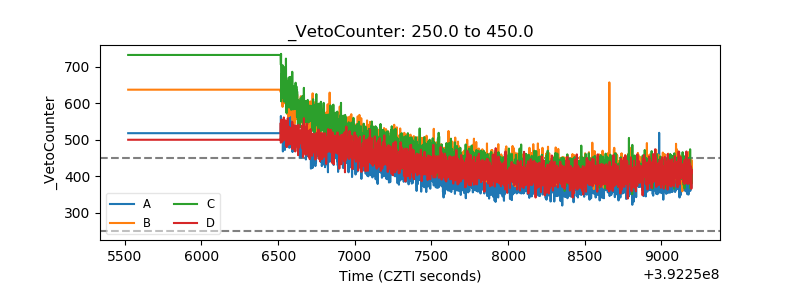 |