| Param | Original file | Final file |
|---|---|---|
| Filename | modeM0/AS1A11_059T08_9000005160_36173cztM0_level2.evt | modeM0/AS1A11_059T08_9000005160_36173cztM0_level2_quad_clean.evt |
| Size (bytes) | 24,361,920 | 4,403,520 |
| Size | 23.2 MB | 4.2 MB |
| Events in quadrant A | 151,049 | 28,617 |
| Events in quadrant B | 175,830 | 28,770 |
| Events in quadrant C | 264,663 | 26,329 |
| Events in quadrant D | 130,305 | 27,941 |
| Mode M9 | |||
|---|---|---|---|
| Quadrant | BADHDUFLAG | Total packets | Discarded packets |
| A | 0 | 12 | 0 |
| B | 0 | 12 | 0 |
| C | 0 | 12 | 0 |
| D | 0 | 13 | 0 |
| Mode M0 | |||
|---|---|---|---|
| Quadrant | BADHDUFLAG | Total packets | Discarded packets |
| A | 0 | 589 | 1 |
| B | 0 | 651 | 1 |
| C | 0 | 922 | 1 |
| D | 0 | 517 | 1 |
| Mode SS | |||
|---|---|---|---|
| Quadrant | BADHDUFLAG | Total packets | Discarded packets |
| A | 0 | 4 | 0 |
| B | 0 | 4 | 0 |
| C | 0 | 4 | 0 |
| D | 0 | 4 | 0 |
| Quadrant | Total seconds | Saturated seconds | Saturation percentage |
|---|---|---|---|
| A | 181 | 4 | 2.209945% |
| B | 181 | 25 | 13.812155% |
| C | 181 | 57 | 31.491713% |
| D | 181 | 1 | 0.552486% |
Noise dominated data is calculated using 1-second bins in cleaned event files. If a bin has >2000 counts, and if more than 50% of those come from <1% of pixels, then it is considered to be noise-dominated and hence unusable.
| Quadrant | # 1 sec bins | Bins with >0 counts | Bins with >2000 counts | High rate bins dominated by noise | Noise dominated (total time) | Noise dominated (detector-on time) | Marked lightcurve |
|---|---|---|---|---|---|---|---|
| A | 181 | 181 | 3 | 3 | 1.66% | 1.66% | 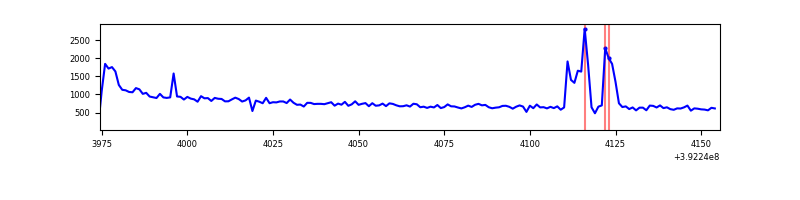 |
| B | 181 | 181 | 16 | 16 | 8.84% | 8.84% | 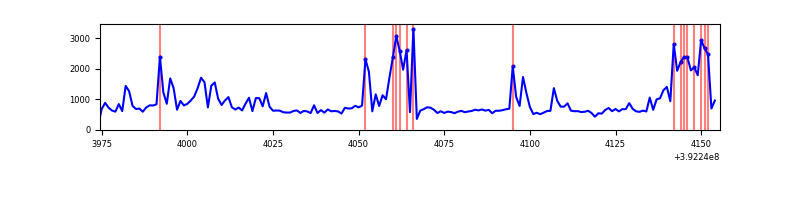 |
| C | 181 | 181 | 46 | 46 | 25.41% | 25.41% | 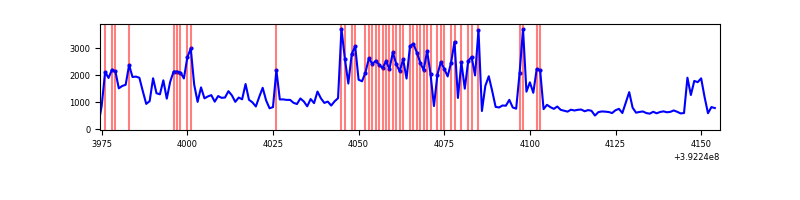 |
| D | 181 | 181 | 0 | 0 | 0.00% | 0.00% | 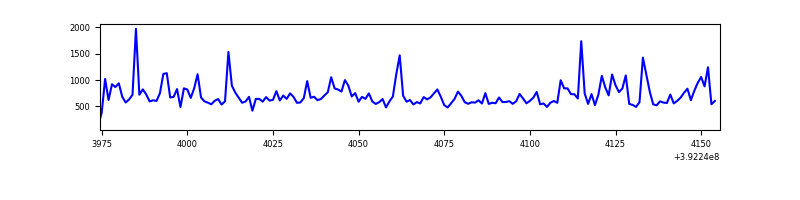 |
Top three noisy pixels from each quadrant. If the there are fewer than three noisy pixels in the level2.evt file, extra rows are filled as -1
| Pixel properties | Quadrant properties | ||||||
|---|---|---|---|---|---|---|---|
| Quadrant | DetID | PixID | Counts | Sigma | Mean | Median | Sigma |
| A | 10 | 83 | 36861 | 5213.69 | 25 | 24 | 7.1 |
| A | 9 | 143 | 14929 | 2109.57 | 25 | 24 | 7.1 |
| A | 10 | 67 | 1842 | 257.31 | 25 | 24 | 7.1 |
| B | 5 | 172 | 57787 | 8649.68 | 24 | 23 | 6.7 |
| B | 4 | 171 | 16823 | 2515.66 | 24 | 23 | 6.7 |
| B | 0 | 190 | 2063 | 305.47 | 24 | 23 | 6.7 |
| C | 0 | 10 | 115670 | 15780.15 | 23 | 23 | 7.3 |
| C | 1 | 23 | 48239 | 6579.12 | 23 | 23 | 7.3 |
| C | 15 | 214 | 9808 | 1335.17 | 23 | 23 | 7.3 |
| D | 2 | 250 | 15483 | 2034.03 | 24 | 23 | 7.6 |
| D | 13 | 171 | 5993 | 785.46 | 24 | 23 | 7.6 |
| D | 12 | 6 | 4323 | 565.74 | 24 | 23 | 7.6 |
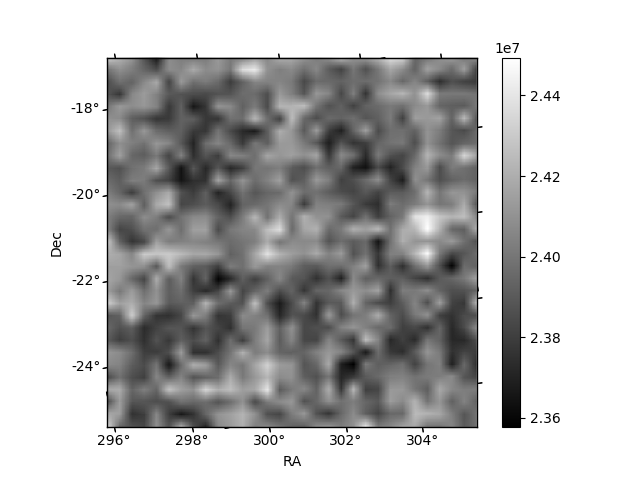
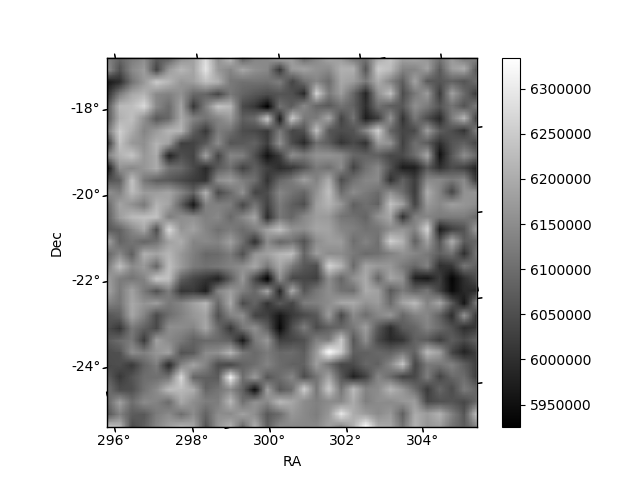
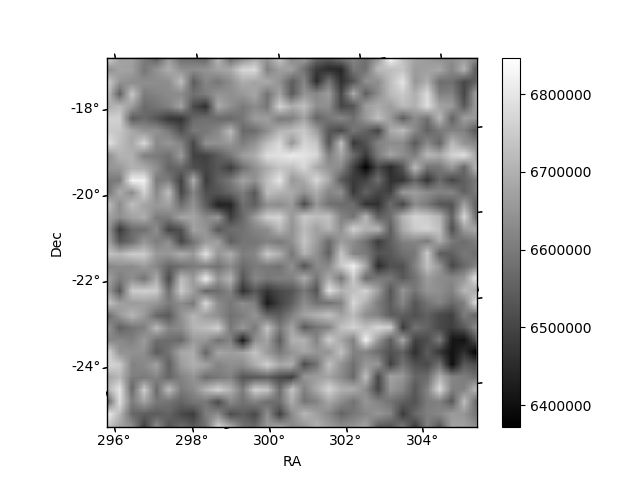
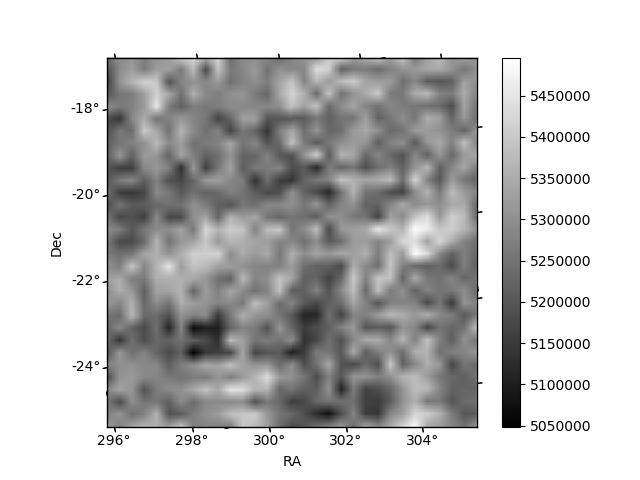
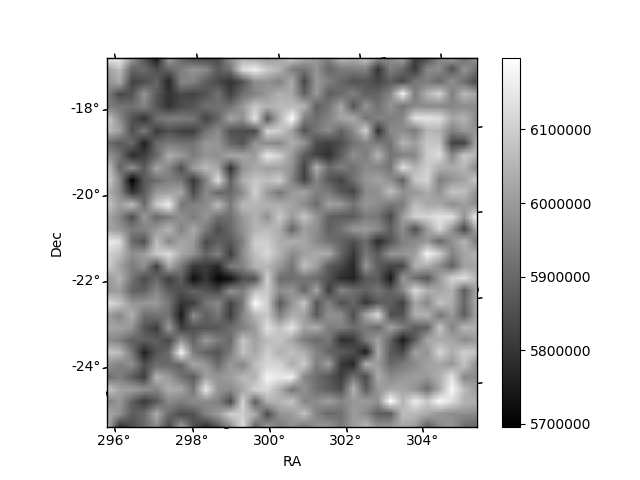
Histogram calculated using DETX and DETY for each event in the final _common_clean file
| Quadrant A | 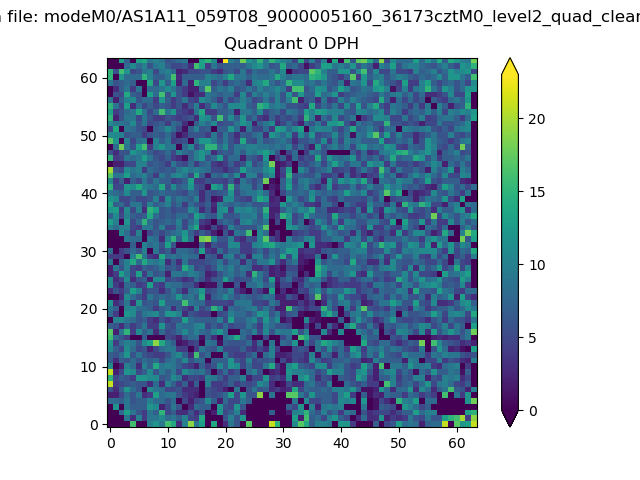 |
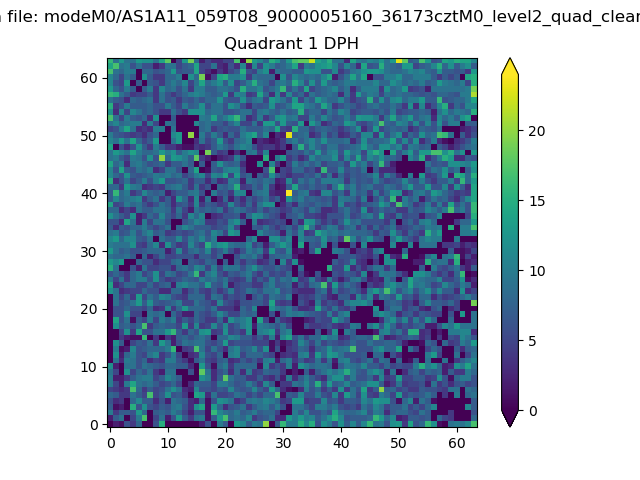 |
Quadrant B |
|---|---|---|---|
| Quadrant D | 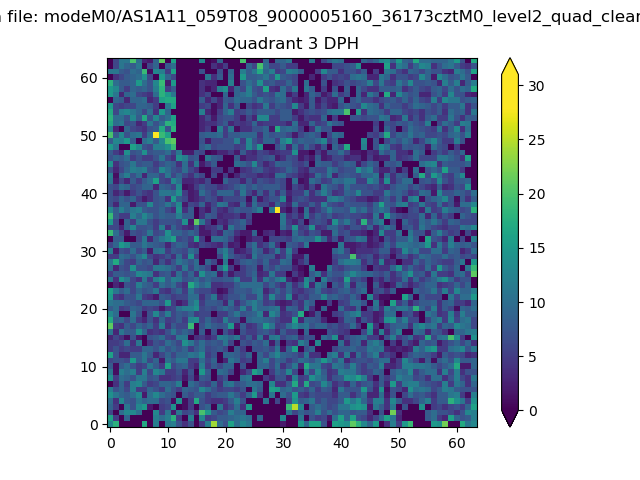 |
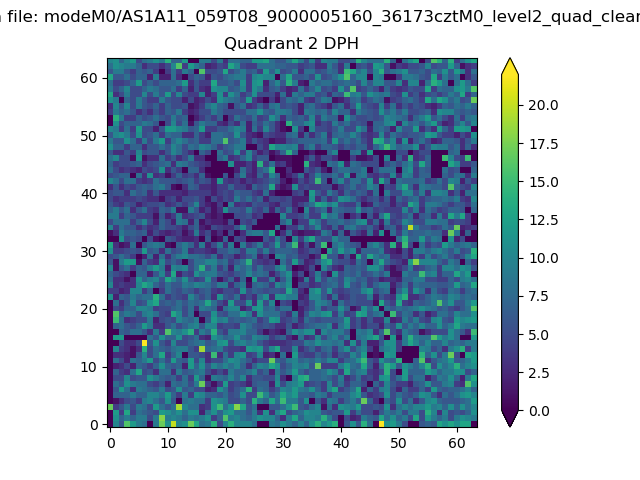 |
Quadrant C |
| Plot type | Count rate plots | Images |
|---|---|---|
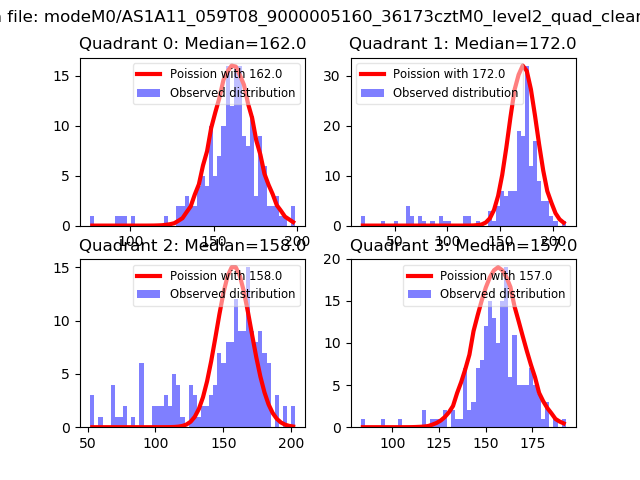
| Comparison with Poisson distribution Blue bars denote a histogram of data divided into 1 sec bins. Red curve is a Poisson curve with rate = median count rate of data. |
 |
 |
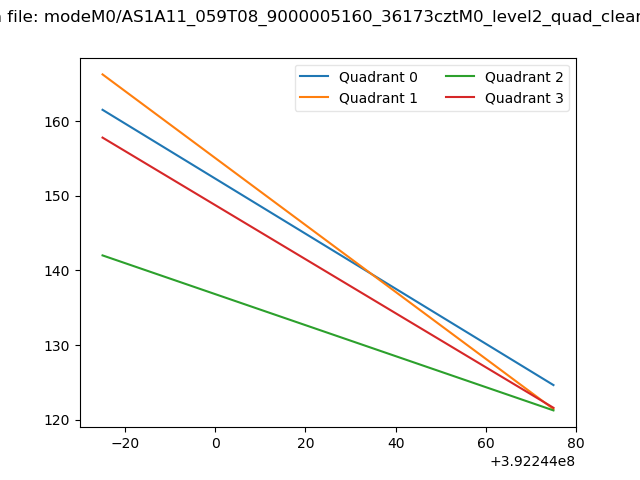
| Quadrant-wise count rates Data is divided into 100 sec bins |
 |
|
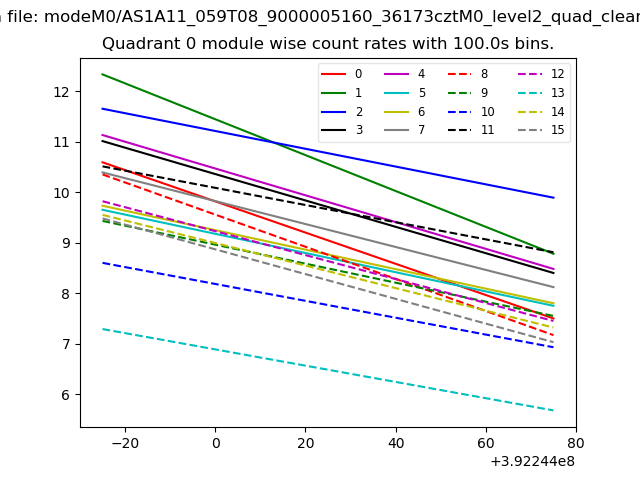
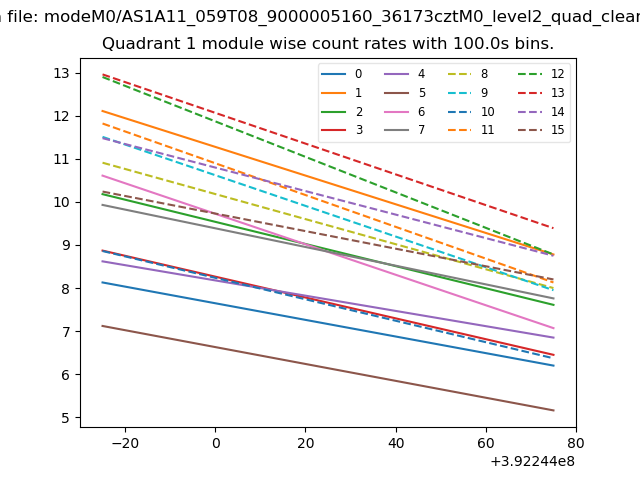
| Module-wise count rates for Quadrant A Data is divided into 100 sec bins |
 |
 |
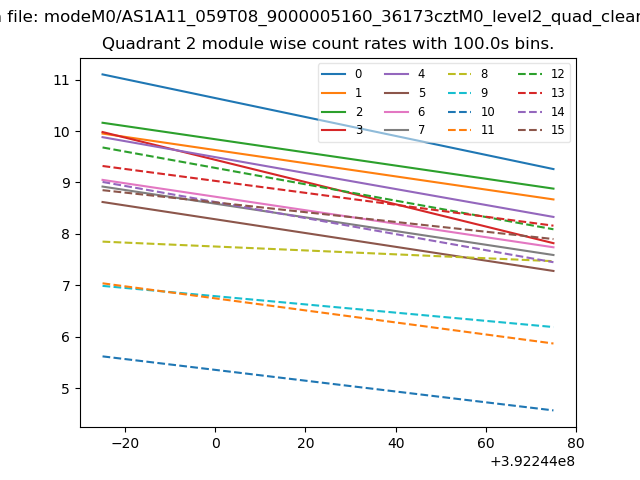
| Module-wise count rates for Quadrant B Data is divided into 100 sec bins |
 |
 |
| Module-wise count rates for Quadrant C Data is divided into 100 sec bins |
 |
 |
| Module-wise count rates for Quadrant D Data is divided into 100 sec bins |
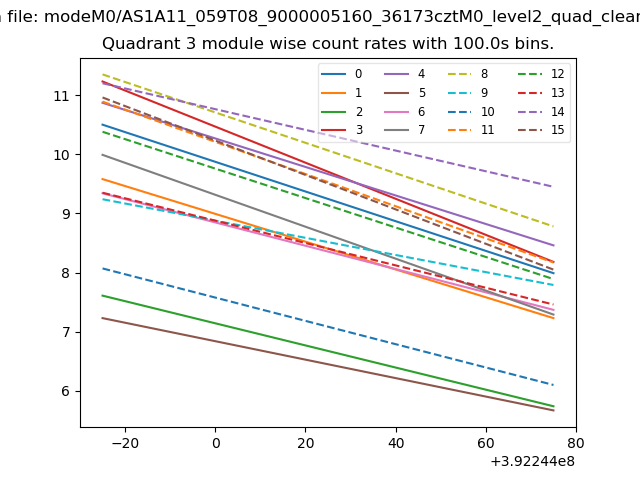 |
 |
| Parameter | Plot |
|---|---|
| CZT HV Monitor |  |
| D_VDD | 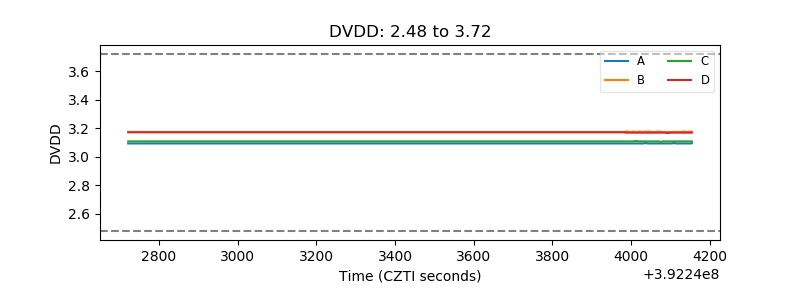 |
| Temperature 1 | 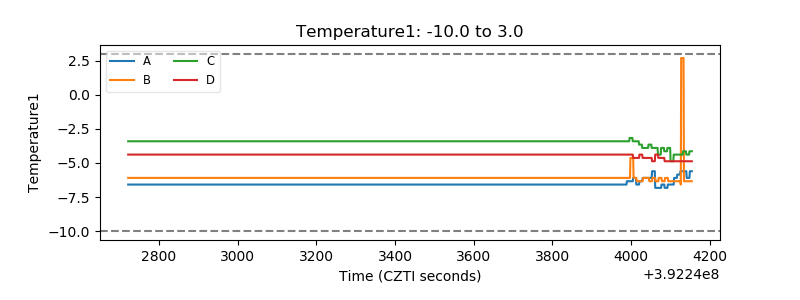 |
| Veto HV Monitor | 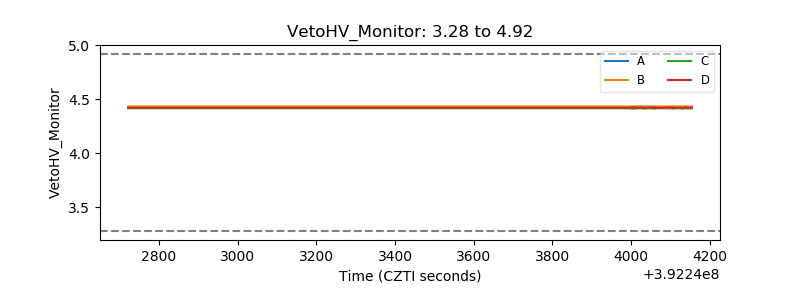 |
| Veto LLD | 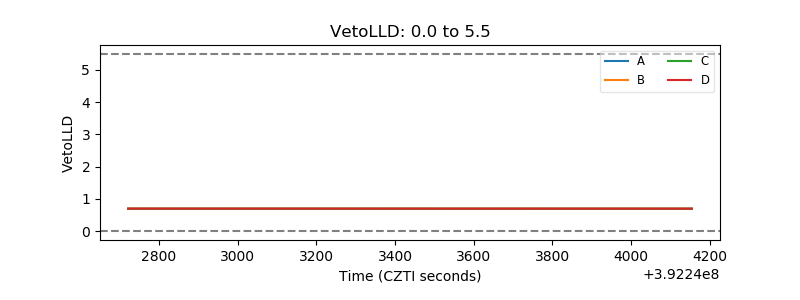 |
| Alpha Counter | 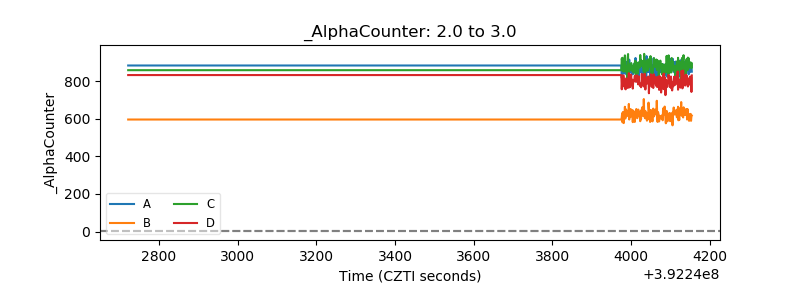 |
| _CPM_Rate | 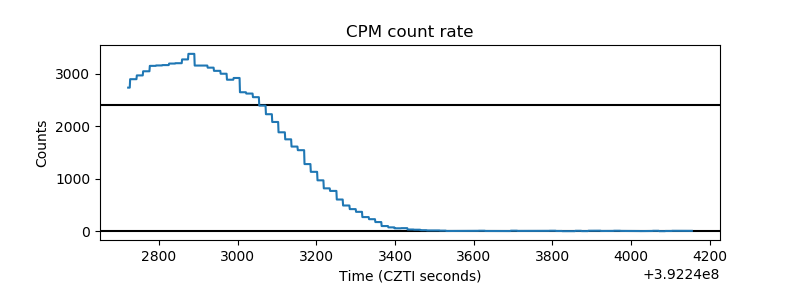 |
| CZT Counter | 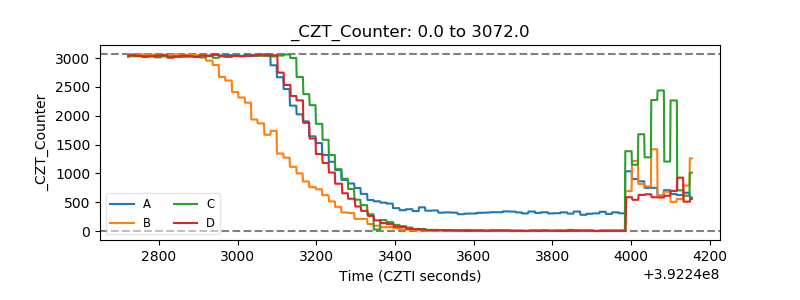 |
| +2.5 Volts monitor | 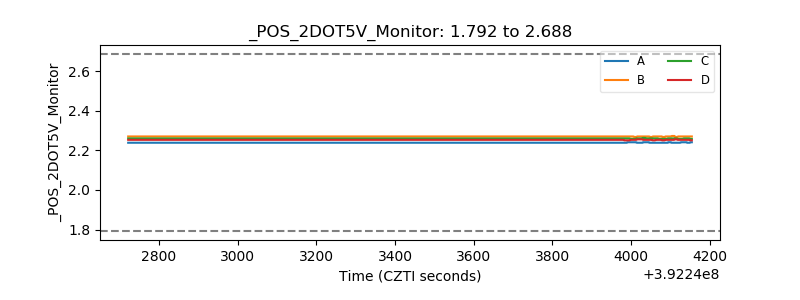 |
| +5 Volts monitor | 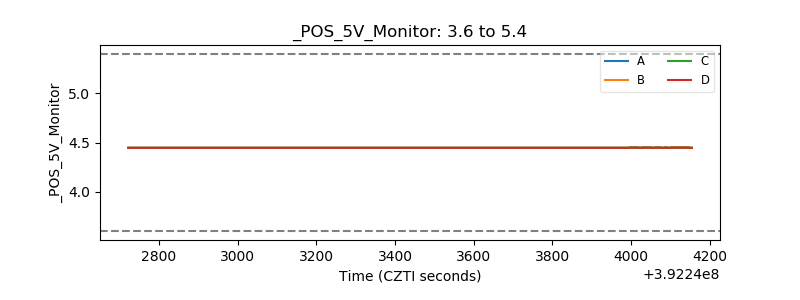 |
| _ROLL_ROT | 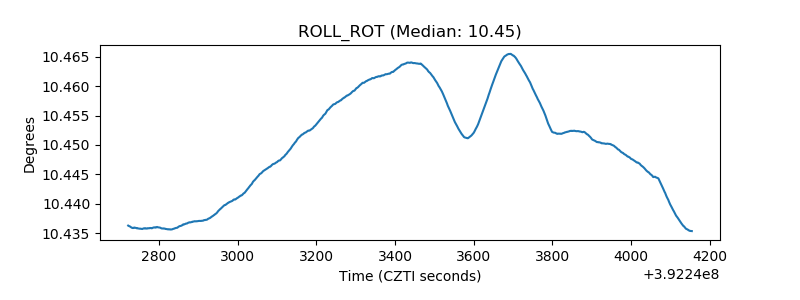 |
| _Roll_DEC | 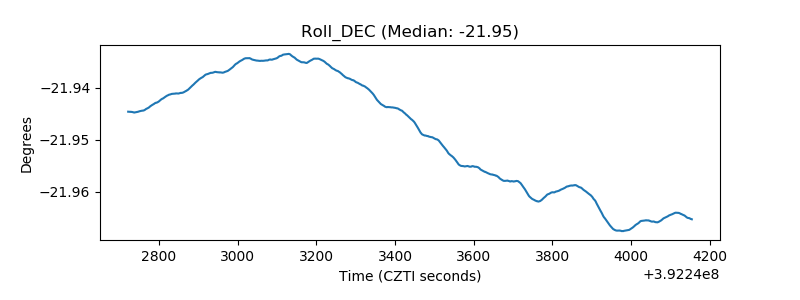 |
| _Roll_RA | 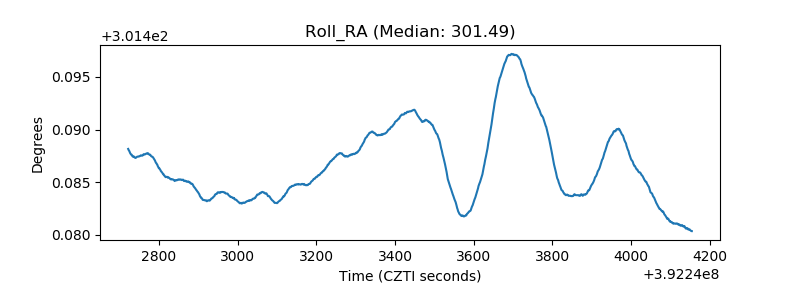 |
| Veto Counter | 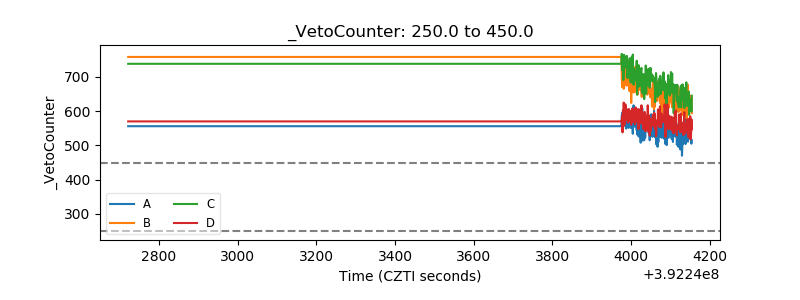 |