| Param | Original file | Final file |
|---|---|---|
| Filename | modeM0/AS1A11_059T08_9000005160_36171cztM0_level2.evt | modeM0/AS1A11_059T08_9000005160_36171cztM0_level2_quad_clean.evt |
| Size (bytes) | 468,066,240 | 90,008,640 |
| Size | 446.4 MB | 85.8 MB |
| Events in quadrant A | 2,690,294 | 595,878 |
| Events in quadrant B | 3,359,607 | 624,856 |
| Events in quadrant C | 3,980,215 | 575,944 |
| Events in quadrant D | 3,777,766 | 550,155 |
| Mode M9 | |||
|---|---|---|---|
| Quadrant | BADHDUFLAG | Total packets | Discarded packets |
| A | 0 | 30 | 0 |
| B | 0 | 30 | 0 |
| C | 0 | 30 | 0 |
| D | 0 | 31 | 0 |
| Mode M0 | |||
|---|---|---|---|
| Quadrant | BADHDUFLAG | Total packets | Discarded packets |
| A | 0 | 11478 | 3 |
| B | 0 | 13383 | 2 |
| C | 0 | 15146 | 2 |
| D | 0 | 14884 | 2 |
| Mode SS | |||
|---|---|---|---|
| Quadrant | BADHDUFLAG | Total packets | Discarded packets |
| A | 0 | 112 | 0 |
| B | 0 | 112 | 0 |
| C | 0 | 112 | 0 |
| D | 0 | 112 | 0 |
| Quadrant | Total seconds | Saturated seconds | Saturation percentage |
|---|---|---|---|
| A | 5407 | 11 | 0.203440% |
| B | 5407 | 144 | 2.663214% |
| C | 5407 | 317 | 5.862770% |
| D | 5407 | 352 | 6.510080% |
Noise dominated data is calculated using 1-second bins in cleaned event files. If a bin has >2000 counts, and if more than 50% of those come from <1% of pixels, then it is considered to be noise-dominated and hence unusable.
| Quadrant | # 1 sec bins | Bins with >0 counts | Bins with >2000 counts | High rate bins dominated by noise | Noise dominated (total time) | Noise dominated (detector-on time) | Marked lightcurve |
|---|---|---|---|---|---|---|---|
| A | 7170 | 5408 | 2 | 2 | 0.03% | 0.04% | 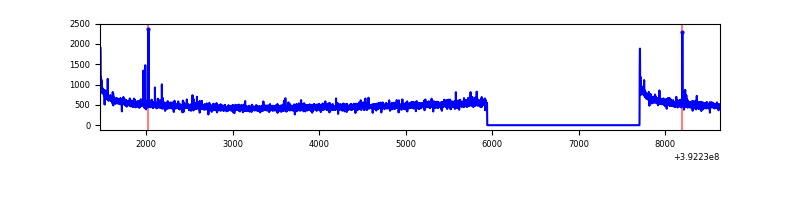 |
| B | 7170 | 5408 | 79 | 79 | 1.10% | 1.46% | 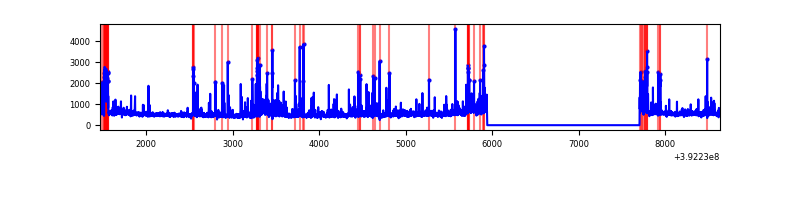 |
| C | 7170 | 5408 | 277 | 277 | 3.86% | 5.12% | 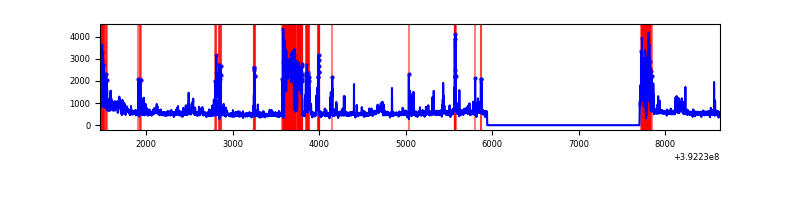 |
| D | 7170 | 5408 | 303 | 303 | 4.23% | 5.60% | 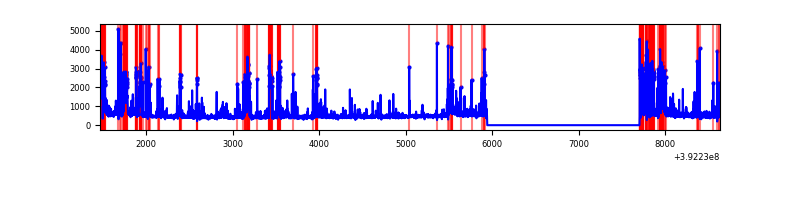 |
Top three noisy pixels from each quadrant. If the there are fewer than three noisy pixels in the level2.evt file, extra rows are filled as -1
| Pixel properties | Quadrant properties | ||||||
|---|---|---|---|---|---|---|---|
| Quadrant | DetID | PixID | Counts | Sigma | Mean | Median | Sigma |
| A | 10 | 83 | 175171 | 1369.5 | 638 | 627 | 127.5 |
| A | 8 | 144 | 23553 | 179.88 | 638 | 627 | 127.5 |
| A | 9 | 143 | 15830 | 119.28 | 638 | 627 | 127.5 |
| B | 4 | 171 | 347841 | 2826.11 | 640 | 622 | 122.9 |
| B | 5 | 172 | 344069 | 2795.41 | 640 | 622 | 122.9 |
| B | 0 | 190 | 67280 | 542.55 | 640 | 622 | 122.9 |
| C | 15 | 208 | 862844 | 5933.45 | 615 | 618 | 145.3 |
| C | 0 | 10 | 383212 | 2632.84 | 615 | 618 | 145.3 |
| C | 15 | 214 | 239302 | 1642.52 | 615 | 618 | 145.3 |
| D | 13 | 249 | 663292 | 4509.6 | 606 | 591 | 147.0 |
| D | 12 | 6 | 304007 | 2064.71 | 606 | 591 | 147.0 |
| D | 7 | 38 | 131041 | 887.7 | 606 | 591 | 147.0 |
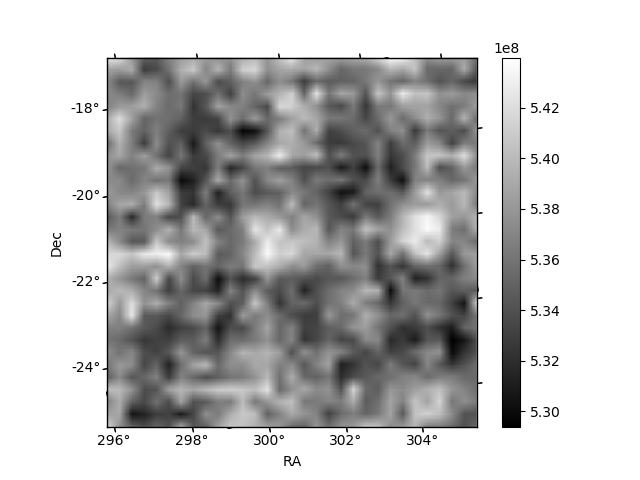
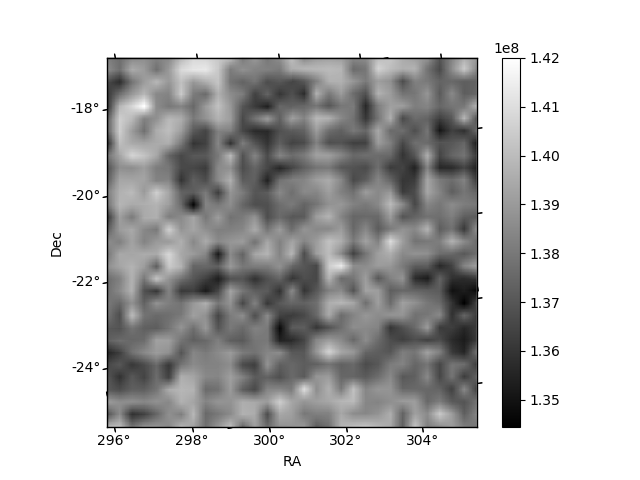
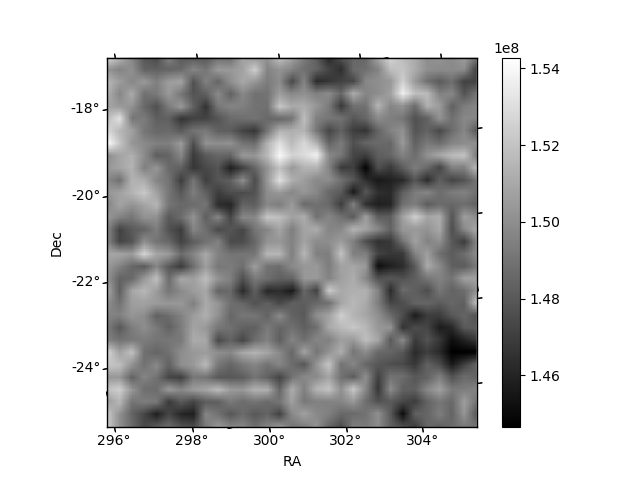
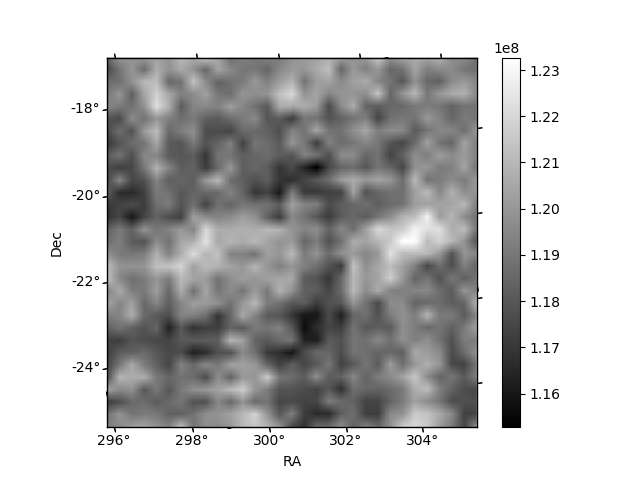
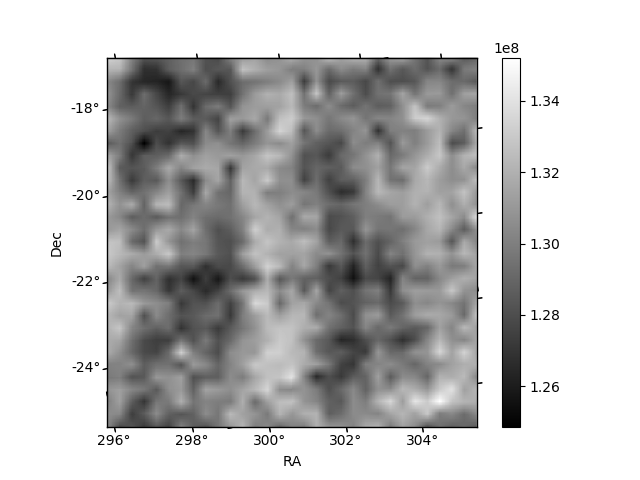
Histogram calculated using DETX and DETY for each event in the final _common_clean file
| Quadrant A | 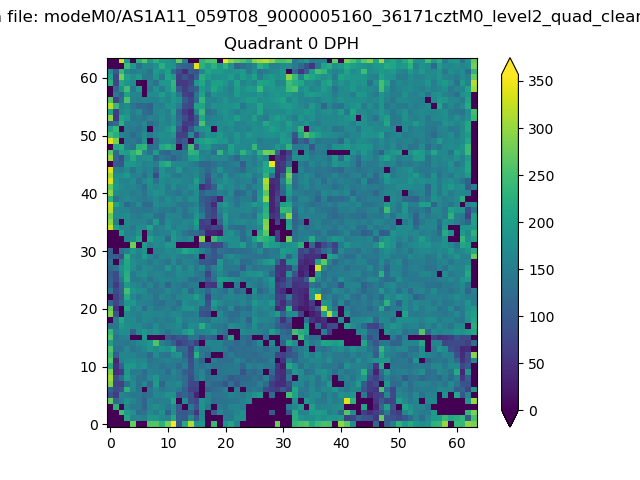 |
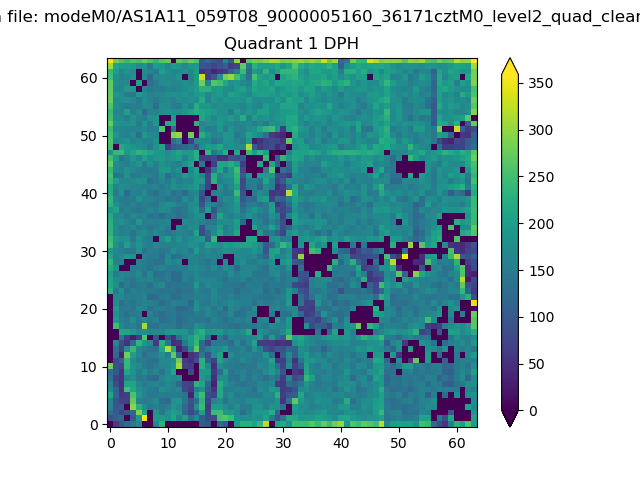 |
Quadrant B |
|---|---|---|---|
| Quadrant D | 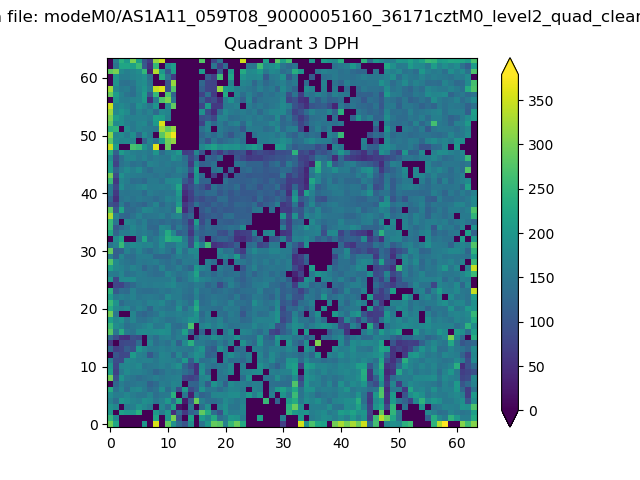 |
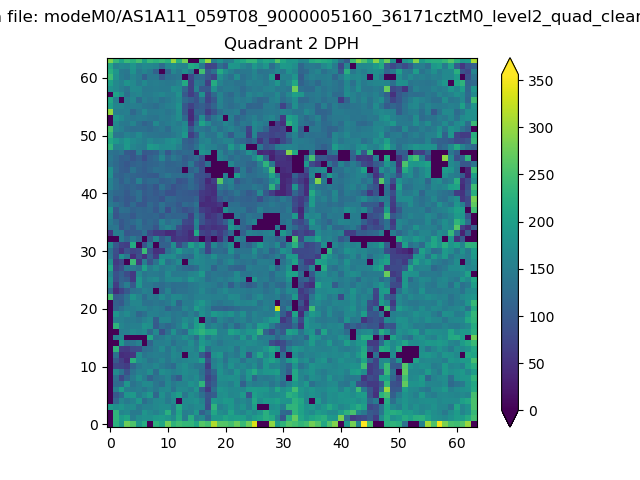 |
Quadrant C |
| Plot type | Count rate plots | Images |
|---|---|---|
| Comparison with Poisson distribution Blue bars denote a histogram of data divided into 1 sec bins. Red curve is a Poisson curve with rate = median count rate of data. |
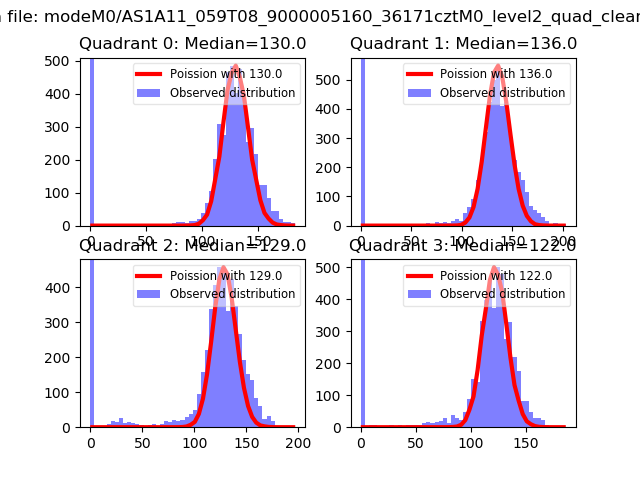 |
 |
| Quadrant-wise count rates Data is divided into 100 sec bins |
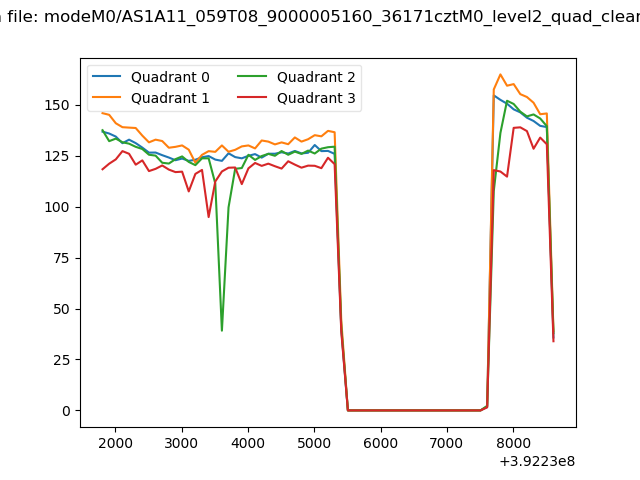 |
|
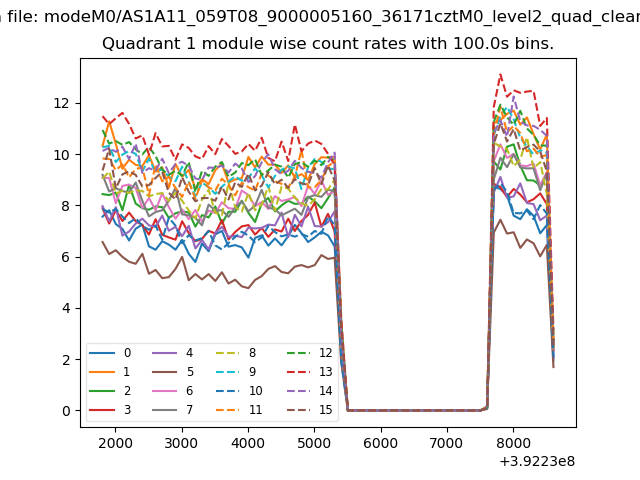
| Module-wise count rates for Quadrant A Data is divided into 100 sec bins |
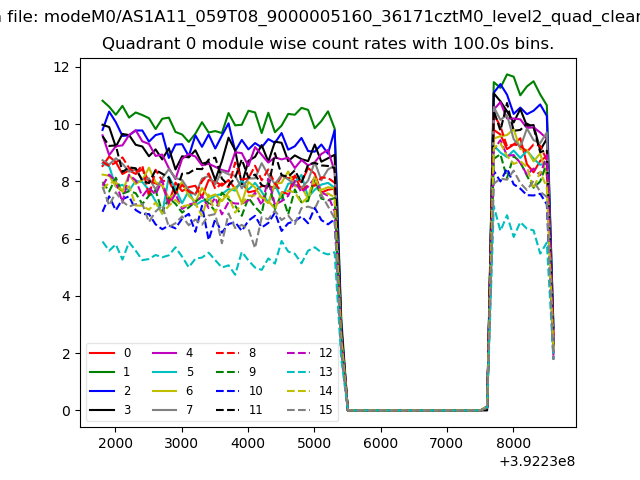 |
 |
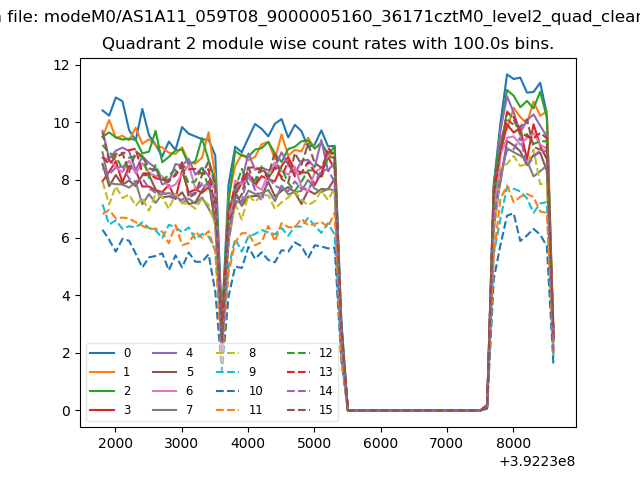
| Module-wise count rates for Quadrant B Data is divided into 100 sec bins |
 |
 |
| Module-wise count rates for Quadrant C Data is divided into 100 sec bins |
 |
 |
| Module-wise count rates for Quadrant D Data is divided into 100 sec bins |
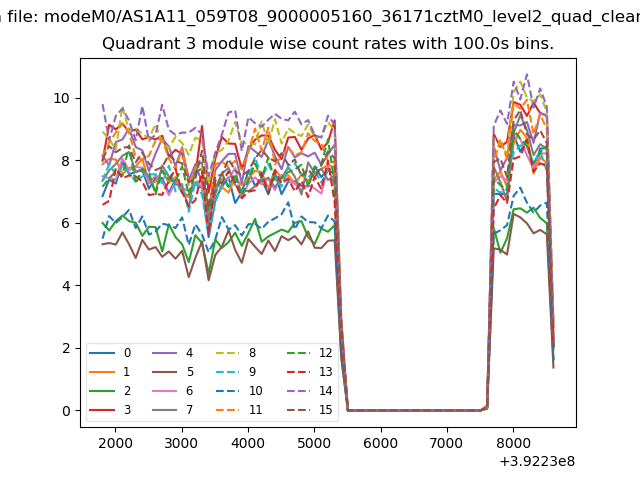 |
 |
| Parameter | Plot |
|---|---|
| CZT HV Monitor | 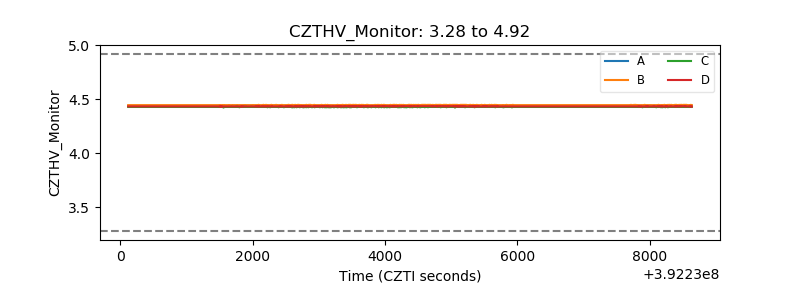 |
| D_VDD | 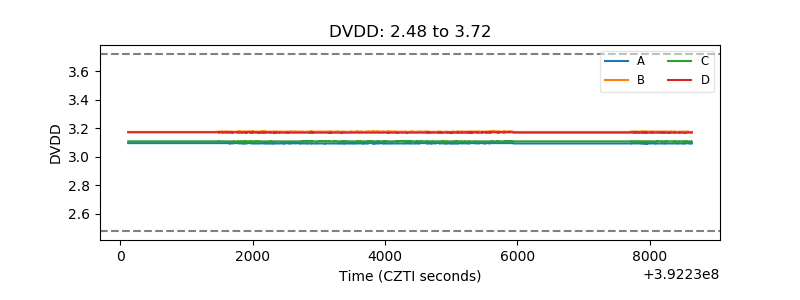 |
| Temperature 1 | 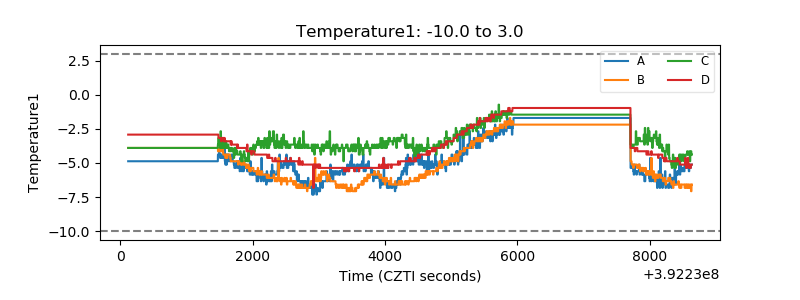 |
| Veto HV Monitor | 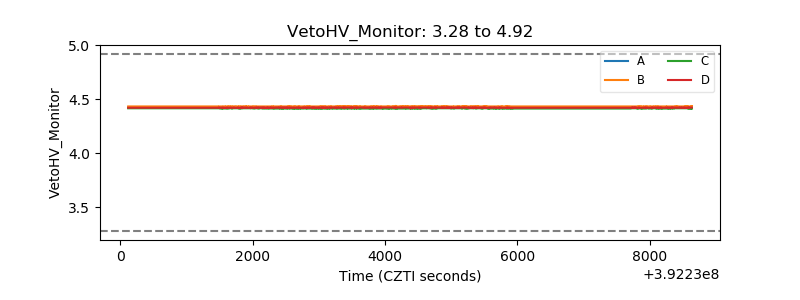 |
| Veto LLD | 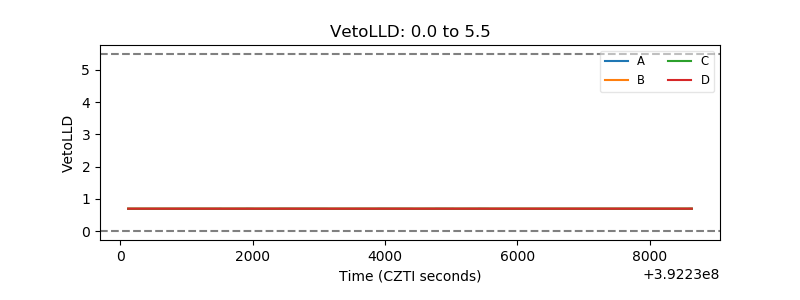 |
| Alpha Counter | 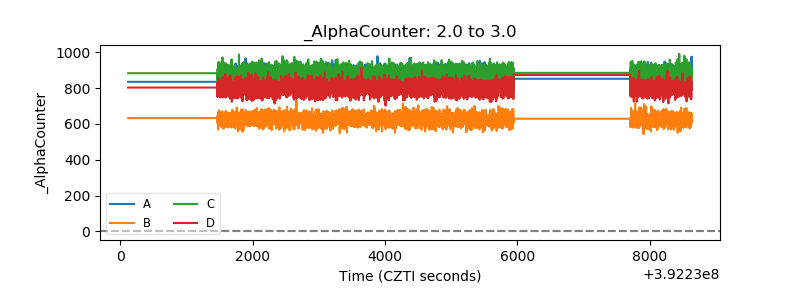 |
| _CPM_Rate | 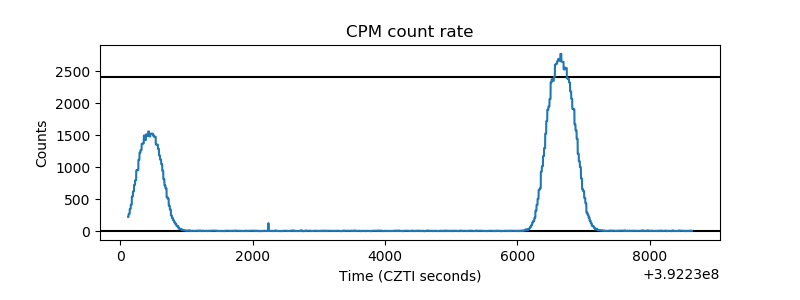 |
| CZT Counter | 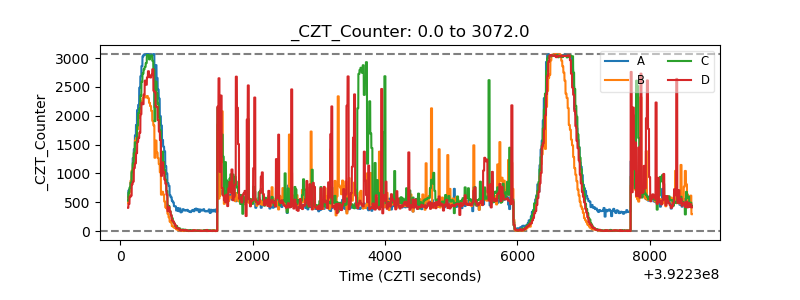 |
| +2.5 Volts monitor | 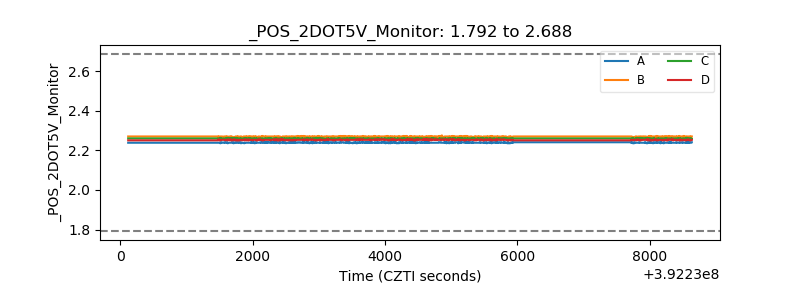 |
| +5 Volts monitor | 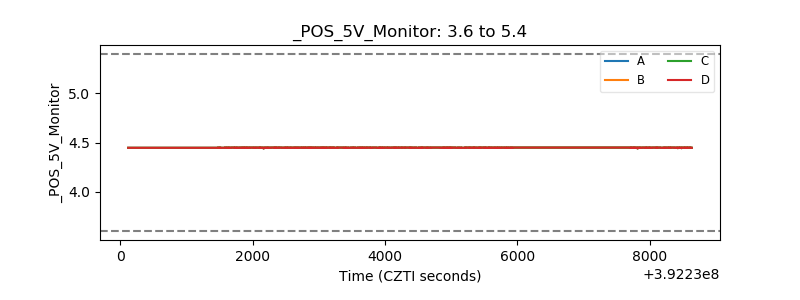 |
| _ROLL_ROT | 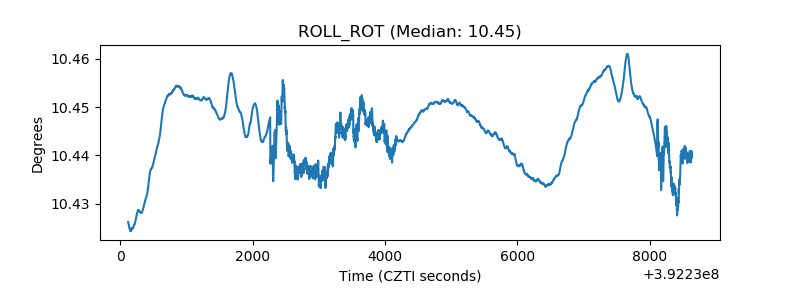 |
| _Roll_DEC | 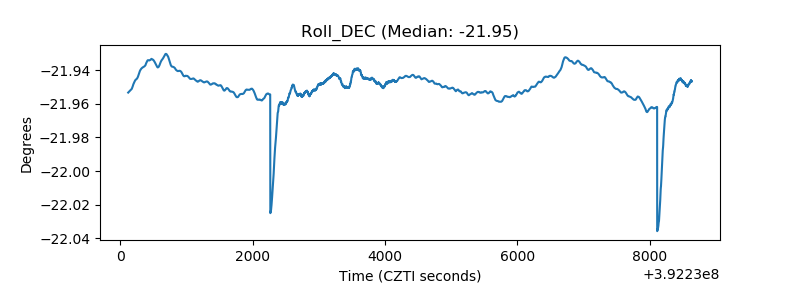 |
| _Roll_RA | 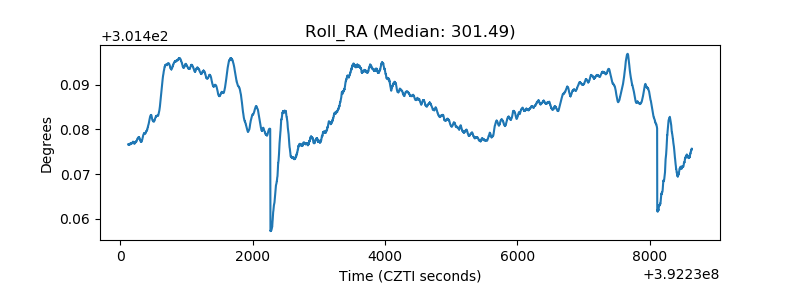 |
| Veto Counter | 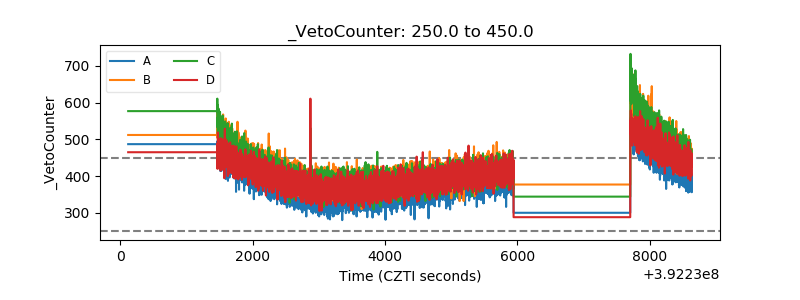 |