| Param | Original file | Final file |
|---|---|---|
| Filename | modeM0/AS1A11_059T08_9000005160_36169cztM0_level2.evt | modeM0/AS1A11_059T08_9000005160_36169cztM0_level2_quad_clean.evt |
| Size (bytes) | 473,184,000 | 83,531,520 |
| Size | 451.3 MB | 79.7 MB |
| Events in quadrant A | 3,231,839 | 529,058 |
| Events in quadrant B | 3,307,247 | 563,871 |
| Events in quadrant C | 3,325,267 | 536,116 |
| Events in quadrant D | 4,080,982 | 503,631 |
| Mode M9 | |||
|---|---|---|---|
| Quadrant | BADHDUFLAG | Total packets | Discarded packets |
| A | 0 | 31 | 0 |
| B | 0 | 31 | 0 |
| C | 0 | 31 | 0 |
| D | 0 | 31 | 0 |
| Mode M0 | |||
|---|---|---|---|
| Quadrant | BADHDUFLAG | Total packets | Discarded packets |
| A | 0 | 13351 | 3 |
| B | 0 | 13394 | 2 |
| C | 0 | 13278 | 2 |
| D | 0 | 15937 | 2 |
| Mode SS | |||
|---|---|---|---|
| Quadrant | BADHDUFLAG | Total packets | Discarded packets |
| A | 0 | 118 | 0 |
| B | 0 | 118 | 0 |
| C | 0 | 118 | 0 |
| D | 0 | 118 | 0 |
| Quadrant | Total seconds | Saturated seconds | Saturation percentage |
|---|---|---|---|
| A | 5671 | 200 | 3.526715% |
| B | 5671 | 159 | 2.803738% |
| C | 5671 | 95 | 1.675190% |
| D | 5671 | 273 | 4.813966% |
Noise dominated data is calculated using 1-second bins in cleaned event files. If a bin has >2000 counts, and if more than 50% of those come from <1% of pixels, then it is considered to be noise-dominated and hence unusable.
| Quadrant | # 1 sec bins | Bins with >0 counts | Bins with >2000 counts | High rate bins dominated by noise | Noise dominated (total time) | Noise dominated (detector-on time) | Marked lightcurve |
|---|---|---|---|---|---|---|---|
| A | 8838 | 5673 | 159 | 159 | 1.80% | 2.80% | 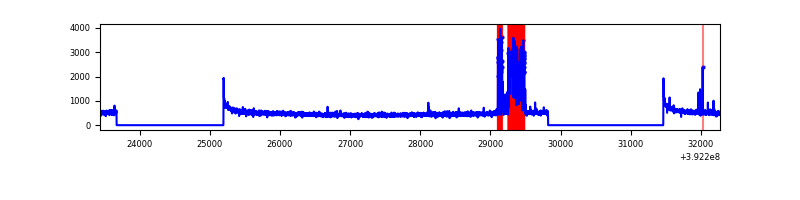 |
| B | 8838 | 5673 | 88 | 88 | 1.00% | 1.55% | 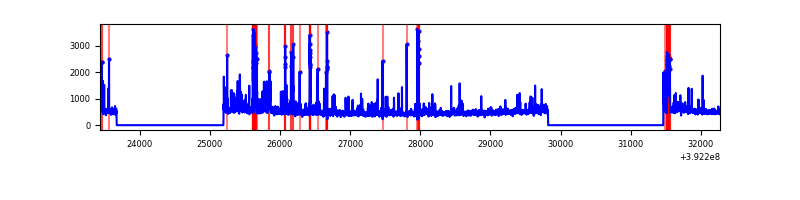 |
| C | 8838 | 5673 | 66 | 66 | 0.75% | 1.16% | 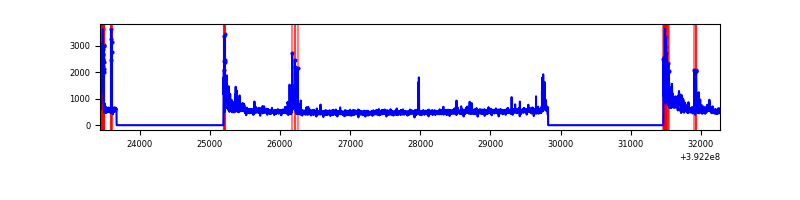 |
| D | 8838 | 5673 | 233 | 233 | 2.64% | 4.11% | 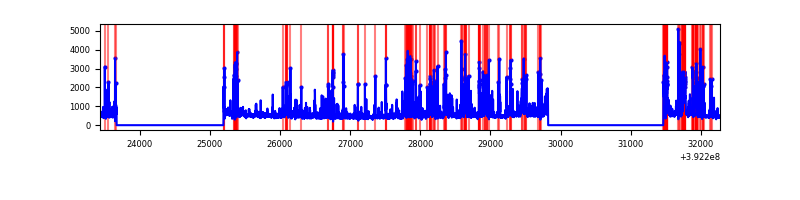 |
Top three noisy pixels from each quadrant. If the there are fewer than three noisy pixels in the level2.evt file, extra rows are filled as -1
| Pixel properties | Quadrant properties | ||||||
|---|---|---|---|---|---|---|---|
| Quadrant | DetID | PixID | Counts | Sigma | Mean | Median | Sigma |
| A | 9 | 143 | 524989 | 3991.79 | 649 | 636 | 131.4 |
| A | 10 | 83 | 177961 | 1349.94 | 649 | 636 | 131.4 |
| A | 13 | 254 | 9562 | 67.95 | 649 | 636 | 131.4 |
| B | 5 | 172 | 440372 | 3449.34 | 657 | 639 | 127.5 |
| B | 15 | 32 | 85136 | 662.81 | 657 | 639 | 127.5 |
| B | 0 | 190 | 64138 | 498.1 | 657 | 639 | 127.5 |
| C | 15 | 208 | 296215 | 1956.54 | 644 | 649 | 151.1 |
| C | 15 | 214 | 255466 | 1686.8 | 644 | 649 | 151.1 |
| C | 0 | 10 | 230661 | 1522.6 | 644 | 649 | 151.1 |
| D | 2 | 250 | 553727 | 3549.03 | 632 | 614 | 155.8 |
| D | 13 | 249 | 328459 | 2103.61 | 632 | 614 | 155.8 |
| D | 13 | 171 | 191219 | 1223.01 | 632 | 614 | 155.8 |
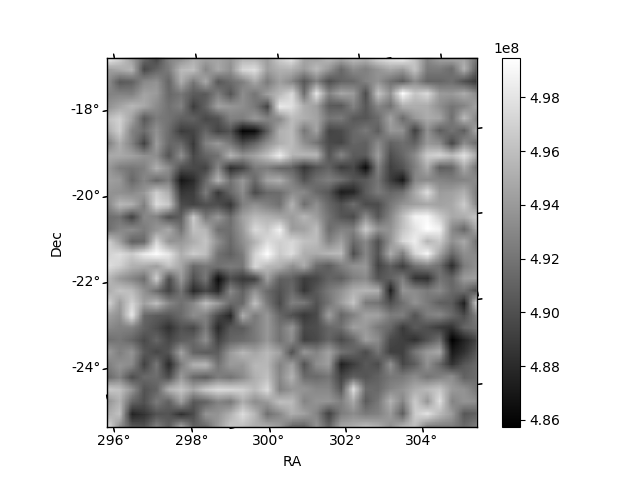
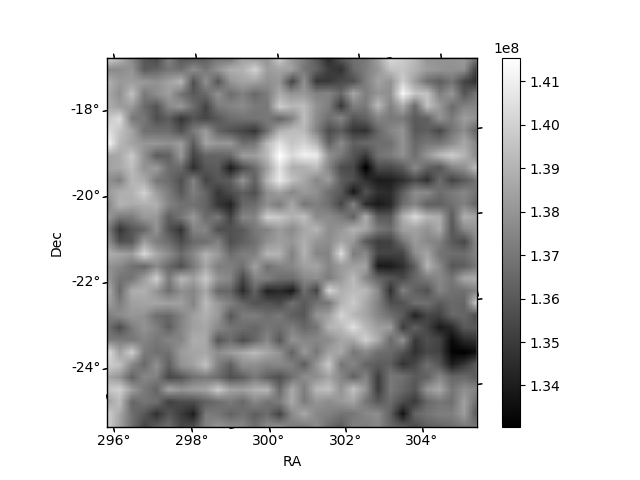
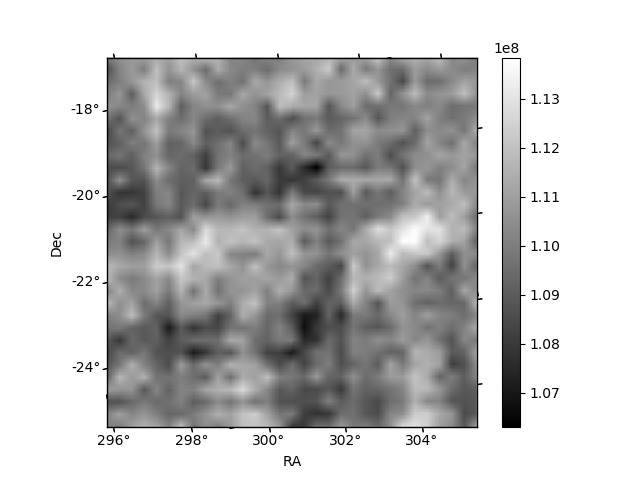
Histogram calculated using DETX and DETY for each event in the final _common_clean file
| Quadrant A | 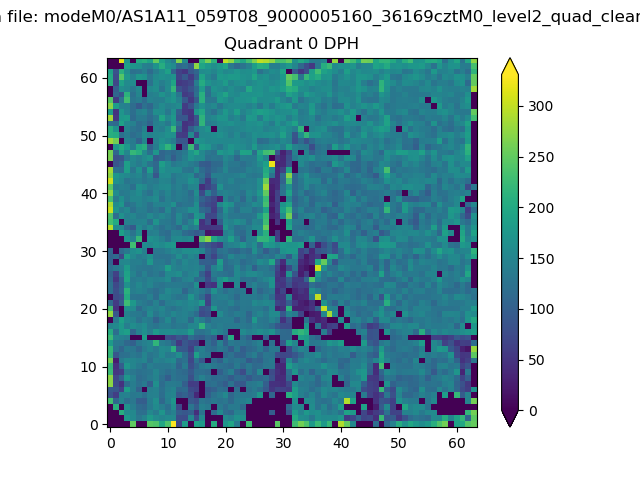 |
 |
Quadrant B |
|---|---|---|---|
| Quadrant D | 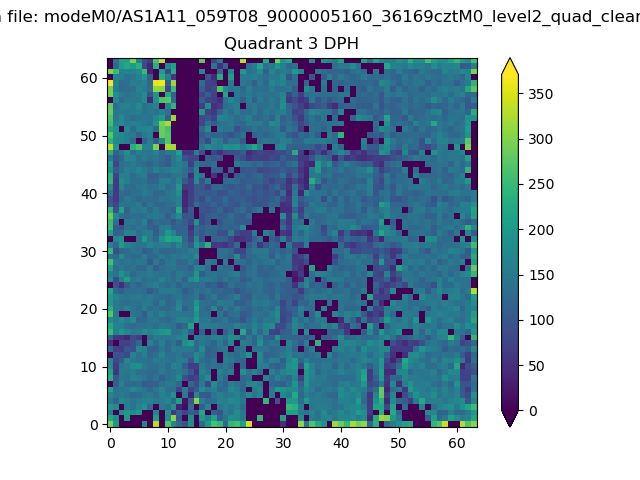 |
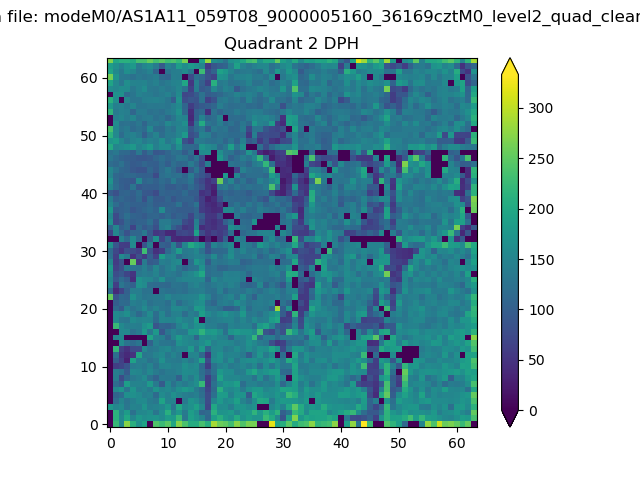 |
Quadrant C |
| Plot type | Count rate plots | Images |
|---|---|---|
| Comparison with Poisson distribution Blue bars denote a histogram of data divided into 1 sec bins. Red curve is a Poisson curve with rate = median count rate of data. |
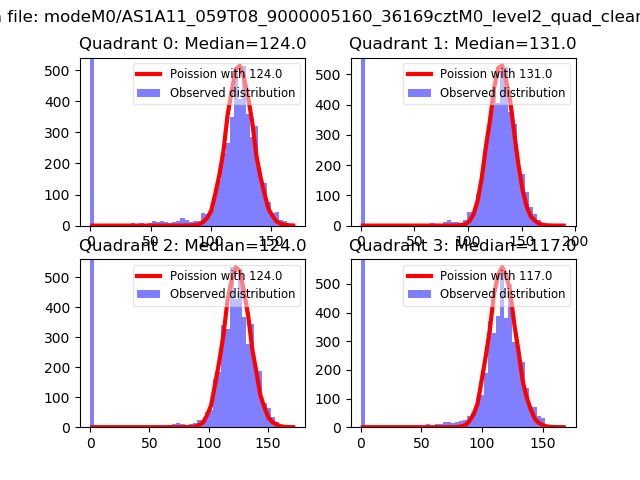 |
 |
| Quadrant-wise count rates Data is divided into 100 sec bins |
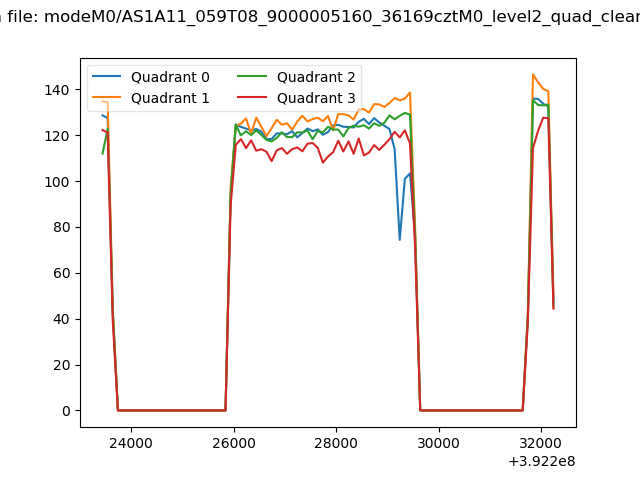 |
|
| Module-wise count rates for Quadrant A Data is divided into 100 sec bins |
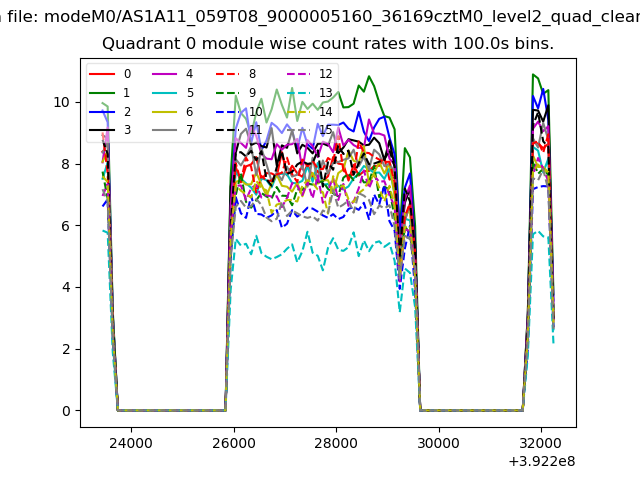 |
 |
| Module-wise count rates for Quadrant B Data is divided into 100 sec bins |
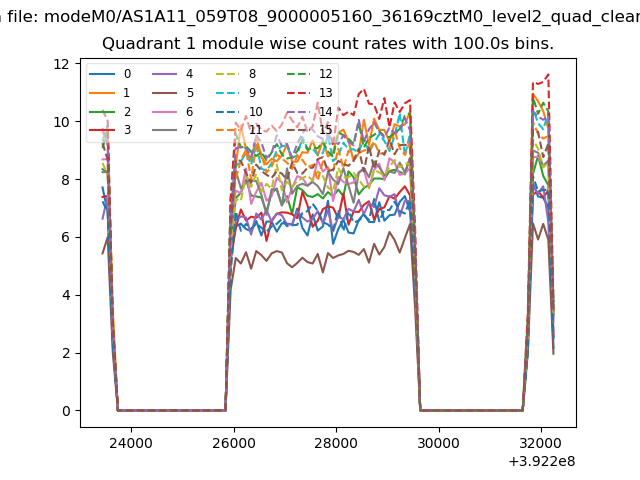 |
 |
| Module-wise count rates for Quadrant C Data is divided into 100 sec bins |
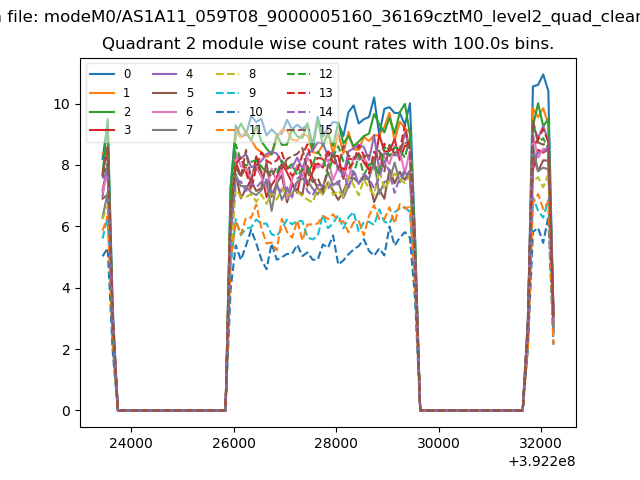 |
 |
| Module-wise count rates for Quadrant D Data is divided into 100 sec bins |
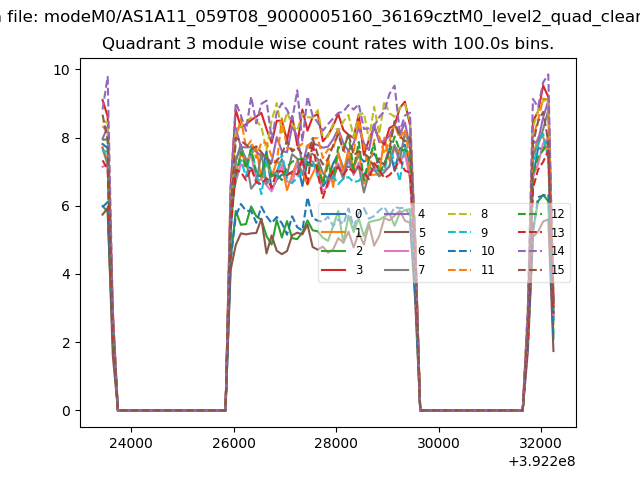 |
 |
| Parameter | Plot |
|---|---|
| CZT HV Monitor |  |
| D_VDD | 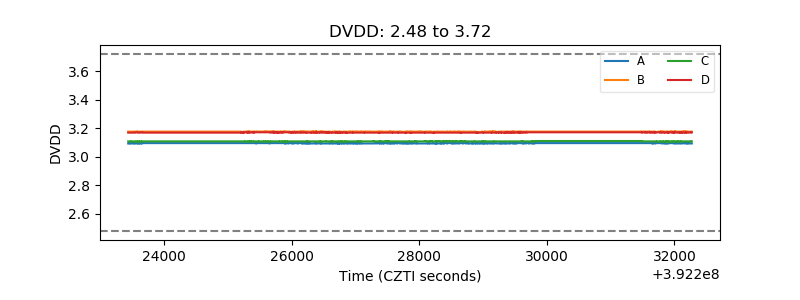 |
| Temperature 1 | 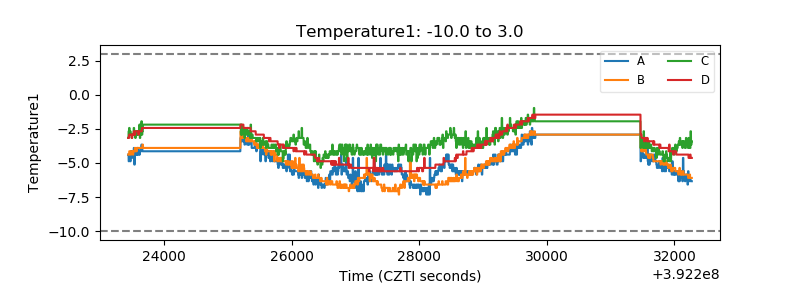 |
| Veto HV Monitor | 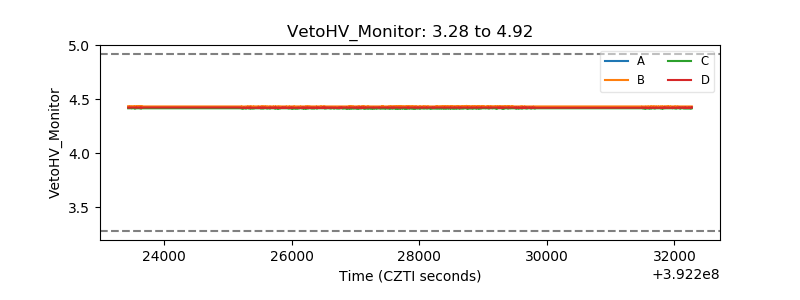 |
| Veto LLD | 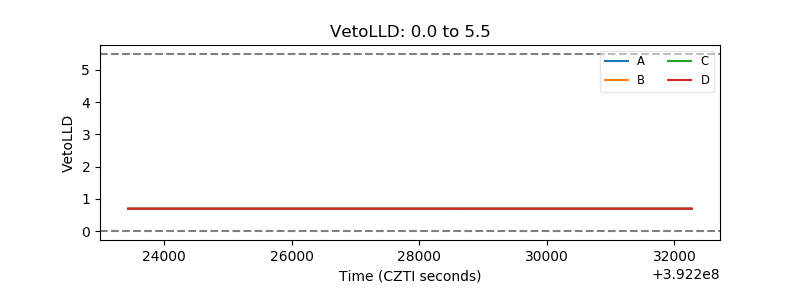 |
| Alpha Counter | 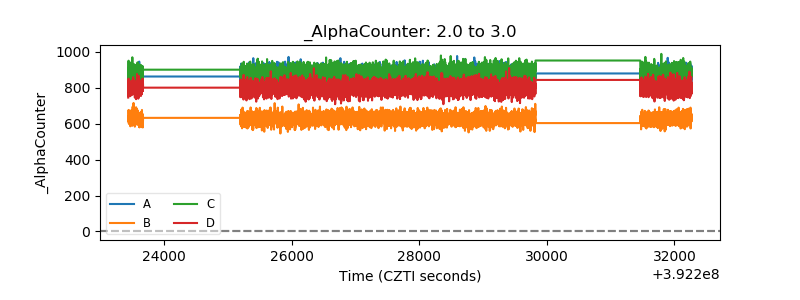 |
| _CPM_Rate | 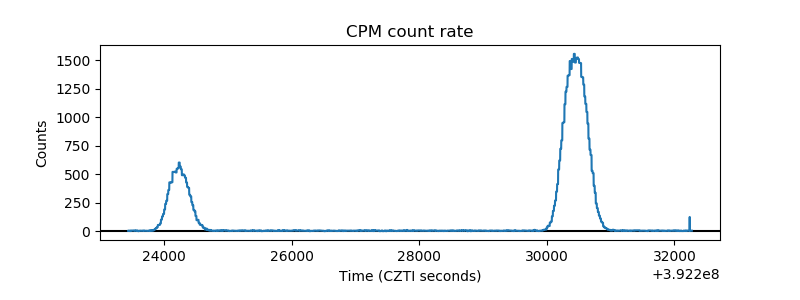 |
| CZT Counter | 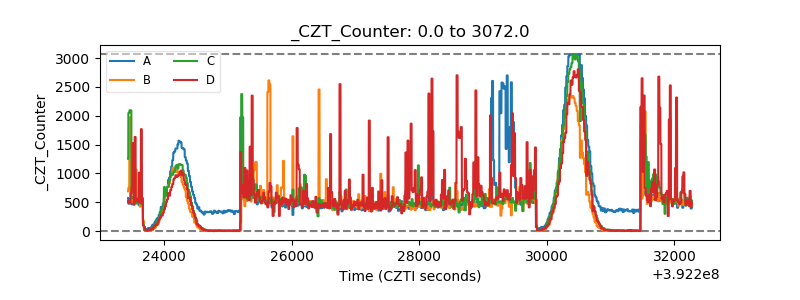 |
| +2.5 Volts monitor | 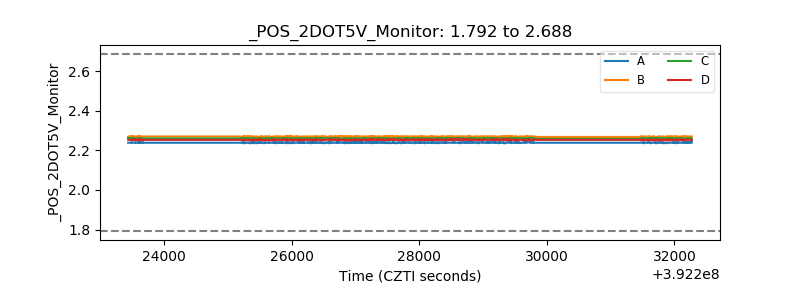 |
| +5 Volts monitor | 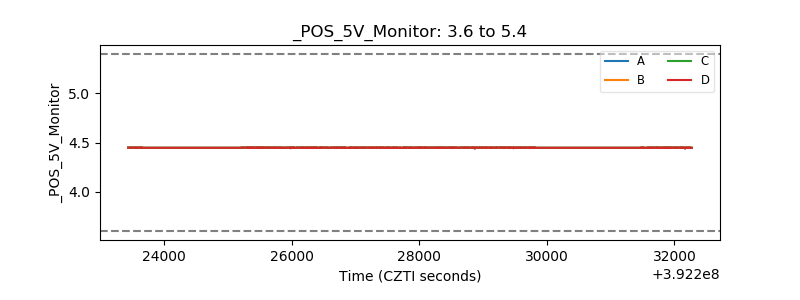 |
| _ROLL_ROT | 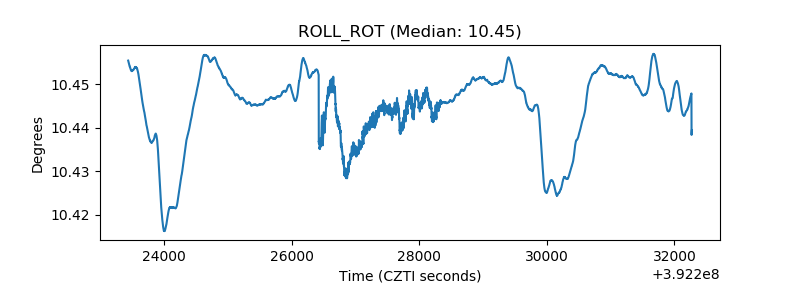 |
| _Roll_DEC | 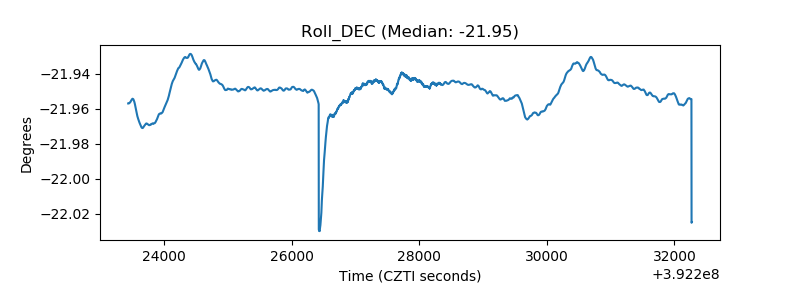 |
| _Roll_RA | 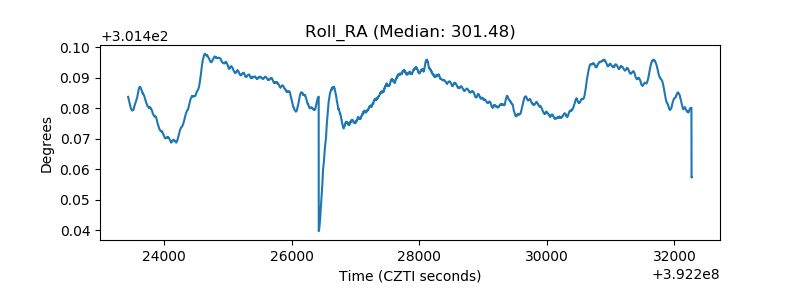 |
| Veto Counter | 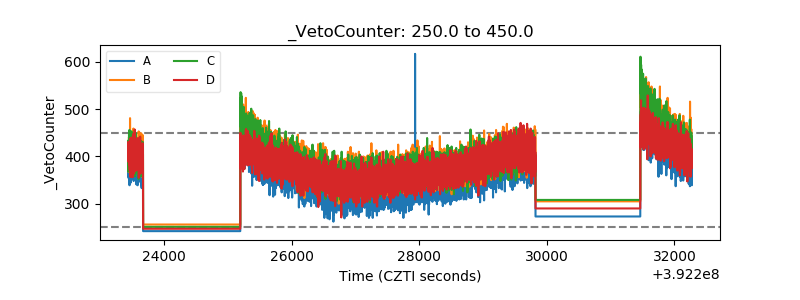 |