| Param | Original file | Final file |
|---|---|---|
| Filename | modeM0/AS1A11_059T08_9000005160_36165cztM0_level2.evt | modeM0/AS1A11_059T08_9000005160_36165cztM0_level2_quad_clean.evt |
| Size (bytes) | 468,146,880 | 59,218,560 |
| Size | 446.5 MB | 56.5 MB |
| Events in quadrant A | 2,861,410 | 346,097 |
| Events in quadrant B | 3,439,208 | 360,912 |
| Events in quadrant C | 3,275,298 | 343,924 |
| Events in quadrant D | 4,196,378 | 324,450 |
| Mode M9 | |||
|---|---|---|---|
| Quadrant | BADHDUFLAG | Total packets | Discarded packets |
| A | 0 | 14 | 0 |
| B | 0 | 14 | 0 |
| C | 0 | 14 | 0 |
| D | 0 | 15 | 0 |
| Mode M0 | |||
|---|---|---|---|
| Quadrant | BADHDUFLAG | Total packets | Discarded packets |
| A | 0 | 12250 | 3 |
| B | 0 | 13940 | 2 |
| C | 0 | 13214 | 2 |
| D | 0 | 16493 | 2 |
| Mode SS | |||
|---|---|---|---|
| Quadrant | BADHDUFLAG | Total packets | Discarded packets |
| A | 0 | 122 | 0 |
| B | 0 | 122 | 0 |
| C | 0 | 122 | 0 |
| D | 0 | 122 | 0 |
| Quadrant | Total seconds | Saturated seconds | Saturation percentage |
|---|---|---|---|
| A | 5974 | 10 | 0.167392% |
| B | 5974 | 112 | 1.874791% |
| C | 5974 | 32 | 0.535655% |
| D | 5974 | 234 | 3.916974% |
Noise dominated data is calculated using 1-second bins in cleaned event files. If a bin has >2000 counts, and if more than 50% of those come from <1% of pixels, then it is considered to be noise-dominated and hence unusable.
| Quadrant | # 1 sec bins | Bins with >0 counts | Bins with >2000 counts | High rate bins dominated by noise | Noise dominated (total time) | Noise dominated (detector-on time) | Marked lightcurve |
|---|---|---|---|---|---|---|---|
| A | 7287 | 5975 | 0 | 0 | 0.00% | 0.00% | 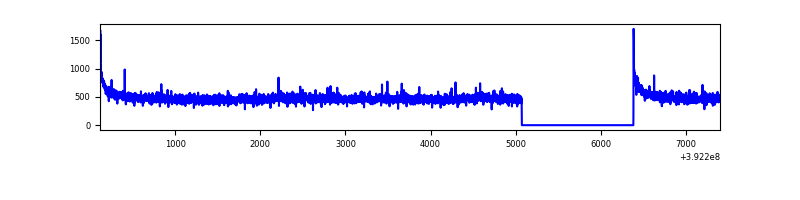 |
| B | 7287 | 5975 | 61 | 61 | 0.84% | 1.02% | 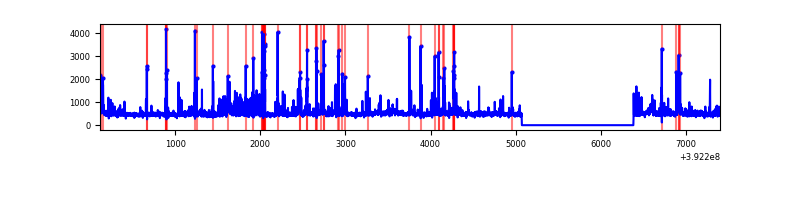 |
| C | 7287 | 5975 | 22 | 22 | 0.30% | 0.37% | 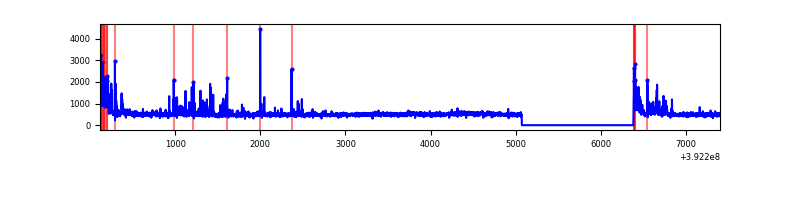 |
| D | 7287 | 5975 | 202 | 202 | 2.77% | 3.38% | 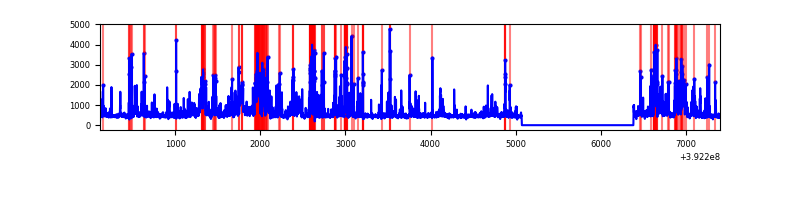 |
Top three noisy pixels from each quadrant. If the there are fewer than three noisy pixels in the level2.evt file, extra rows are filled as -1
| Pixel properties | Quadrant properties | ||||||
|---|---|---|---|---|---|---|---|
| Quadrant | DetID | PixID | Counts | Sigma | Mean | Median | Sigma |
| A | 10 | 83 | 185221 | 1313.89 | 686 | 670 | 140.5 |
| A | 8 | 144 | 13121 | 88.64 | 686 | 670 | 140.5 |
| A | 13 | 254 | 11191 | 74.9 | 686 | 670 | 140.5 |
| B | 5 | 172 | 319453 | 2429.19 | 679 | 661 | 131.2 |
| B | 15 | 32 | 166582 | 1264.31 | 679 | 661 | 131.2 |
| B | 0 | 190 | 89564 | 677.44 | 679 | 661 | 131.2 |
| C | 15 | 214 | 271329 | 1727.06 | 669 | 673 | 156.7 |
| C | 0 | 10 | 197760 | 1257.62 | 669 | 673 | 156.7 |
| C | 0 | 207 | 120364 | 763.75 | 669 | 673 | 156.7 |
| D | 12 | 17 | 527835 | 3216.21 | 664 | 645 | 163.9 |
| D | 2 | 249 | 347983 | 2118.99 | 664 | 645 | 163.9 |
| D | 2 | 153 | 202416 | 1230.94 | 664 | 645 | 163.9 |
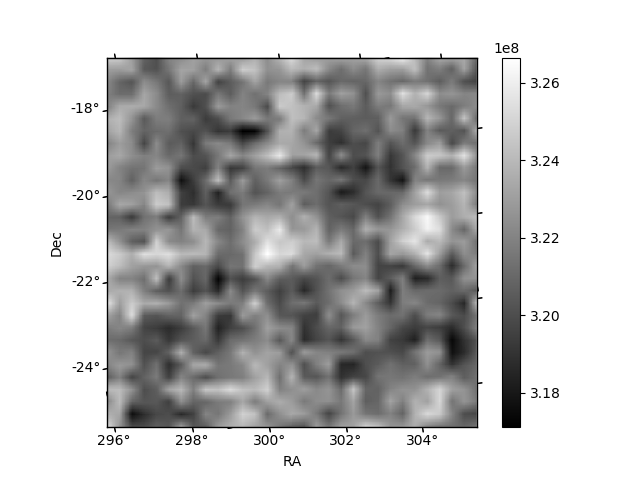
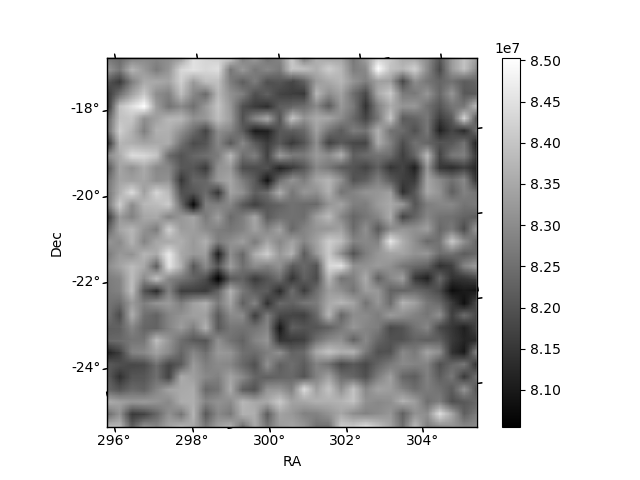
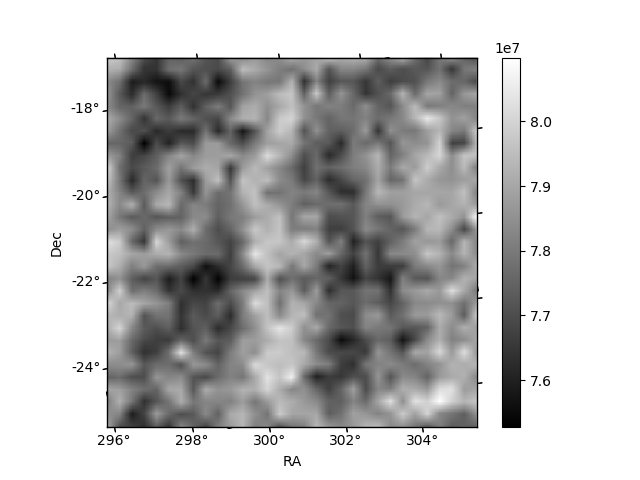
Histogram calculated using DETX and DETY for each event in the final _common_clean file
| Quadrant A | 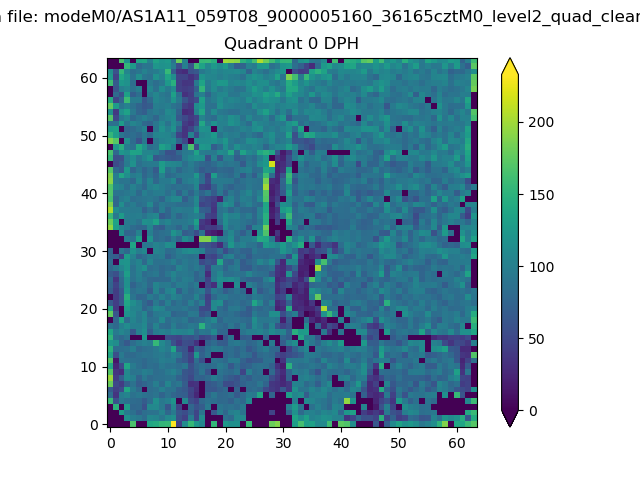 |
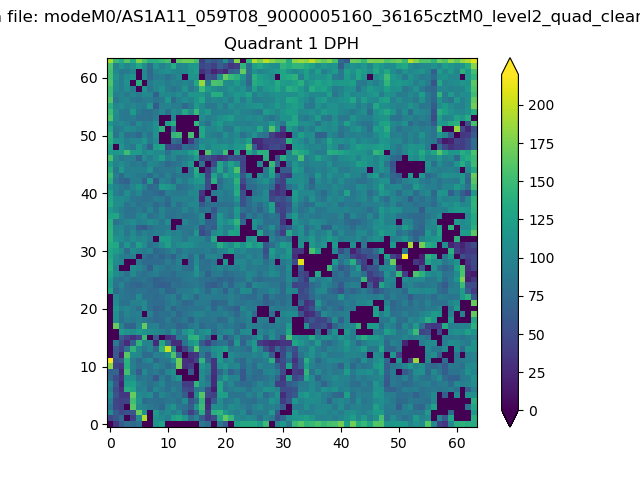 |
Quadrant B |
|---|---|---|---|
| Quadrant D | 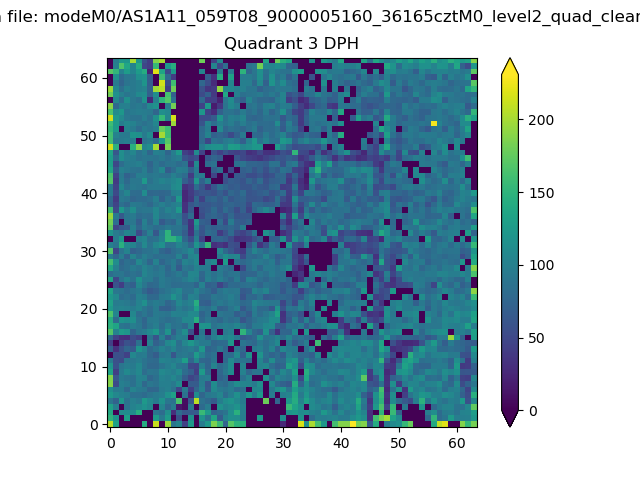 |
 |
Quadrant C |
| Plot type | Count rate plots | Images |
|---|---|---|
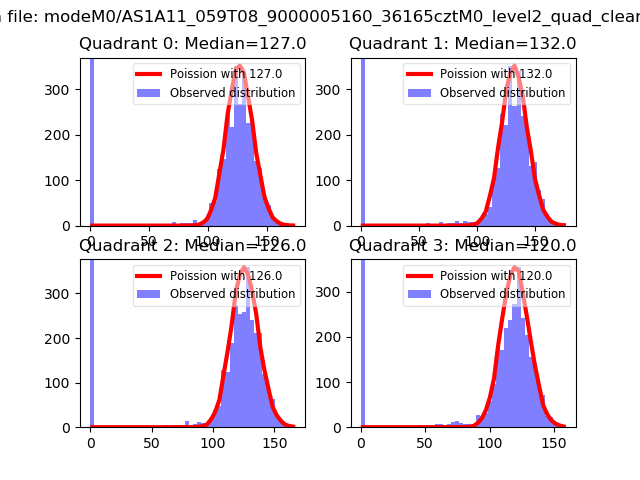
| Comparison with Poisson distribution Blue bars denote a histogram of data divided into 1 sec bins. Red curve is a Poisson curve with rate = median count rate of data. |
 |
 |
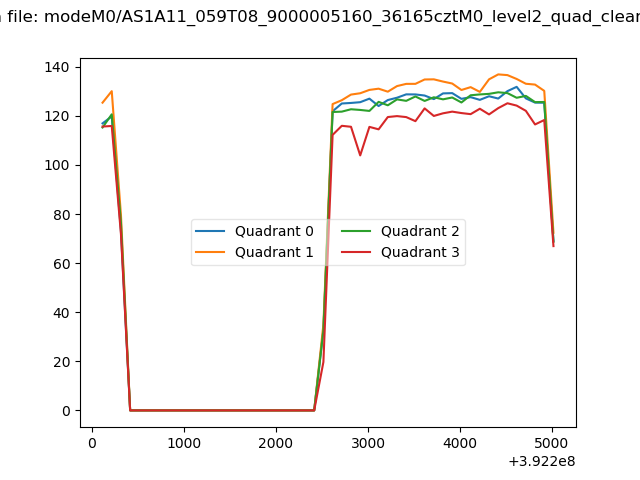
| Quadrant-wise count rates Data is divided into 100 sec bins |
 |
|
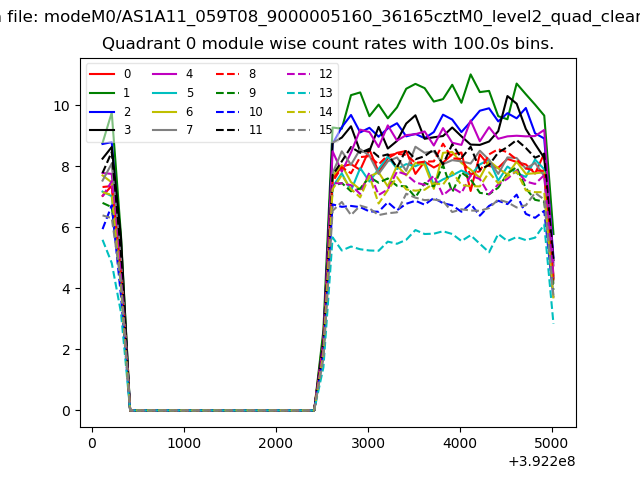
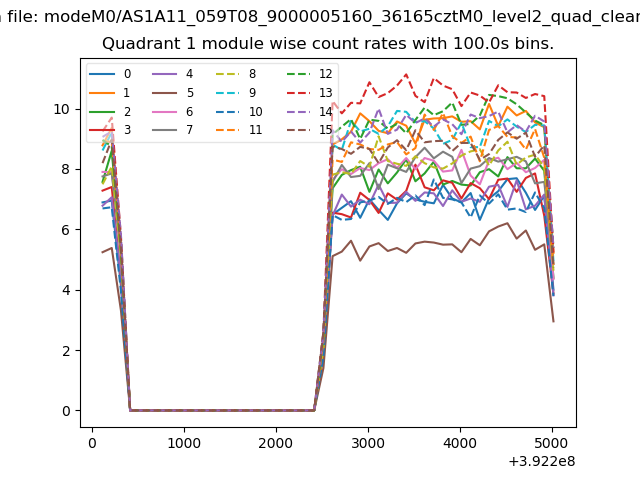
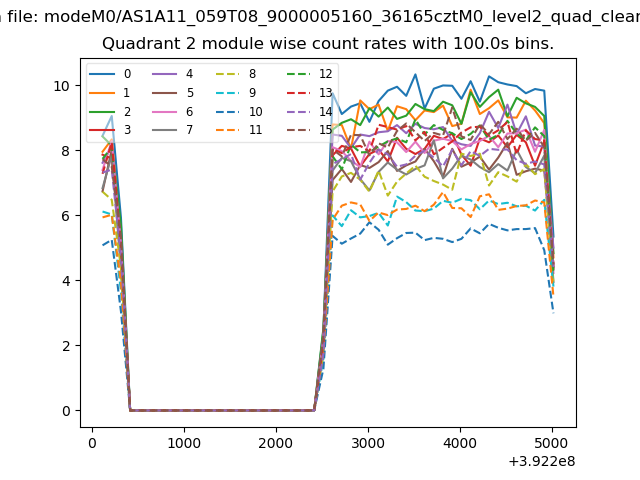
| Module-wise count rates for Quadrant A Data is divided into 100 sec bins |
 |
 |
| Module-wise count rates for Quadrant B Data is divided into 100 sec bins |
 |
 |
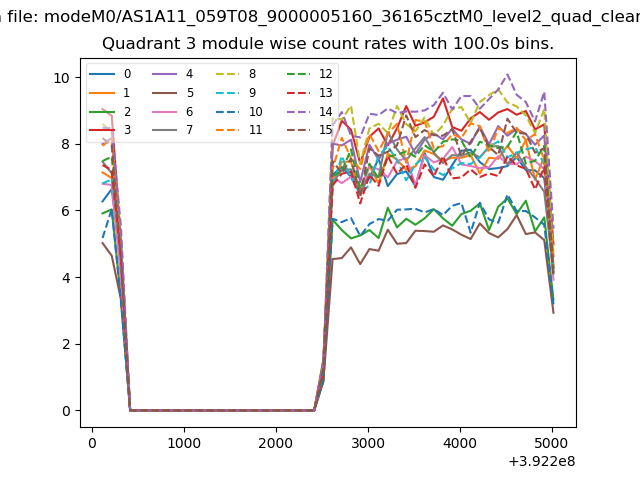
| Module-wise count rates for Quadrant C Data is divided into 100 sec bins |
 |
 |
| Module-wise count rates for Quadrant D Data is divided into 100 sec bins |
 |
 |
| Parameter | Plot |
|---|---|
| CZT HV Monitor | 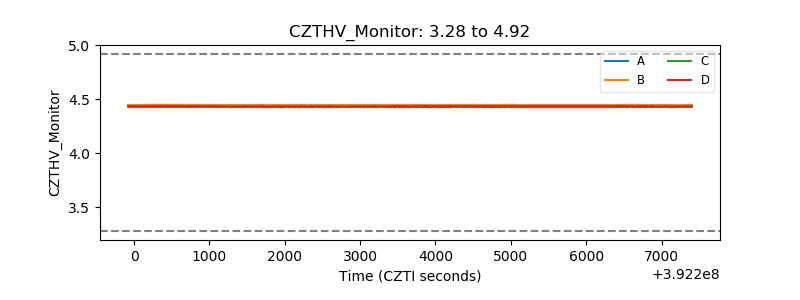 |
| D_VDD | 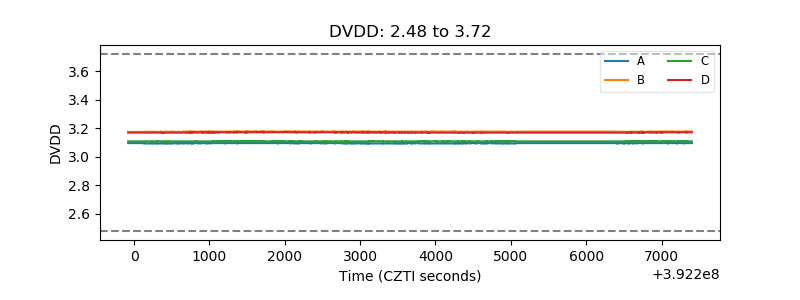 |
| Temperature 1 | 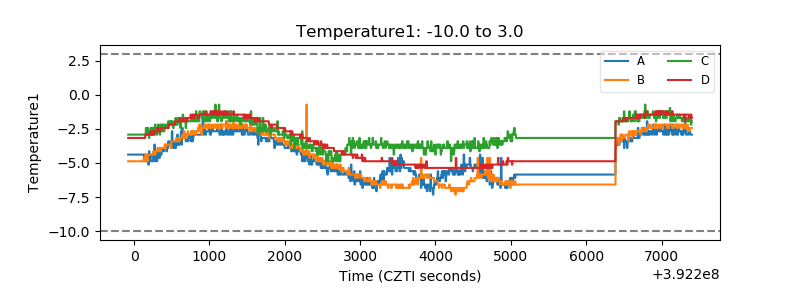 |
| Veto HV Monitor | 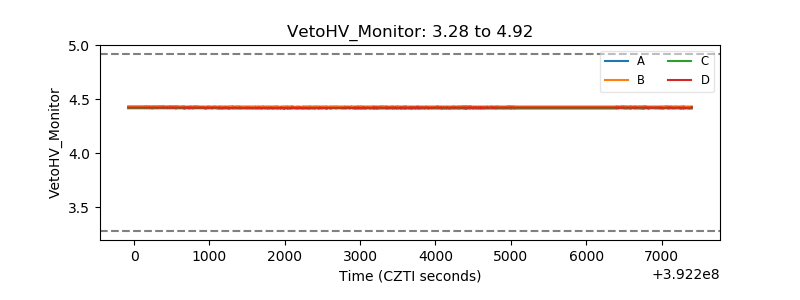 |
| Veto LLD | 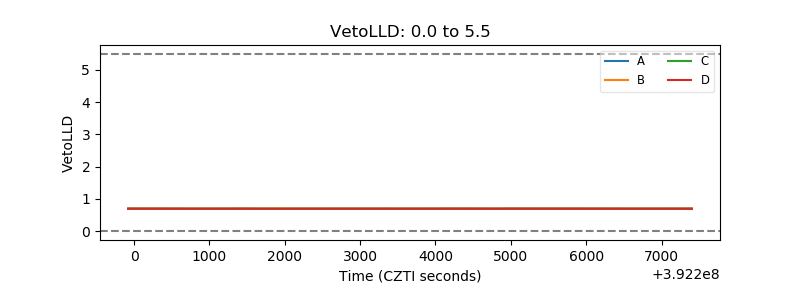 |
| Alpha Counter | 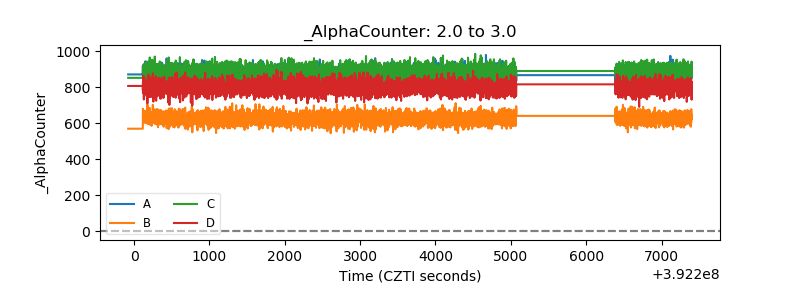 |
| _CPM_Rate | 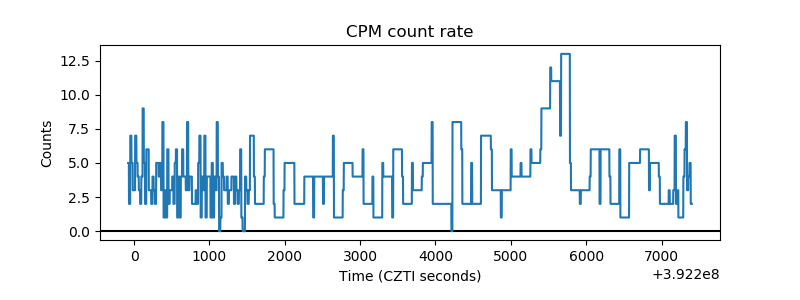 |
| CZT Counter | 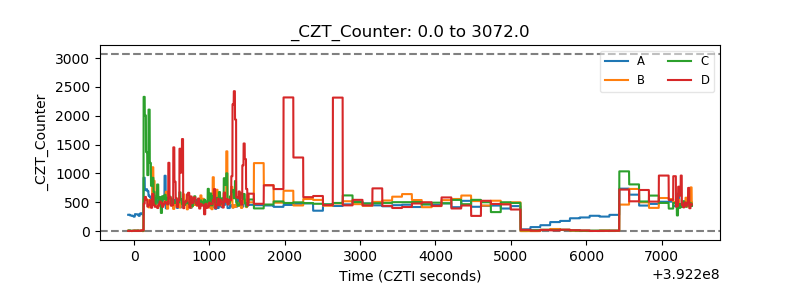 |
| +2.5 Volts monitor | 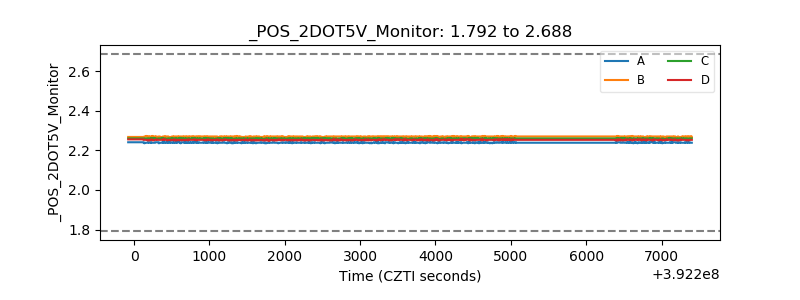 |
| +5 Volts monitor | 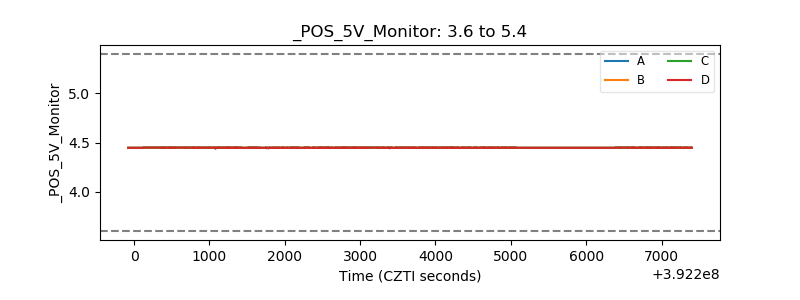 |
| _ROLL_ROT | 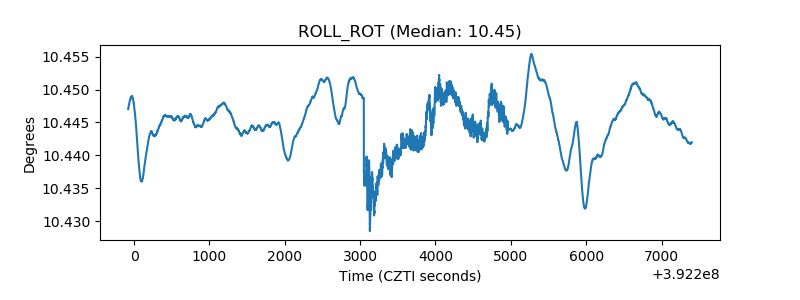 |
| _Roll_DEC | 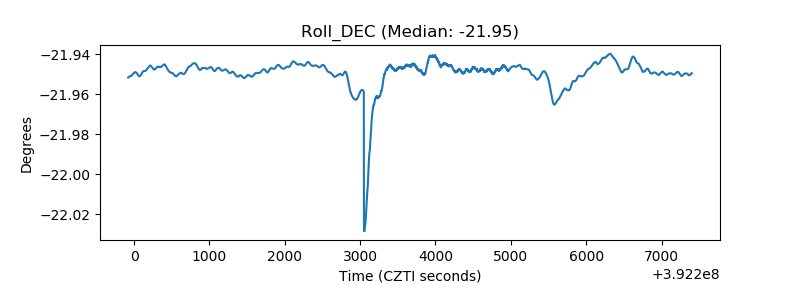 |
| _Roll_RA | 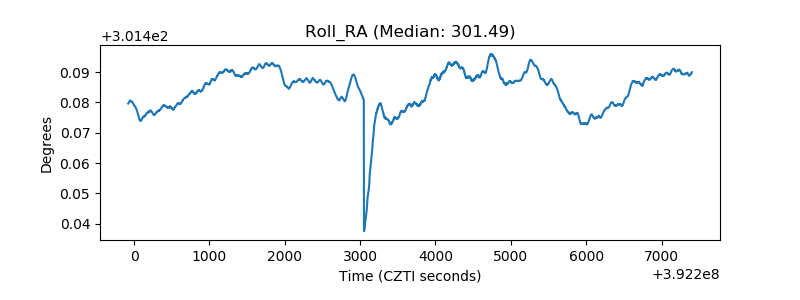 |
| Veto Counter | 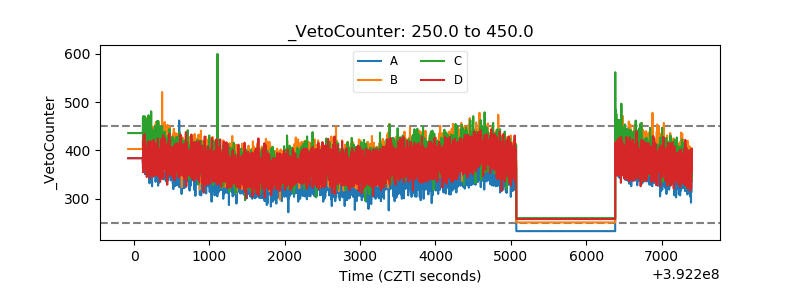 |