| Param | Original file | Final file |
|---|---|---|
| Filename | modeM0/AS1A11_059T08_9000005160_36163cztM0_level2.evt | modeM0/AS1A11_059T08_9000005160_36163cztM0_level2_quad_clean.evt |
| Size (bytes) | 803,093,760 | 88,536,960 |
| Size | 765.9 MB | 84.4 MB |
| Events in quadrant A | 4,406,272 | 519,443 |
| Events in quadrant B | 5,138,245 | 542,569 |
| Events in quadrant C | 5,422,620 | 518,535 |
| Events in quadrant D | 8,743,737 | 473,501 |
| Mode M9 | |||
|---|---|---|---|
| Quadrant | BADHDUFLAG | Total packets | Discarded packets |
| A | 0 | 37 | 0 |
| B | 0 | 37 | 0 |
| C | 0 | 37 | 0 |
| D | 0 | 37 | 0 |
| Mode M0 | |||
|---|---|---|---|
| Quadrant | BADHDUFLAG | Total packets | Discarded packets |
| A | 0 | 18591 | 3 |
| B | 0 | 20941 | 2 |
| C | 0 | 21419 | 2 |
| D | 0 | 32110 | 6 |
| Mode SS | |||
|---|---|---|---|
| Quadrant | BADHDUFLAG | Total packets | Discarded packets |
| A | 0 | 184 | 0 |
| B | 0 | 184 | 0 |
| C | 0 | 184 | 0 |
| D | 0 | 184 | 0 |
| Quadrant | Total seconds | Saturated seconds | Saturation percentage |
|---|---|---|---|
| A | 9035 | 18 | 0.199225% |
| B | 9035 | 209 | 2.313226% |
| C | 9035 | 121 | 1.339236% |
| D | 9034 | 1604 | 17.755147% |
Noise dominated data is calculated using 1-second bins in cleaned event files. If a bin has >2000 counts, and if more than 50% of those come from <1% of pixels, then it is considered to be noise-dominated and hence unusable.
| Quadrant | # 1 sec bins | Bins with >0 counts | Bins with >2000 counts | High rate bins dominated by noise | Noise dominated (total time) | Noise dominated (detector-on time) | Marked lightcurve |
|---|---|---|---|---|---|---|---|
| A | 12711 | 9037 | 8 | 8 | 0.06% | 0.09% | 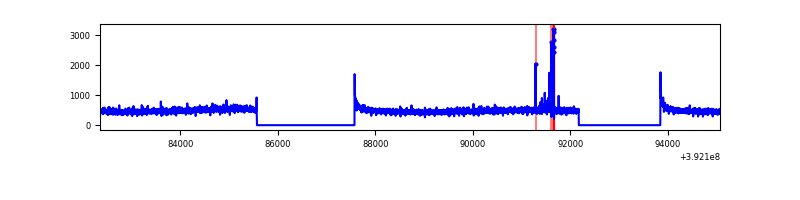 |
| B | 12711 | 9037 | 115 | 115 | 0.90% | 1.27% | 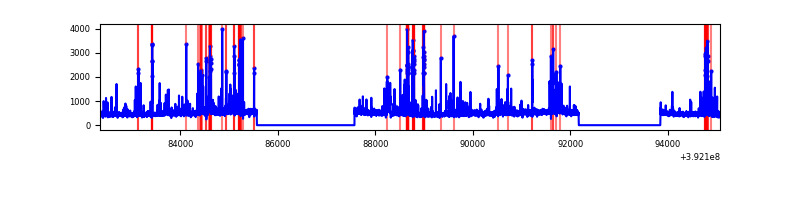 |
| C | 12711 | 9037 | 99 | 99 | 0.78% | 1.10% | 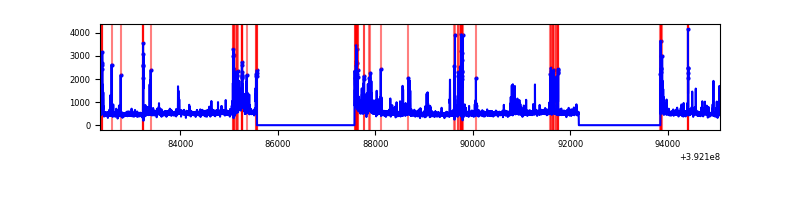 |
| D | 12711 | 9037 | 1351 | 1351 | 10.63% | 14.95% | 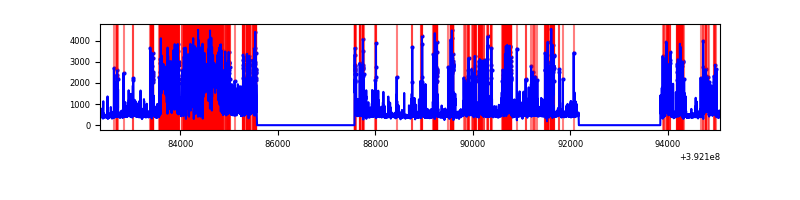 |
Top three noisy pixels from each quadrant. If the there are fewer than three noisy pixels in the level2.evt file, extra rows are filled as -1
| Pixel properties | Quadrant properties | ||||||
|---|---|---|---|---|---|---|---|
| Quadrant | DetID | PixID | Counts | Sigma | Mean | Median | Sigma |
| A | 10 | 83 | 234809 | 1096.65 | 1057 | 1034 | 213.2 |
| A | 9 | 143 | 38127 | 174.0 | 1057 | 1034 | 213.2 |
| A | 8 | 144 | 32431 | 147.28 | 1057 | 1034 | 213.2 |
| B | 5 | 172 | 518218 | 2573.72 | 1043 | 1016 | 201.0 |
| B | 0 | 246 | 155886 | 770.67 | 1043 | 1016 | 201.0 |
| B | 0 | 190 | 115646 | 570.42 | 1043 | 1016 | 201.0 |
| C | 15 | 208 | 530462 | 2231.16 | 1024 | 1035 | 237.3 |
| C | 15 | 214 | 388704 | 1633.75 | 1024 | 1035 | 237.3 |
| C | 0 | 207 | 330510 | 1388.51 | 1024 | 1035 | 237.3 |
| D | 2 | 249 | 2327831 | 10245.78 | 926 | 902 | 227.1 |
| D | 12 | 17 | 1212892 | 5336.56 | 926 | 902 | 227.1 |
| D | 13 | 249 | 530641 | 2332.51 | 926 | 902 | 227.1 |
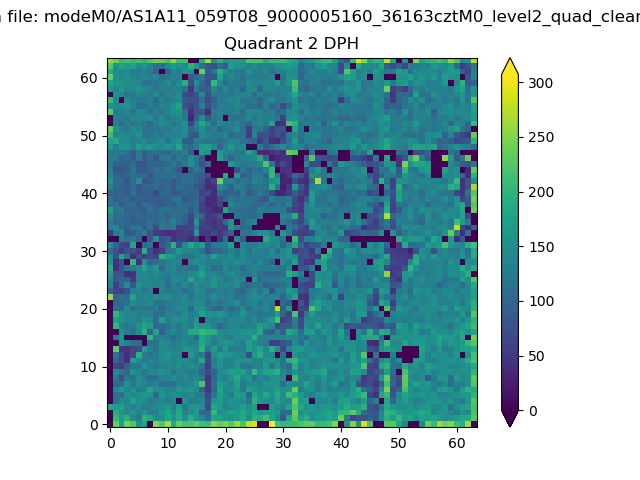
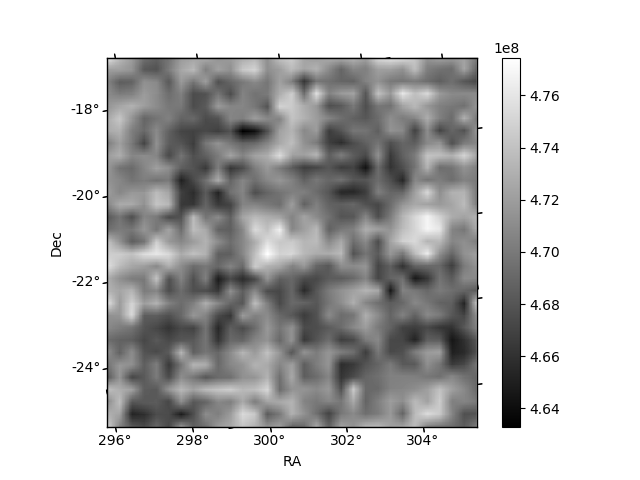
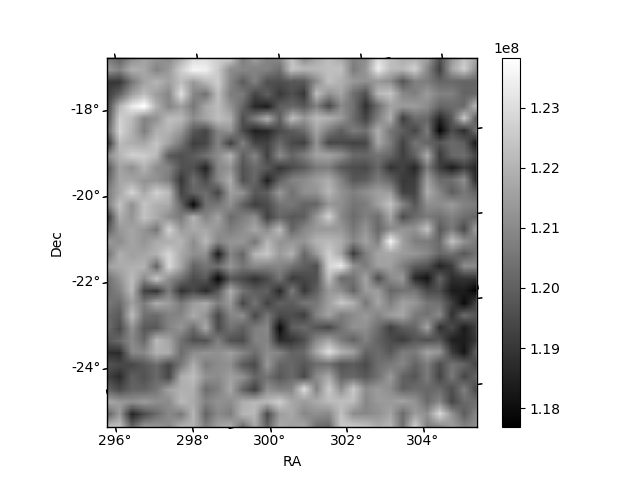
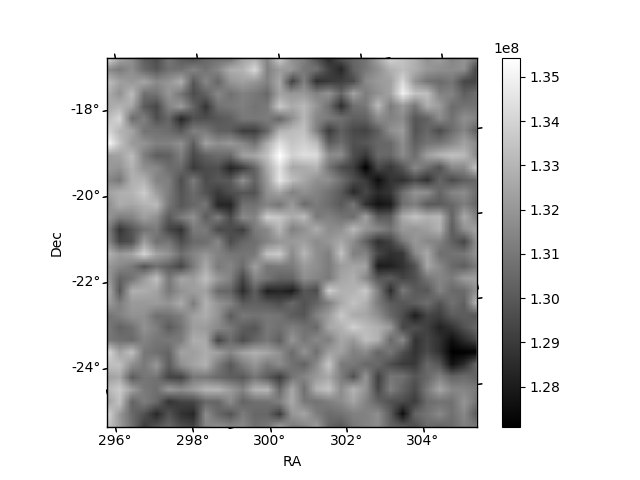
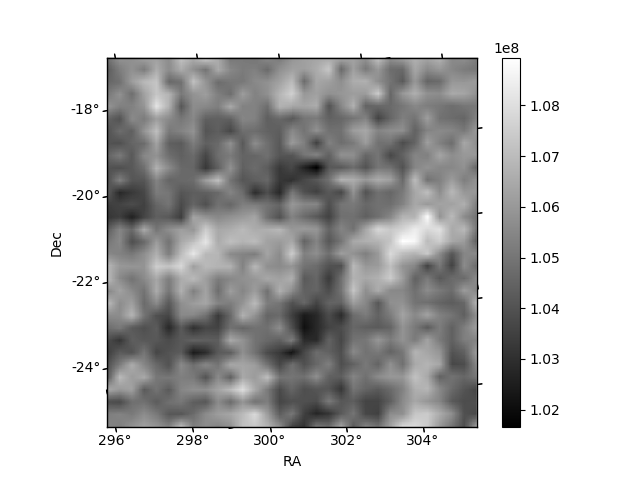
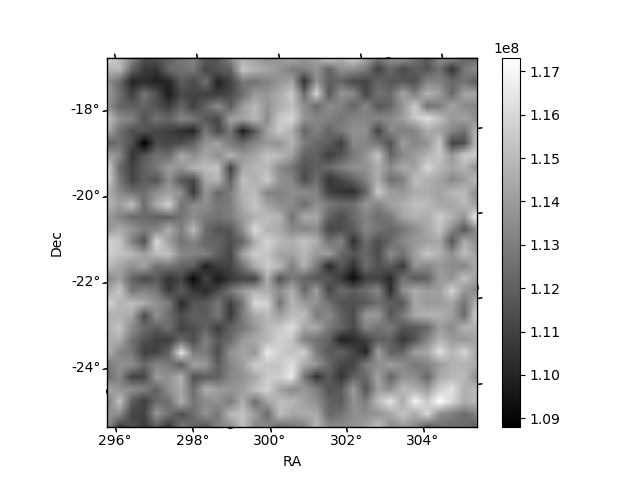
Histogram calculated using DETX and DETY for each event in the final _common_clean file
| Quadrant A | 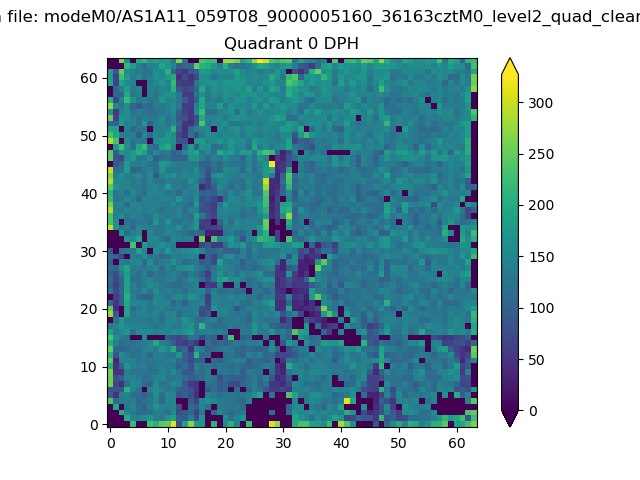 |
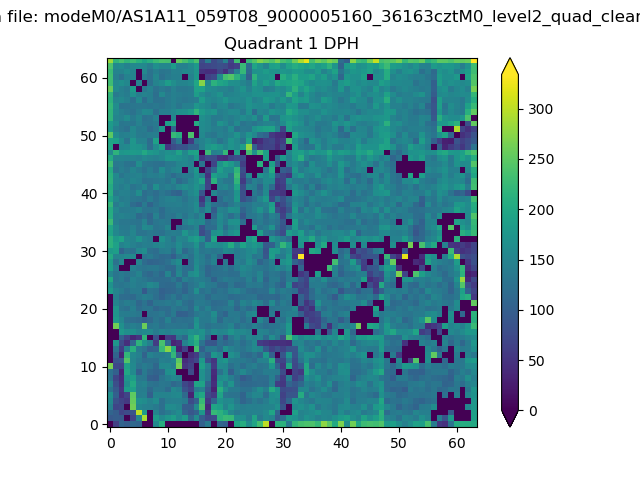 |
Quadrant B |
|---|---|---|---|
| Quadrant D | 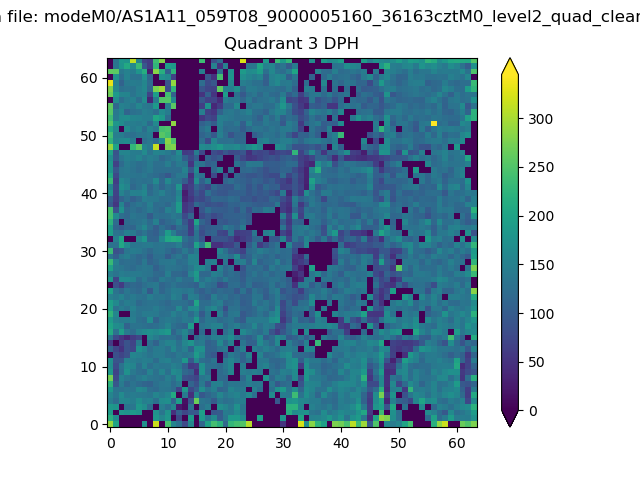 |
 |
Quadrant C |
| Plot type | Count rate plots | Images |
|---|---|---|
| Comparison with Poisson distribution Blue bars denote a histogram of data divided into 1 sec bins. Red curve is a Poisson curve with rate = median count rate of data. |
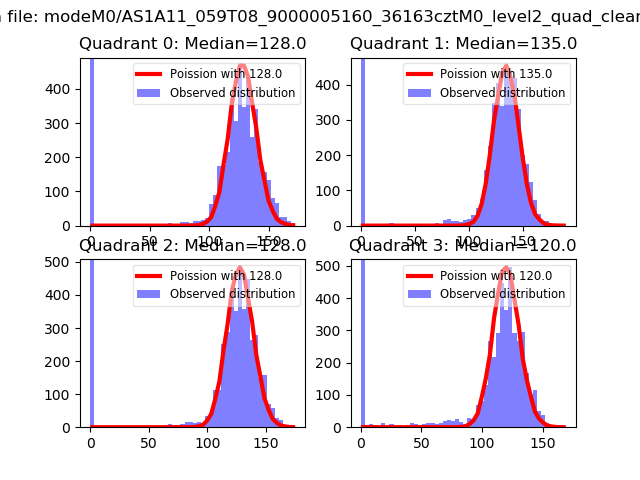 |
 |
| Quadrant-wise count rates Data is divided into 100 sec bins |
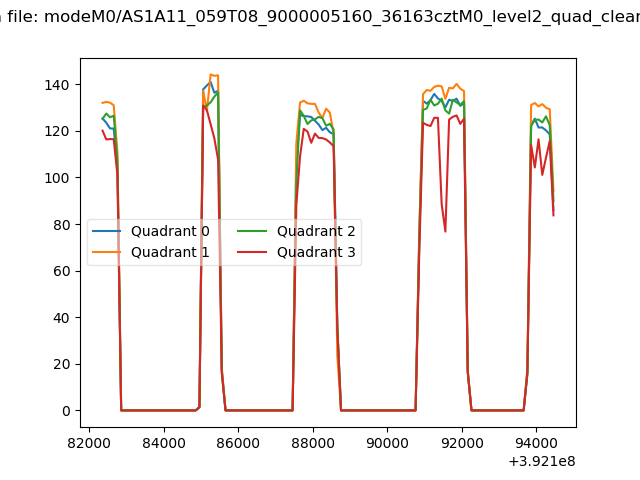 |
|
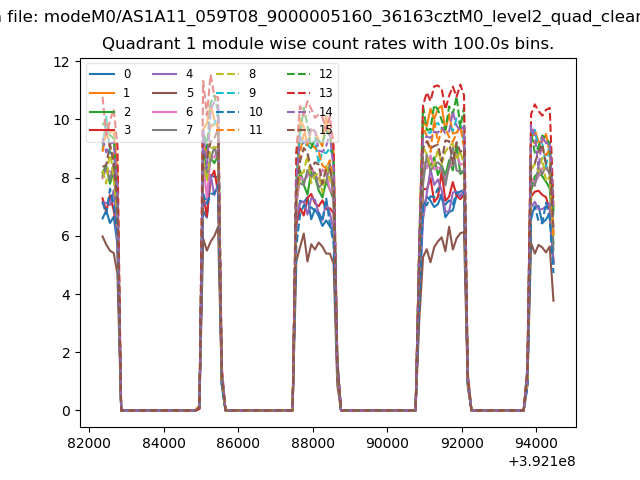
| Module-wise count rates for Quadrant A Data is divided into 100 sec bins |
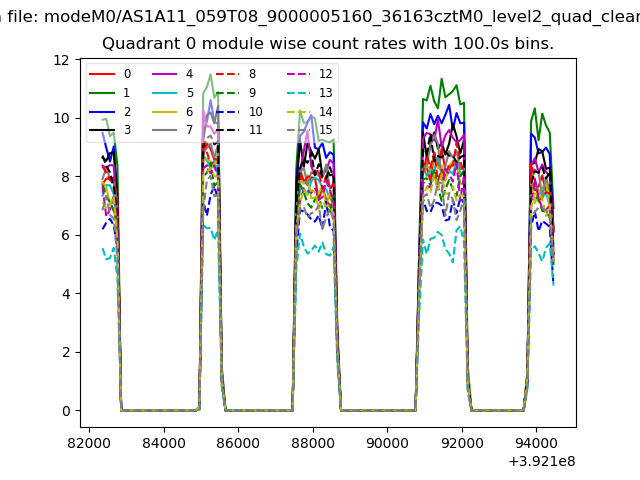 |
 |
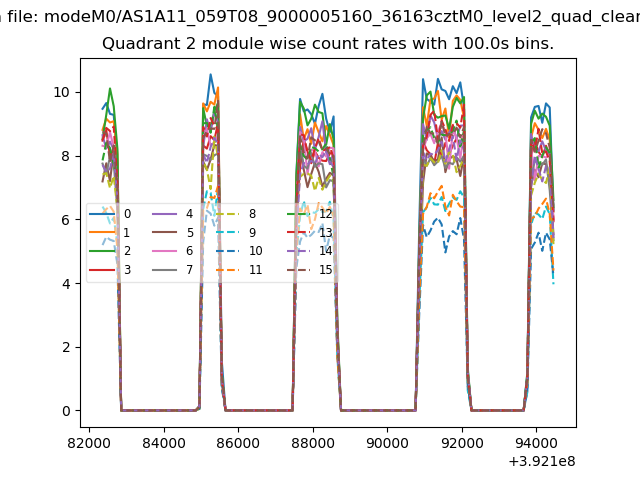
| Module-wise count rates for Quadrant B Data is divided into 100 sec bins |
 |
 |
| Module-wise count rates for Quadrant C Data is divided into 100 sec bins |
 |
 |
| Module-wise count rates for Quadrant D Data is divided into 100 sec bins |
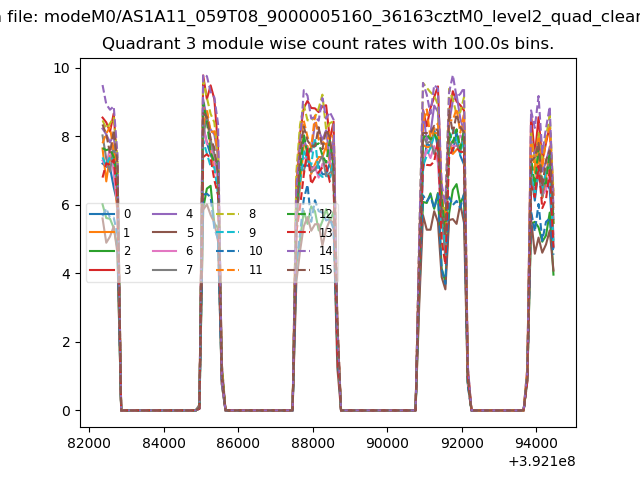 |
 |
| Parameter | Plot |
|---|---|
| CZT HV Monitor | 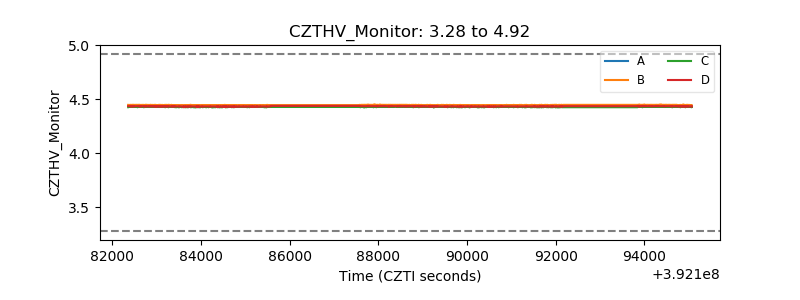 |
| D_VDD | 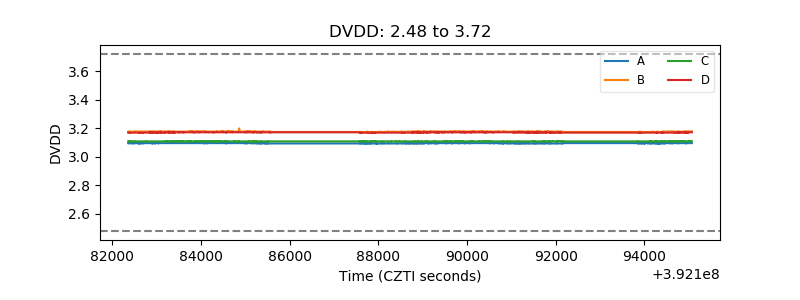 |
| Temperature 1 | 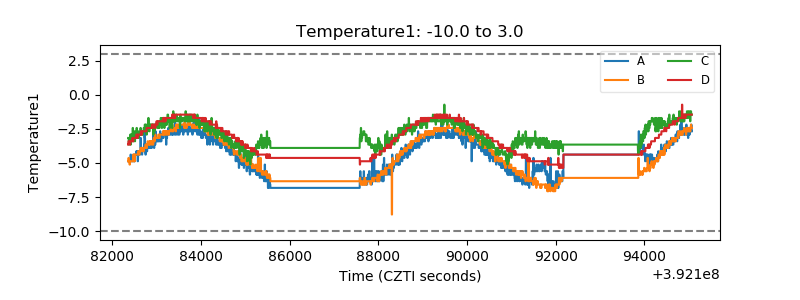 |
| Veto HV Monitor | 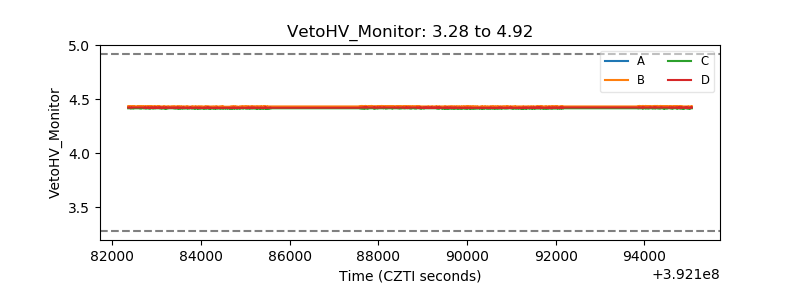 |
| Veto LLD | 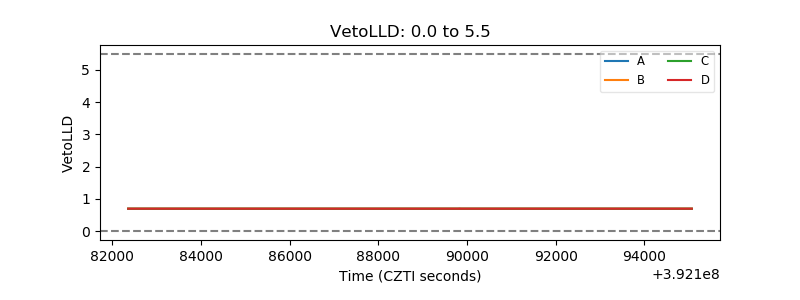 |
| Alpha Counter | 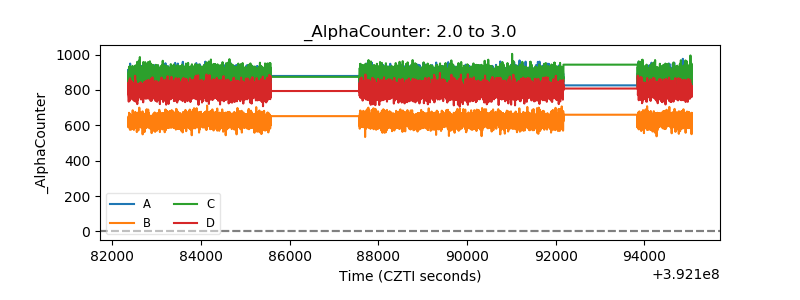 |
| _CPM_Rate | 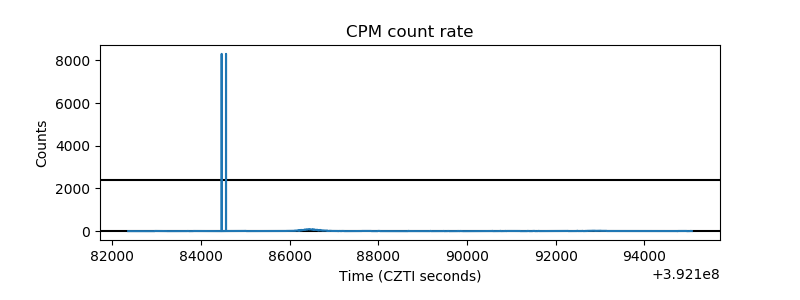 |
| CZT Counter | 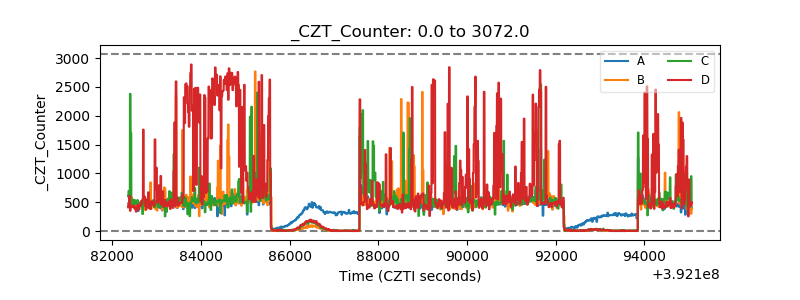 |
| +2.5 Volts monitor | 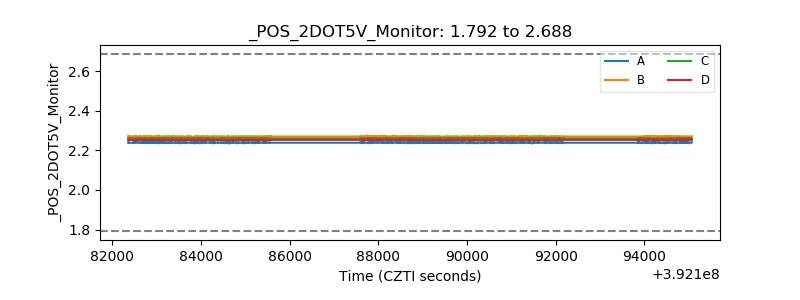 |
| +5 Volts monitor | 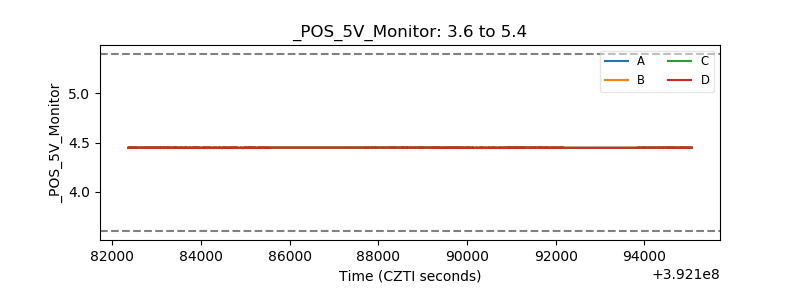 |
| _ROLL_ROT | 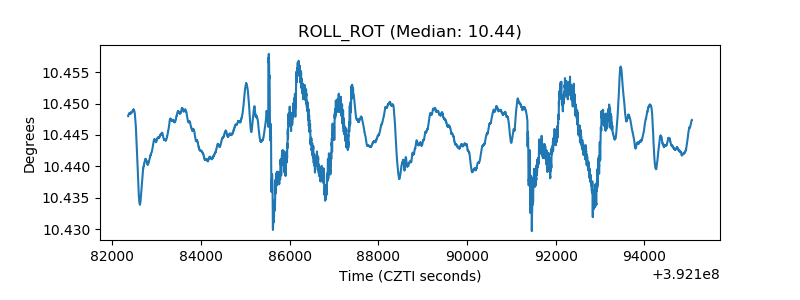 |
| _Roll_DEC | 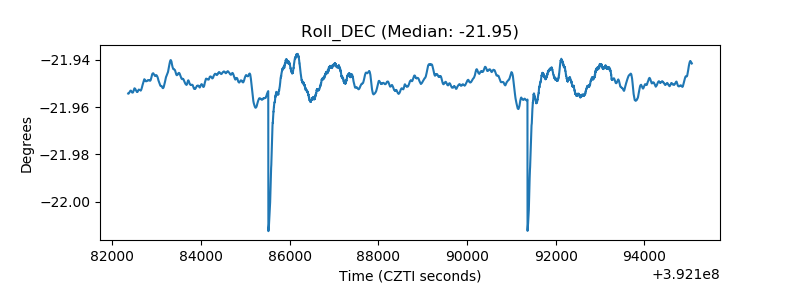 |
| _Roll_RA | 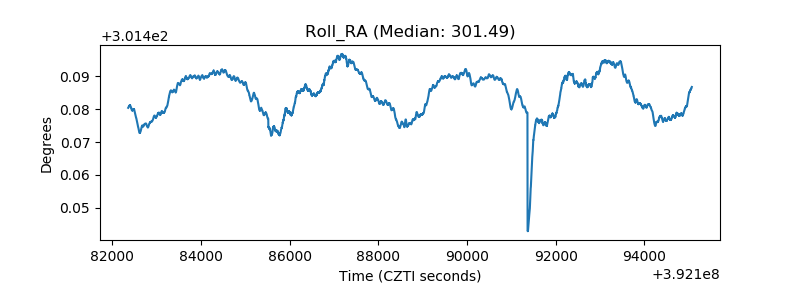 |
| Veto Counter | 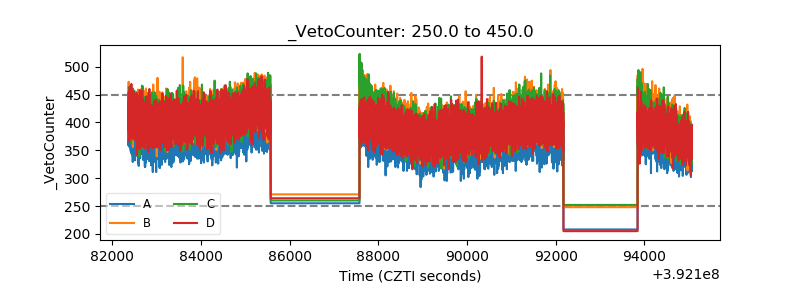 |