| Param | Original file | Final file |
|---|---|---|
| Filename | modeM0/AS1A11_059T08_9000005160_36160cztM0_level2.evt | modeM0/AS1A11_059T08_9000005160_36160cztM0_level2_quad_clean.evt |
| Size (bytes) | 432,858,240 | 79,318,080 |
| Size | 412.8 MB | 75.6 MB |
| Events in quadrant A | 2,721,657 | 504,243 |
| Events in quadrant B | 3,049,339 | 534,592 |
| Events in quadrant C | 3,285,644 | 510,486 |
| Events in quadrant D | 3,692,039 | 480,954 |
| Mode M9 | |||
|---|---|---|---|
| Quadrant | BADHDUFLAG | Total packets | Discarded packets |
| A | 0 | 30 | 0 |
| B | 0 | 30 | 0 |
| C | 0 | 30 | 0 |
| D | 0 | 31 | 0 |
| Mode M0 | |||
|---|---|---|---|
| Quadrant | BADHDUFLAG | Total packets | Discarded packets |
| A | 0 | 11207 | 3 |
| B | 0 | 12355 | 2 |
| C | 0 | 12845 | 2 |
| D | 0 | 14511 | 2 |
| Mode SS | |||
|---|---|---|---|
| Quadrant | BADHDUFLAG | Total packets | Discarded packets |
| A | 0 | 106 | 0 |
| B | 0 | 106 | 0 |
| C | 0 | 106 | 0 |
| D | 0 | 106 | 0 |
| Quadrant | Total seconds | Saturated seconds | Saturation percentage |
|---|---|---|---|
| A | 5316 | 7 | 0.131678% |
| B | 5316 | 39 | 0.733634% |
| C | 5316 | 69 | 1.297968% |
| D | 5316 | 299 | 5.624530% |
Noise dominated data is calculated using 1-second bins in cleaned event files. If a bin has >2000 counts, and if more than 50% of those come from <1% of pixels, then it is considered to be noise-dominated and hence unusable.
| Quadrant | # 1 sec bins | Bins with >0 counts | Bins with >2000 counts | High rate bins dominated by noise | Noise dominated (total time) | Noise dominated (detector-on time) | Marked lightcurve |
|---|---|---|---|---|---|---|---|
| A | 7439 | 5317 | 4 | 4 | 0.05% | 0.08% | 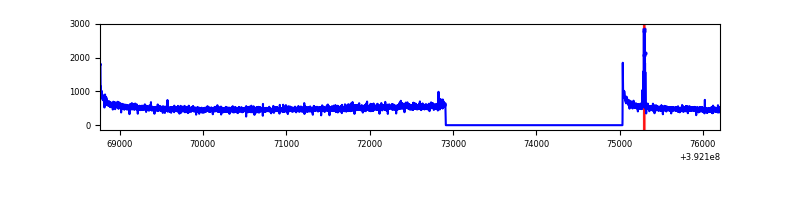 |
| B | 7439 | 5317 | 25 | 25 | 0.34% | 0.47% | 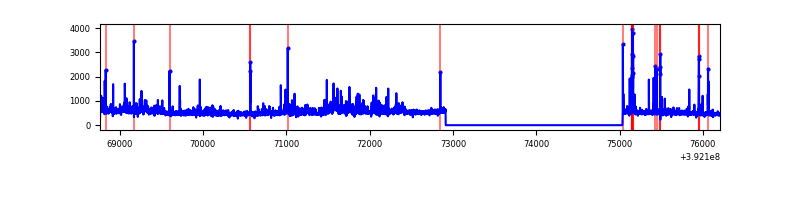 |
| C | 7439 | 5317 | 42 | 42 | 0.56% | 0.79% | 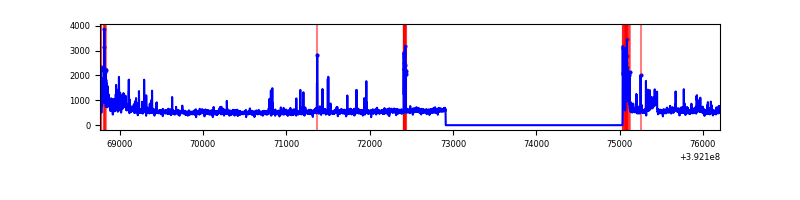 |
| D | 7439 | 5317 | 246 | 246 | 3.31% | 4.63% | 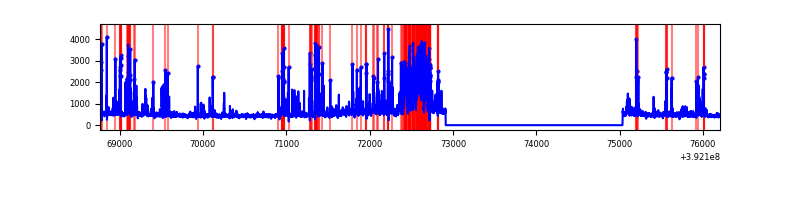 |
Top three noisy pixels from each quadrant. If the there are fewer than three noisy pixels in the level2.evt file, extra rows are filled as -1
| Pixel properties | Quadrant properties | ||||||
|---|---|---|---|---|---|---|---|
| Quadrant | DetID | PixID | Counts | Sigma | Mean | Median | Sigma |
| A | 10 | 83 | 175574 | 1346.97 | 647 | 635 | 129.9 |
| A | 9 | 143 | 29507 | 222.3 | 647 | 635 | 129.9 |
| A | 13 | 254 | 9304 | 66.75 | 647 | 635 | 129.9 |
| B | 5 | 172 | 211648 | 1707.58 | 651 | 635 | 123.6 |
| B | 0 | 213 | 203648 | 1642.84 | 651 | 635 | 123.6 |
| B | 0 | 190 | 30937 | 245.21 | 651 | 635 | 123.6 |
| C | 15 | 214 | 225147 | 1501.19 | 642 | 648 | 149.5 |
| C | 15 | 208 | 224135 | 1494.43 | 642 | 648 | 149.5 |
| C | 0 | 207 | 178847 | 1191.59 | 642 | 648 | 149.5 |
| D | 12 | 17 | 558058 | 3657.39 | 626 | 612 | 152.4 |
| D | 13 | 249 | 271607 | 1777.99 | 626 | 612 | 152.4 |
| D | 2 | 250 | 197795 | 1293.71 | 626 | 612 | 152.4 |
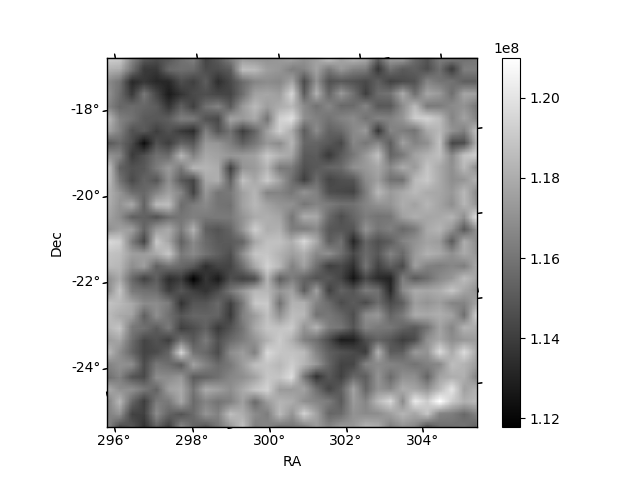
Histogram calculated using DETX and DETY for each event in the final _common_clean file
| Quadrant A | 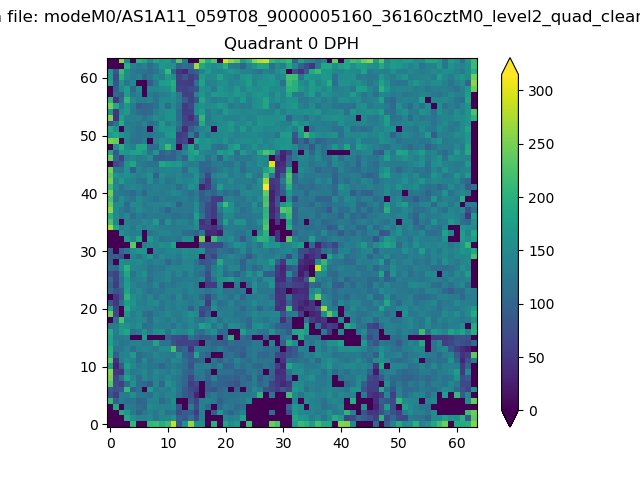 |
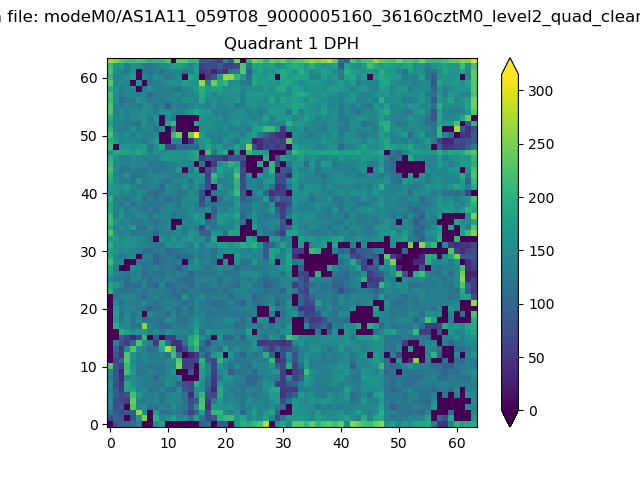 |
Quadrant B |
|---|---|---|---|
| Quadrant D | 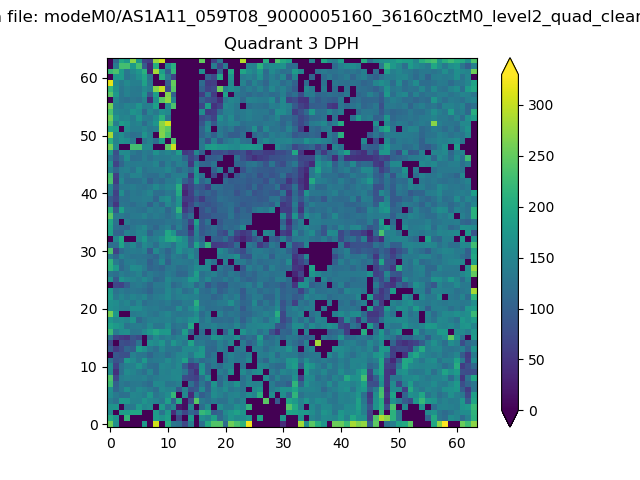 |
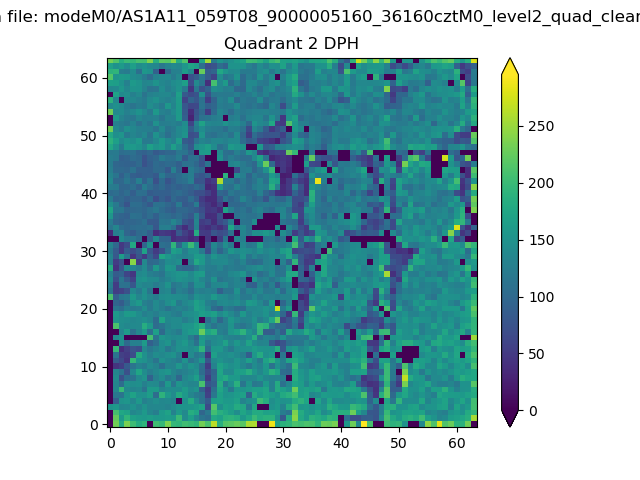 |
Quadrant C |
| Plot type | Count rate plots | Images |
|---|---|---|
| Comparison with Poisson distribution Blue bars denote a histogram of data divided into 1 sec bins. Red curve is a Poisson curve with rate = median count rate of data. |
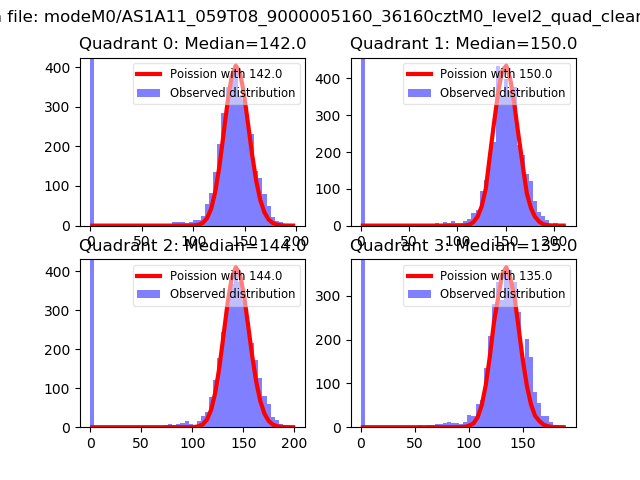 |
 |
| Quadrant-wise count rates Data is divided into 100 sec bins |
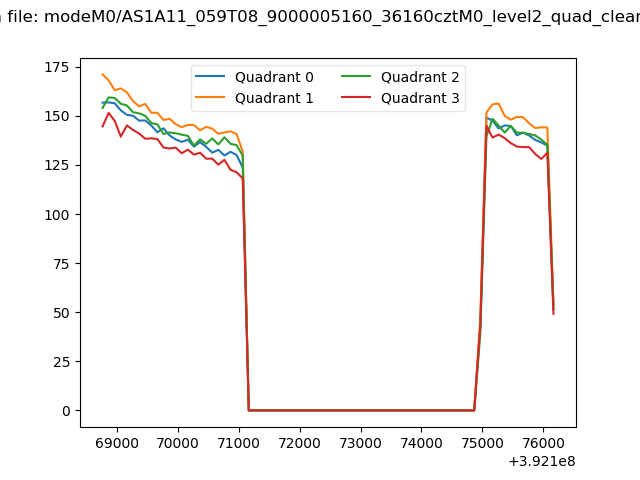 |
|
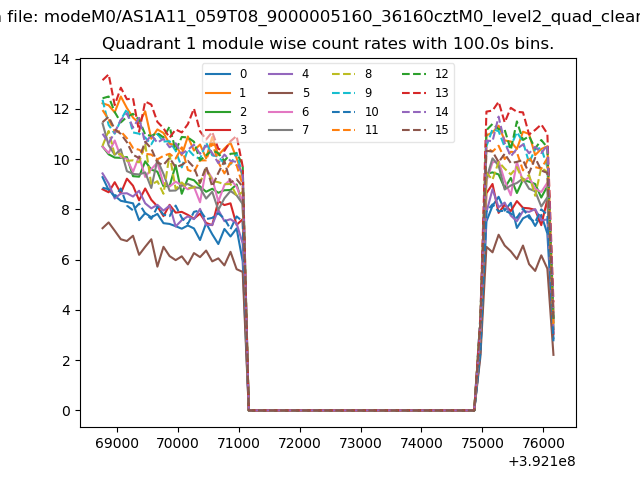
| Module-wise count rates for Quadrant A Data is divided into 100 sec bins |
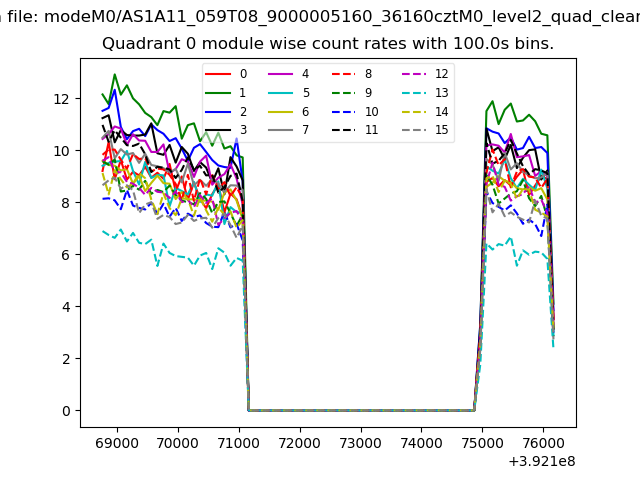 |
 |
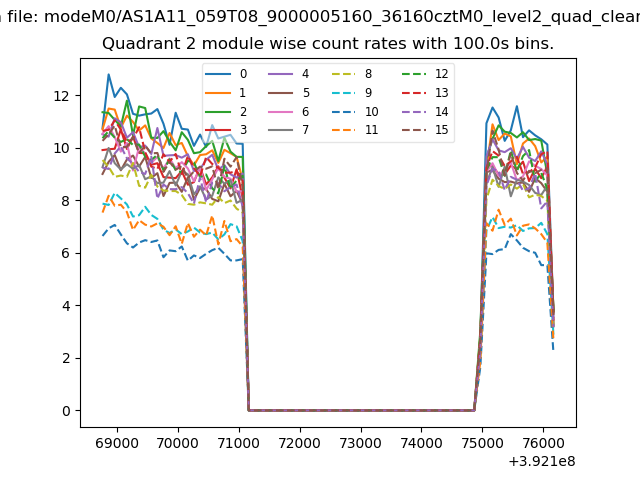
| Module-wise count rates for Quadrant B Data is divided into 100 sec bins |
 |
 |
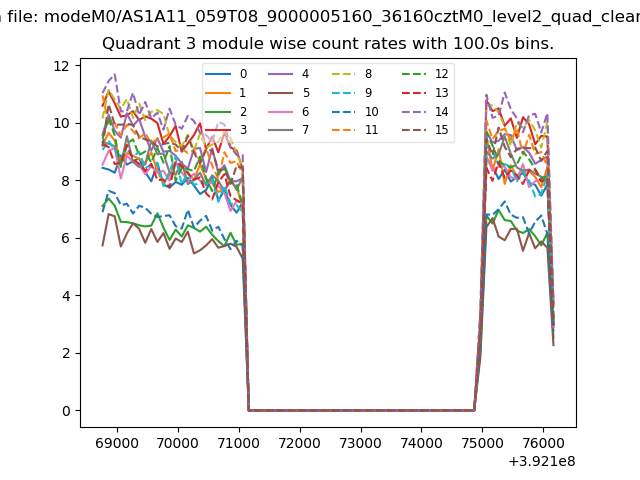
| Module-wise count rates for Quadrant C Data is divided into 100 sec bins |
 |
 |
| Module-wise count rates for Quadrant D Data is divided into 100 sec bins |
 |
 |
| Parameter | Plot |
|---|---|
| CZT HV Monitor | 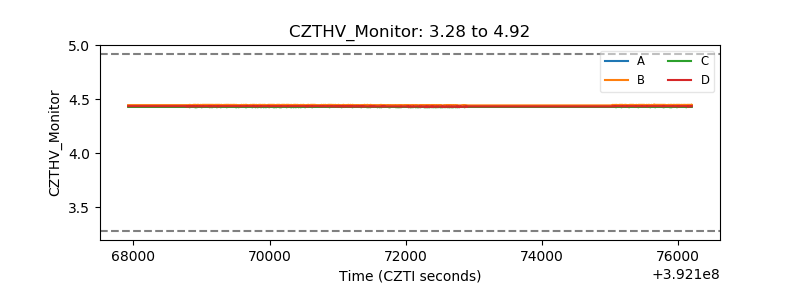 |
| D_VDD | 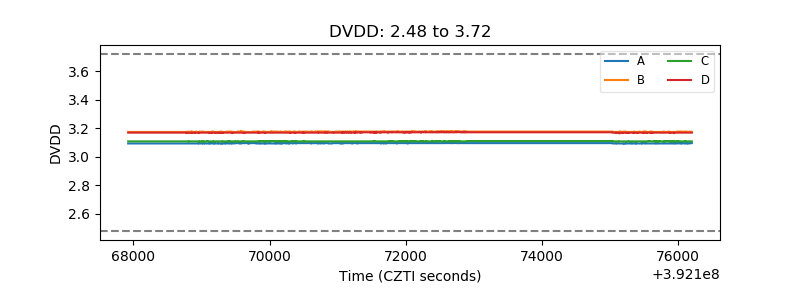 |
| Temperature 1 | 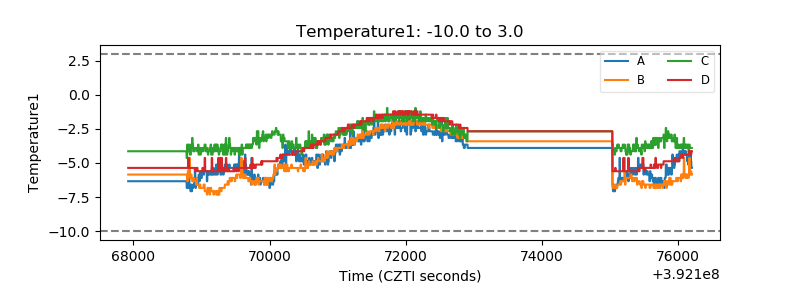 |
| Veto HV Monitor |  |
| Veto LLD | 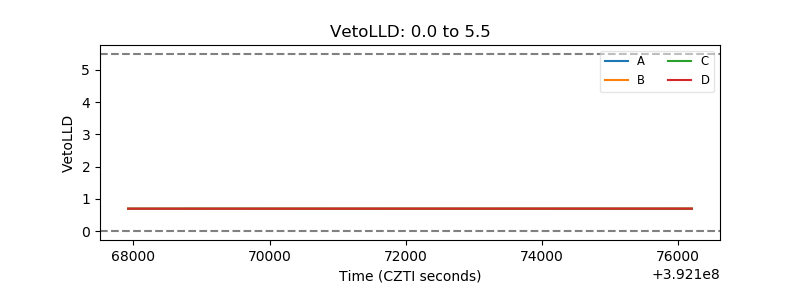 |
| Alpha Counter | 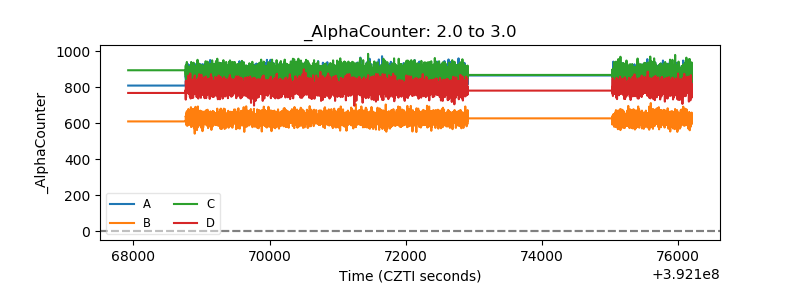 |
| _CPM_Rate | 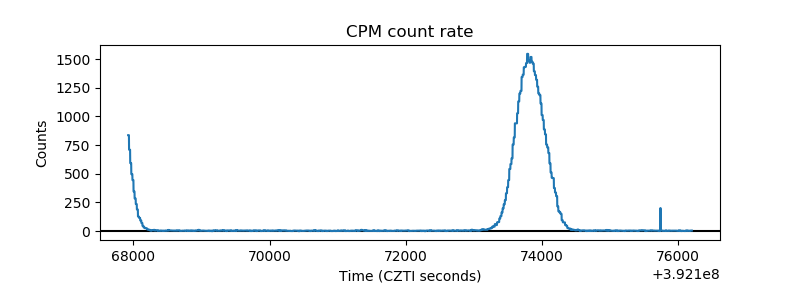 |
| CZT Counter | 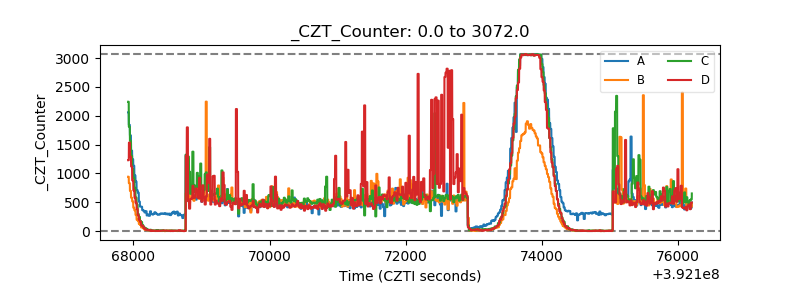 |
| +2.5 Volts monitor | 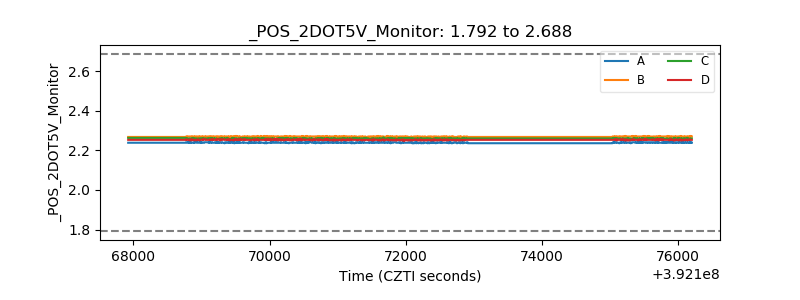 |
| +5 Volts monitor | 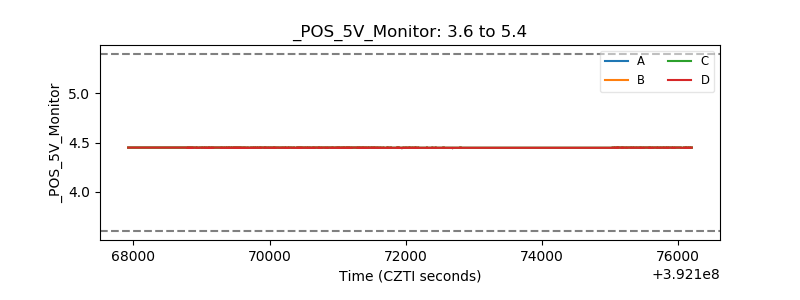 |
| _ROLL_ROT | 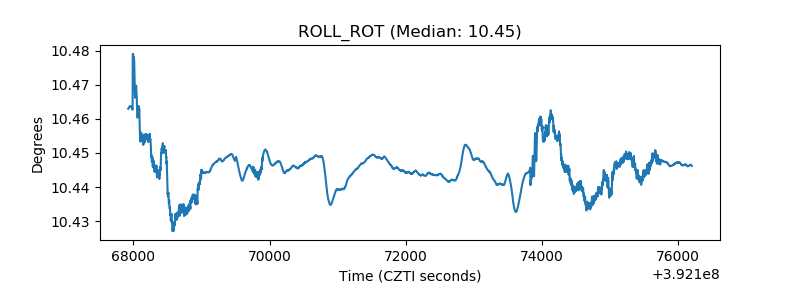 |
| _Roll_DEC | 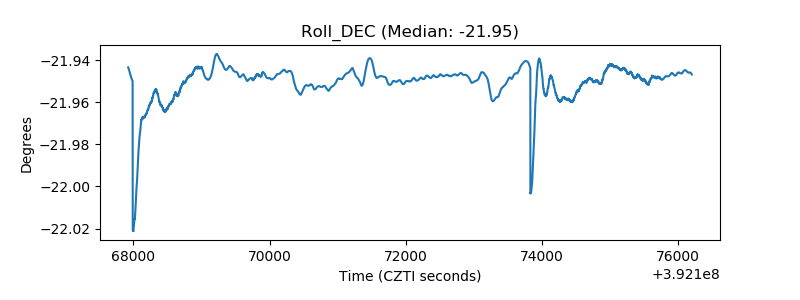 |
| _Roll_RA | 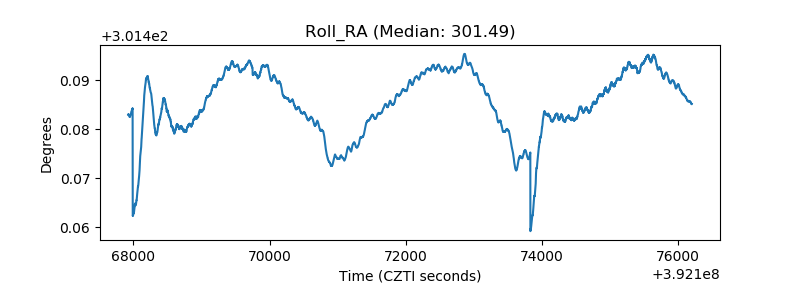 |
| Veto Counter | 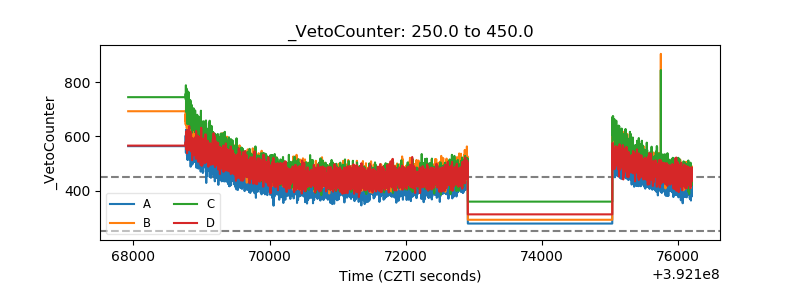 |